

Key Insights
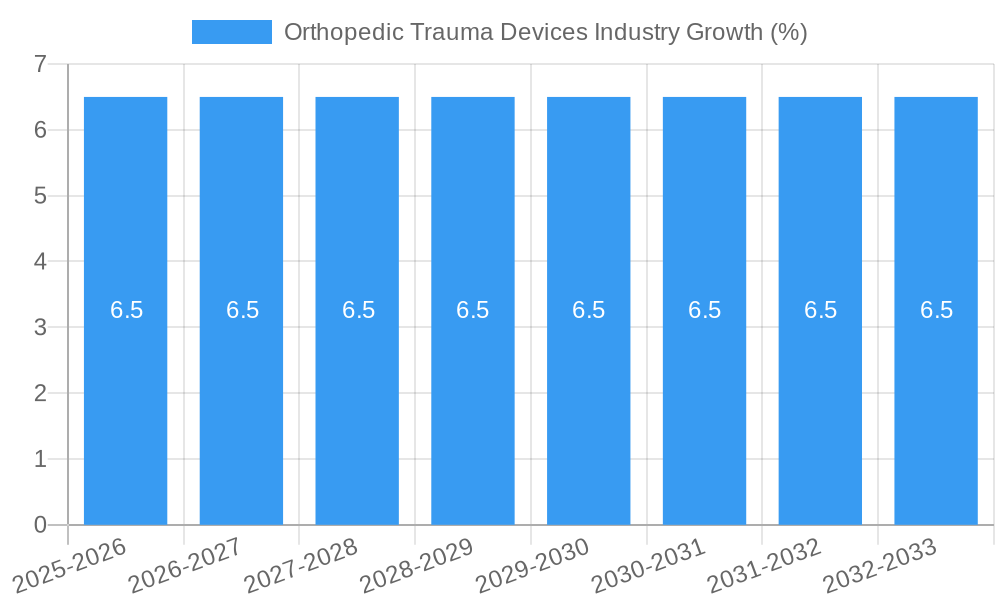
The global Orthopedic Trauma Devices market is poised for significant expansion, projected to reach approximately USD 25,800 million by 2025, with a robust Compound Annual Growth Rate (CAGR) of 6.50% from 2025 to 2033. This growth is propelled by a confluence of factors, including the increasing incidence of orthopedic trauma cases due to rising sports-related injuries, road accidents, and an aging global population susceptible to fractures. Advancements in medical technology, leading to the development of innovative and less invasive fixation devices, are also playing a crucial role. Furthermore, the growing awareness and adoption of advanced surgical techniques are driving demand for sophisticated orthopedic trauma implants and instruments. Key market segments like internal fixators, particularly plates and screws, are experiencing sustained demand due to their effectiveness in stabilizing fractures. Similarly, the lower extremities surgical site, encompassing hip and pelvic, foot and ankle, and knee injuries, represents a substantial market share, driven by the high prevalence of fractures in these areas. The expanding healthcare infrastructure and increasing healthcare expenditure, especially in emerging economies, are further bolstering market growth.
The competitive landscape for orthopedic trauma devices is characterized by the presence of several leading global players, including Smith & Nephew PLC, Stryker Corporation, and Medtronic PLC. These companies are actively engaged in research and development to introduce novel solutions, such as bioabsorbable implants and advanced imaging technologies, to cater to evolving surgical needs. Strategic collaborations, mergers, and acquisitions are also shaping the market dynamics, allowing companies to expand their product portfolios and geographical reach. The market's growth trajectory is influenced by trends such as the shift towards minimally invasive surgical procedures, the increasing use of patient-specific implants, and the integration of digital technologies in orthopedic care. However, challenges such as the high cost of advanced trauma devices, reimbursement issues, and stringent regulatory approvals may pose certain restraints to the market's full potential. Despite these challenges, the overall outlook for the orthopedic trauma devices market remains highly positive, driven by the persistent need for effective treatment solutions for bone fractures and dislocations worldwide.

Orthopedic Trauma Devices Industry Market Composition & Trends
The global orthopedic trauma devices market is a dynamic and expanding sector, driven by an increasing incidence of orthopedic injuries and a growing demand for advanced surgical interventions. Market concentration is moderately consolidated, with key players like Stryker Corporation, Zimmer Biomet, Johnson & Johnson, Medtronic PLC, and Smith & Nephew PLC holding significant market shares. The innovation landscape is constantly evolving, fueled by substantial R&D investments aimed at developing less invasive, faster-healing, and more patient-specific solutions. Regulatory frameworks, while stringent, are gradually adapting to accommodate novel technologies, ensuring patient safety and product efficacy. Substitute products, such as conservative treatment methods and non-surgical interventions, exist but are often outpaced by the efficacy of advanced orthopedic trauma devices for severe injuries. End-user profiles are diverse, encompassing large hospital networks, specialized trauma centers, and an increasing number of ambulatory surgery centers seeking cost-effective and efficient treatment pathways. Mergers and acquisitions (M&A) are a recurring theme, with significant deal values, such as the acquisition of Wright Medical by Stryker for approximately $5.4 Billion, shaping market consolidation and expanding product portfolios.
- Market Share Distribution: Leading companies hold a collective share of over 60%, with smaller players focusing on niche segments.
- M&A Deal Values: Recent M&A activities in the orthopedic trauma space have cumulatively reached billions of dollars, facilitating market consolidation and strategic expansion.
- Innovation Catalysts: Advancements in biomaterials, robotics, and minimally invasive surgical techniques are primary drivers of innovation.
- Regulatory Landscapes: FDA, CE Mark, and other regional regulatory approvals are critical for market entry and product commercialization.
Orthopedic Trauma Devices Industry Industry Evolution
The orthopedic trauma devices industry has undergone a significant transformation over the historical period of 2019-2024 and is projected to witness substantial growth through the forecast period of 2025-2033. This evolution is largely propelled by a confluence of factors including an aging global population susceptible to fractures and falls, a rise in sports-related injuries and accidents, and the increasing prevalence of chronic conditions like osteoporosis that weaken bones. Technological advancements have been a cornerstone of this evolution, moving from traditional rigid fixation methods to sophisticated internal and external fixation systems designed for enhanced stability, faster bone healing, and reduced invasiveness. For instance, the development of bioabsorbable implants and advanced locking screw technologies has significantly improved patient outcomes and reduced the need for revision surgeries.
The market has witnessed a steady upward trajectory in growth rates, with the base year of 2025 anticipated to see a robust expansion of approximately 7% year-over-year, driven by increased healthcare spending and a greater emphasis on orthopedic health. The adoption of new technologies has been accelerated by rising healthcare infrastructure development in emerging economies and the growing preference for minimally invasive surgical procedures, which lead to shorter hospital stays and quicker patient recovery times. Market players are continually investing in research and development, leading to innovations in materials science, such as the use of titanium alloys and advanced polymers, which offer superior biocompatibility and mechanical strength. Furthermore, the integration of digital technologies, including surgical planning software and navigation systems, is enhancing surgical precision and patient care, further solidifying the industry's growth momentum. The period between 2019 and 2024 saw initial impacts from global health events, leading to temporary disruptions, but also highlighted the essential nature of orthopedic trauma care, spurring resilience and future investment.
Leading Regions, Countries, or Segments in Orthopedic Trauma Devices Industry
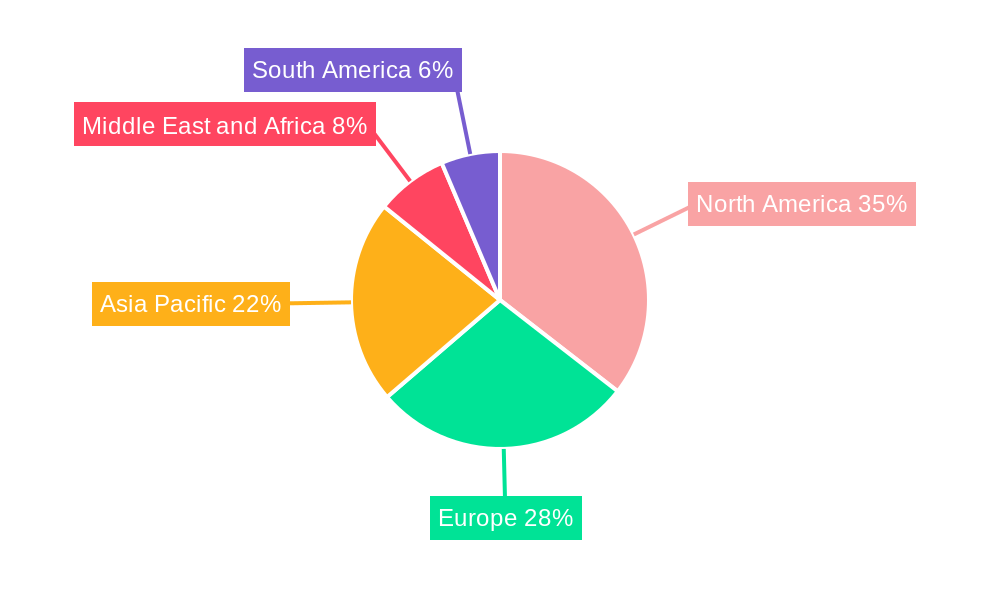
The global orthopedic trauma devices market is characterized by distinct regional strengths and segment dominance, with North America and Europe currently leading the charge, driven by advanced healthcare infrastructure, high disposable incomes, and a proactive approach to adopting new medical technologies. Within these regions, the Lower Extremities surgical site segment consistently commands the largest market share, primarily due to the higher incidence of fractures in the hip, pelvis, knee, foot, and ankle resulting from falls, accidents, and sports-related injuries. The Hip and Pelvic sub-segment, in particular, experiences high demand due to the significant impact of hip fractures on patient mobility and quality of life, especially among the elderly population.
Dominant Segment: Internal Fixators
- Plates and Screws: These remain the workhorses of orthopedic trauma surgery, offering versatile fixation for a wide range of fractures. Their widespread adoption is attributed to their proven efficacy, cost-effectiveness, and extensive clinical track record.
- Nails: Intramedullary nails are crucial for long bone fractures, offering load-sharing capabilities and promoting faster weight-bearing.
- Key Drivers: The continued preference for internal fixation methods due to their stability and reduced risk of infection compared to some external fixation methods.
Dominant Surgical Site: Lower Extremities
- Hip and Pelvic Fractures: High prevalence in aging populations and trauma cases, demanding robust and reliable fixation solutions.
- Knee and Foot/Ankle Fractures: Increasing incidence due to sports injuries and road accidents, requiring specialized implants for optimal joint function restoration.
- Key Drivers: Aging demographics, rising rates of osteoporosis, and increased participation in high-impact sports and outdoor activities.
Dominant End User: Hospitals
- Trauma Centers: These facilities are equipped with specialized surgical teams and advanced technology, driving demand for a comprehensive range of orthopedic trauma devices.
- General Hospitals: A significant portion of orthopedic trauma procedures are performed in general hospitals, catering to a broad spectrum of patient needs.
- Key Drivers: Availability of skilled surgeons, comprehensive medical infrastructure, and established reimbursement policies.
While North America and Europe currently lead, the Asia-Pacific region is emerging as a significant growth engine, fueled by increasing healthcare investments, a growing middle class, and a rising incidence of road traffic accidents and sports injuries. Countries like China and India are witnessing substantial market expansion, driven by improving healthcare access and the adoption of advanced surgical techniques.
Orthopedic Trauma Devices Industry Product Innovations
The orthopedic trauma devices industry is experiencing a surge of product innovations aimed at enhancing patient outcomes and streamlining surgical procedures. Advancements in minimally invasive surgical (MIS) techniques are leading to the development of smaller, more targeted implants and instrumentation, reducing tissue trauma and accelerating recovery times. For example, novel locking plate and screw systems are offering superior biomechanical stability, allowing for early mobilization and weight-bearing. Furthermore, the integration of advanced biomaterials, such as bioresorbable polymers and hydroxyapatite coatings, is promoting faster bone integration and reducing the risk of implant-related complications. Performance metrics are consistently improving, with enhanced fracture healing rates and reduced infection rates becoming standard benchmarks for new product introductions. The development of patient-specific implants, often designed using 3D printing technology based on individual patient anatomy, represents a significant leap towards personalized orthopedic trauma care.
Propelling Factors for Orthopedic Trauma Devices Industry Growth
Several key factors are propelling the growth of the orthopedic trauma devices industry.
- Aging Global Population: An increasing number of elderly individuals are susceptible to fractures due to age-related conditions like osteoporosis, driving demand for trauma devices.
- Rising Incidence of Traumatic Injuries: A surge in sports-related injuries, road traffic accidents, and industrial accidents contributes significantly to the demand for orthopedic trauma solutions.
- Technological Advancements: Innovations in materials science, surgical techniques (e.g., minimally invasive surgery), and implant design are leading to improved patient outcomes and market expansion.
- Growing Healthcare Expenditure and Infrastructure: Increased investment in healthcare facilities, particularly in emerging economies, and rising disposable incomes are making advanced orthopedic treatments more accessible.
- Increasing Awareness and Demand for Better Healthcare: Patients are increasingly aware of and seeking advanced treatment options to restore mobility and quality of life after traumatic injuries.
Obstacles in the Orthopedic Trauma Devices Industry Market
Despite its robust growth, the orthopedic trauma devices industry faces several obstacles.
- Stringent Regulatory Approvals: Obtaining regulatory clearance for new devices can be a lengthy and costly process, especially for novel technologies, leading to delayed market entry.
- High Cost of Advanced Devices: Sophisticated orthopedic trauma devices often come with a premium price tag, which can limit accessibility for patients in lower-income regions or those with limited insurance coverage.
- Reimbursement Challenges: Inconsistent or inadequate reimbursement policies from healthcare payers can impact the adoption and profitability of new devices.
- Supply Chain Disruptions: Global events, such as pandemics or geopolitical tensions, can disrupt the supply chain for critical components and raw materials, impacting manufacturing and distribution.
- Competition from Emerging Players: The market is becoming increasingly competitive with the emergence of new manufacturers, particularly in Asia, potentially leading to price erosion for established products.
Future Opportunities in Orthopedic Trauma Devices Industry
The future of the orthopedic trauma devices industry is ripe with opportunities.
- Emerging Markets: Significant untapped potential exists in rapidly developing economies in Asia-Pacific and Latin America, where rising healthcare spending and an increasing incidence of trauma cases present substantial growth avenues.
- Advancements in Robotics and AI: The integration of robotic-assisted surgery and artificial intelligence in surgical planning and execution promises enhanced precision, reduced invasiveness, and improved patient outcomes.
- Development of Smart Implants: The creation of "smart" implants with integrated sensors for real-time monitoring of healing progress and implant performance offers a revolutionary approach to post-operative care and rehabilitation.
- Focus on Personalized Medicine: Growing demand for patient-specific solutions, including custom-made implants and tailored treatment plans, will drive innovation in 3D printing and advanced customization technologies.
- Expansion of Ambulatory Surgery Centers (ASCs): The shift towards outpatient procedures in ASCs presents an opportunity for developing cost-effective and efficient orthopedic trauma solutions suitable for these settings.
Major Players in the Orthopedic Trauma Devices Industry Ecosystem
- Smith & Nephew PLC
- Arthrex Inc
- Braun Melsungen AG
- Invibio Ltd
- Cardinal Health Inc
- Medtronic PLC
- Orthofix Medical Inc
- Conmed Corporation
- Johnson & Johnson
- Stryker Corporation
- Zimmer Biomet
Key Developments in Orthopedic Trauma Devices Industry Industry
- October 2020: DePuy Synthes (Johnson & Johnson) launched the 'FIBULINK Syndesmosis Repair System' in the United States, addressing traumatic injuries to the syndesmosis and enhancing treatment options for ankle fractures.
- July 2020: Orthofix received FDA and CE Mark approval for its 'JuniOrtho plating system', specifically designed for pediatric patients requiring advanced deformity and trauma reconstruction of the lower extremities, marking a significant advancement in pediatric orthopedic trauma care.
Strategic Orthopedic Trauma Devices Industry Market Forecast
The orthopedic trauma devices market is poised for sustained growth, fueled by a combination of demographic shifts, technological innovation, and increasing global healthcare investments. The forecast period of 2025-2033 is expected to witness the continued dominance of internal fixators and the lower extremities surgical site segment, driven by the persistent need for effective fracture management. Emerging opportunities in minimally invasive techniques, smart implants, and personalized medicine will further shape market dynamics, while the expansion of healthcare infrastructure in developing regions will unlock significant growth potential. Strategic partnerships, product development focused on enhancing patient recovery, and an emphasis on cost-effectiveness will be crucial for players to capitalize on the evolving landscape and secure a substantial share in this vital medical device market.
Orthopedic Trauma Devices Industry Segmentation
-
1. Type
-
1.1. Internal Fixators
- 1.1.1. Plates
- 1.1.2. Screws
- 1.1.3. Nails
- 1.1.4. Others
-
1.2. External Fixators
- 1.2.1. Unilateral and Bilateral External Fixators
- 1.2.2. Circular Fixators
- 1.2.3. Hybrid Fixators
-
1.1. Internal Fixators
-
2. Surgical Site
-
2.1. Lower Extremities
- 2.1.1. Hip and Pelvic
- 2.1.2. Foot and Ankle
- 2.1.3. Knee
- 2.1.4. Others
-
2.2. Upper Extremities
- 2.2.1. Hand and Wrist
- 2.2.2. Shoulder
- 2.2.3. Spine
-
2.1. Lower Extremities
-
3. End User
- 3.1. Hospitals
- 3.2. Ambulatory Surgery Centers
- 3.3. Other End Users
Orthopedic Trauma Devices Industry Segmentation By Geography
-
1. North America
- 1.1. United States
- 1.2. Canada
- 1.3. Mexico
-
2. Europe
- 2.1. Germany
- 2.2. United Kingdom
- 2.3. France
- 2.4. Italy
- 2.5. Spain
- 2.6. Rest of Europe
-
3. Asia Pacific
- 3.1. China
- 3.2. Japan
- 3.3. India
- 3.4. Australia
- 3.5. South Korea
- 3.6. Rest of Asia Pacific
-
4. Middle East and Africa
- 4.1. GCC
- 4.2. South Africa
- 4.3. Rest of Middle East and Africa
-
5. South America
- 5.1. Brazil
- 5.2. Argentina
- 5.3. Rest of South America
Orthopedic Trauma Devices Industry REPORT HIGHLIGHTS
| Aspects | Details |
|---|---|
| Study Period | 2019-2033 |
| Base Year | 2024 |
| Estimated Year | 2025 |
| Forecast Period | 2025-2033 |
| Historical Period | 2019-2024 |
| Growth Rate | CAGR of 6.50% from 2019-2033 |
| Segmentation |
|
Table of Contents
- 1. Introduction
- 1.1. Research Scope
- 1.2. Market Segmentation
- 1.3. Research Methodology
- 1.4. Definitions and Assumptions
- 2. Executive Summary
- 2.1. Introduction
- 3. Market Dynamics
- 3.1. Introduction
- 3.2. Market Drivers
- 3.2.1. Growing Burden of Bone Degenerative Diseases; Increasing Number of Road Accidents; Technological Advancements in Medical Devices
- 3.3. Market Restrains
- 3.3.1. Lack of Trained Professionals; Stringent Regulatory Issues
- 3.4. Market Trends
- 3.4.1. Circular Fixators Segment is Expected to Hold a Major Share in the Trauma Fixation Devices Market
- 4. Market Factor Analysis
- 4.1. Porters Five Forces
- 4.2. Supply/Value Chain
- 4.3. PESTEL analysis
- 4.4. Market Entropy
- 4.5. Patent/Trademark Analysis
- 5. Global Orthopedic Trauma Devices Industry Analysis, Insights and Forecast, 2019-2031
- 5.1. Market Analysis, Insights and Forecast - by Type
- 5.1.1. Internal Fixators
- 5.1.1.1. Plates
- 5.1.1.2. Screws
- 5.1.1.3. Nails
- 5.1.1.4. Others
- 5.1.2. External Fixators
- 5.1.2.1. Unilateral and Bilateral External Fixators
- 5.1.2.2. Circular Fixators
- 5.1.2.3. Hybrid Fixators
- 5.1.1. Internal Fixators
- 5.2. Market Analysis, Insights and Forecast - by Surgical Site
- 5.2.1. Lower Extremities
- 5.2.1.1. Hip and Pelvic
- 5.2.1.2. Foot and Ankle
- 5.2.1.3. Knee
- 5.2.1.4. Others
- 5.2.2. Upper Extremities
- 5.2.2.1. Hand and Wrist
- 5.2.2.2. Shoulder
- 5.2.2.3. Spine
- 5.2.1. Lower Extremities
- 5.3. Market Analysis, Insights and Forecast - by End User
- 5.3.1. Hospitals
- 5.3.2. Ambulatory Surgery Centers
- 5.3.3. Other End Users
- 5.4. Market Analysis, Insights and Forecast - by Region
- 5.4.1. North America
- 5.4.2. Europe
- 5.4.3. Asia Pacific
- 5.4.4. Middle East and Africa
- 5.4.5. South America
- 5.1. Market Analysis, Insights and Forecast - by Type
- 6. North America Orthopedic Trauma Devices Industry Analysis, Insights and Forecast, 2019-2031
- 6.1. Market Analysis, Insights and Forecast - by Type
- 6.1.1. Internal Fixators
- 6.1.1.1. Plates
- 6.1.1.2. Screws
- 6.1.1.3. Nails
- 6.1.1.4. Others
- 6.1.2. External Fixators
- 6.1.2.1. Unilateral and Bilateral External Fixators
- 6.1.2.2. Circular Fixators
- 6.1.2.3. Hybrid Fixators
- 6.1.1. Internal Fixators
- 6.2. Market Analysis, Insights and Forecast - by Surgical Site
- 6.2.1. Lower Extremities
- 6.2.1.1. Hip and Pelvic
- 6.2.1.2. Foot and Ankle
- 6.2.1.3. Knee
- 6.2.1.4. Others
- 6.2.2. Upper Extremities
- 6.2.2.1. Hand and Wrist
- 6.2.2.2. Shoulder
- 6.2.2.3. Spine
- 6.2.1. Lower Extremities
- 6.3. Market Analysis, Insights and Forecast - by End User
- 6.3.1. Hospitals
- 6.3.2. Ambulatory Surgery Centers
- 6.3.3. Other End Users
- 6.1. Market Analysis, Insights and Forecast - by Type
- 7. Europe Orthopedic Trauma Devices Industry Analysis, Insights and Forecast, 2019-2031
- 7.1. Market Analysis, Insights and Forecast - by Type
- 7.1.1. Internal Fixators
- 7.1.1.1. Plates
- 7.1.1.2. Screws
- 7.1.1.3. Nails
- 7.1.1.4. Others
- 7.1.2. External Fixators
- 7.1.2.1. Unilateral and Bilateral External Fixators
- 7.1.2.2. Circular Fixators
- 7.1.2.3. Hybrid Fixators
- 7.1.1. Internal Fixators
- 7.2. Market Analysis, Insights and Forecast - by Surgical Site
- 7.2.1. Lower Extremities
- 7.2.1.1. Hip and Pelvic
- 7.2.1.2. Foot and Ankle
- 7.2.1.3. Knee
- 7.2.1.4. Others
- 7.2.2. Upper Extremities
- 7.2.2.1. Hand and Wrist
- 7.2.2.2. Shoulder
- 7.2.2.3. Spine
- 7.2.1. Lower Extremities
- 7.3. Market Analysis, Insights and Forecast - by End User
- 7.3.1. Hospitals
- 7.3.2. Ambulatory Surgery Centers
- 7.3.3. Other End Users
- 7.1. Market Analysis, Insights and Forecast - by Type
- 8. Asia Pacific Orthopedic Trauma Devices Industry Analysis, Insights and Forecast, 2019-2031
- 8.1. Market Analysis, Insights and Forecast - by Type
- 8.1.1. Internal Fixators
- 8.1.1.1. Plates
- 8.1.1.2. Screws
- 8.1.1.3. Nails
- 8.1.1.4. Others
- 8.1.2. External Fixators
- 8.1.2.1. Unilateral and Bilateral External Fixators
- 8.1.2.2. Circular Fixators
- 8.1.2.3. Hybrid Fixators
- 8.1.1. Internal Fixators
- 8.2. Market Analysis, Insights and Forecast - by Surgical Site
- 8.2.1. Lower Extremities
- 8.2.1.1. Hip and Pelvic
- 8.2.1.2. Foot and Ankle
- 8.2.1.3. Knee
- 8.2.1.4. Others
- 8.2.2. Upper Extremities
- 8.2.2.1. Hand and Wrist
- 8.2.2.2. Shoulder
- 8.2.2.3. Spine
- 8.2.1. Lower Extremities
- 8.3. Market Analysis, Insights and Forecast - by End User
- 8.3.1. Hospitals
- 8.3.2. Ambulatory Surgery Centers
- 8.3.3. Other End Users
- 8.1. Market Analysis, Insights and Forecast - by Type
- 9. Middle East and Africa Orthopedic Trauma Devices Industry Analysis, Insights and Forecast, 2019-2031
- 9.1. Market Analysis, Insights and Forecast - by Type
- 9.1.1. Internal Fixators
- 9.1.1.1. Plates
- 9.1.1.2. Screws
- 9.1.1.3. Nails
- 9.1.1.4. Others
- 9.1.2. External Fixators
- 9.1.2.1. Unilateral and Bilateral External Fixators
- 9.1.2.2. Circular Fixators
- 9.1.2.3. Hybrid Fixators
- 9.1.1. Internal Fixators
- 9.2. Market Analysis, Insights and Forecast - by Surgical Site
- 9.2.1. Lower Extremities
- 9.2.1.1. Hip and Pelvic
- 9.2.1.2. Foot and Ankle
- 9.2.1.3. Knee
- 9.2.1.4. Others
- 9.2.2. Upper Extremities
- 9.2.2.1. Hand and Wrist
- 9.2.2.2. Shoulder
- 9.2.2.3. Spine
- 9.2.1. Lower Extremities
- 9.3. Market Analysis, Insights and Forecast - by End User
- 9.3.1. Hospitals
- 9.3.2. Ambulatory Surgery Centers
- 9.3.3. Other End Users
- 9.1. Market Analysis, Insights and Forecast - by Type
- 10. South America Orthopedic Trauma Devices Industry Analysis, Insights and Forecast, 2019-2031
- 10.1. Market Analysis, Insights and Forecast - by Type
- 10.1.1. Internal Fixators
- 10.1.1.1. Plates
- 10.1.1.2. Screws
- 10.1.1.3. Nails
- 10.1.1.4. Others
- 10.1.2. External Fixators
- 10.1.2.1. Unilateral and Bilateral External Fixators
- 10.1.2.2. Circular Fixators
- 10.1.2.3. Hybrid Fixators
- 10.1.1. Internal Fixators
- 10.2. Market Analysis, Insights and Forecast - by Surgical Site
- 10.2.1. Lower Extremities
- 10.2.1.1. Hip and Pelvic
- 10.2.1.2. Foot and Ankle
- 10.2.1.3. Knee
- 10.2.1.4. Others
- 10.2.2. Upper Extremities
- 10.2.2.1. Hand and Wrist
- 10.2.2.2. Shoulder
- 10.2.2.3. Spine
- 10.2.1. Lower Extremities
- 10.3. Market Analysis, Insights and Forecast - by End User
- 10.3.1. Hospitals
- 10.3.2. Ambulatory Surgery Centers
- 10.3.3. Other End Users
- 10.1. Market Analysis, Insights and Forecast - by Type
- 11. North America Orthopedic Trauma Devices Industry Analysis, Insights and Forecast, 2019-2031
- 11.1. Market Analysis, Insights and Forecast - By Country/Sub-region
- 11.1.1. undefined
- 12. Europe Orthopedic Trauma Devices Industry Analysis, Insights and Forecast, 2019-2031
- 12.1. Market Analysis, Insights and Forecast - By Country/Sub-region
- 12.1.1. undefined
- 13. Asia Pacific Orthopedic Trauma Devices Industry Analysis, Insights and Forecast, 2019-2031
- 13.1. Market Analysis, Insights and Forecast - By Country/Sub-region
- 13.1.1. undefined
- 14. Middle East and Africa Orthopedic Trauma Devices Industry Analysis, Insights and Forecast, 2019-2031
- 14.1. Market Analysis, Insights and Forecast - By Country/Sub-region
- 14.1.1. undefined
- 15. South America Orthopedic Trauma Devices Industry Analysis, Insights and Forecast, 2019-2031
- 15.1. Market Analysis, Insights and Forecast - By Country/Sub-region
- 15.1.1. undefined
- 16. Competitive Analysis
- 16.1. Global Market Share Analysis 2024
- 16.2. Company Profiles
- 16.2.1 Smith & Nephew PLC
- 16.2.1.1. Overview
- 16.2.1.2. Products
- 16.2.1.3. SWOT Analysis
- 16.2.1.4. Recent Developments
- 16.2.1.5. Financials (Based on Availability)
- 16.2.2 Arthrex Inc
- 16.2.2.1. Overview
- 16.2.2.2. Products
- 16.2.2.3. SWOT Analysis
- 16.2.2.4. Recent Developments
- 16.2.2.5. Financials (Based on Availability)
- 16.2.3 Braun Melsungen AG
- 16.2.3.1. Overview
- 16.2.3.2. Products
- 16.2.3.3. SWOT Analysis
- 16.2.3.4. Recent Developments
- 16.2.3.5. Financials (Based on Availability)
- 16.2.4 Invibio Ltd
- 16.2.4.1. Overview
- 16.2.4.2. Products
- 16.2.4.3. SWOT Analysis
- 16.2.4.4. Recent Developments
- 16.2.4.5. Financials (Based on Availability)
- 16.2.5 Cardinal Health Inc
- 16.2.5.1. Overview
- 16.2.5.2. Products
- 16.2.5.3. SWOT Analysis
- 16.2.5.4. Recent Developments
- 16.2.5.5. Financials (Based on Availability)
- 16.2.6 Medtronic PLC
- 16.2.6.1. Overview
- 16.2.6.2. Products
- 16.2.6.3. SWOT Analysis
- 16.2.6.4. Recent Developments
- 16.2.6.5. Financials (Based on Availability)
- 16.2.7 Orthofix Medical Inc
- 16.2.7.1. Overview
- 16.2.7.2. Products
- 16.2.7.3. SWOT Analysis
- 16.2.7.4. Recent Developments
- 16.2.7.5. Financials (Based on Availability)
- 16.2.8 Conmed Corporation
- 16.2.8.1. Overview
- 16.2.8.2. Products
- 16.2.8.3. SWOT Analysis
- 16.2.8.4. Recent Developments
- 16.2.8.5. Financials (Based on Availability)
- 16.2.9 Johnson & Johnson
- 16.2.9.1. Overview
- 16.2.9.2. Products
- 16.2.9.3. SWOT Analysis
- 16.2.9.4. Recent Developments
- 16.2.9.5. Financials (Based on Availability)
- 16.2.10 Stryker Corporation
- 16.2.10.1. Overview
- 16.2.10.2. Products
- 16.2.10.3. SWOT Analysis
- 16.2.10.4. Recent Developments
- 16.2.10.5. Financials (Based on Availability)
- 16.2.11 Zimmer Biomet
- 16.2.11.1. Overview
- 16.2.11.2. Products
- 16.2.11.3. SWOT Analysis
- 16.2.11.4. Recent Developments
- 16.2.11.5. Financials (Based on Availability)
- 16.2.1 Smith & Nephew PLC
List of Figures
- Figure 1: Global Orthopedic Trauma Devices Industry Revenue Breakdown (Million, %) by Region 2024 & 2032
- Figure 2: Global Orthopedic Trauma Devices Industry Volume Breakdown (K Unit, %) by Region 2024 & 2032
- Figure 3: North America Orthopedic Trauma Devices Industry Revenue (Million), by Country 2024 & 2032
- Figure 4: North America Orthopedic Trauma Devices Industry Volume (K Unit), by Country 2024 & 2032
- Figure 5: North America Orthopedic Trauma Devices Industry Revenue Share (%), by Country 2024 & 2032
- Figure 6: North America Orthopedic Trauma Devices Industry Volume Share (%), by Country 2024 & 2032
- Figure 7: Europe Orthopedic Trauma Devices Industry Revenue (Million), by Country 2024 & 2032
- Figure 8: Europe Orthopedic Trauma Devices Industry Volume (K Unit), by Country 2024 & 2032
- Figure 9: Europe Orthopedic Trauma Devices Industry Revenue Share (%), by Country 2024 & 2032
- Figure 10: Europe Orthopedic Trauma Devices Industry Volume Share (%), by Country 2024 & 2032
- Figure 11: Asia Pacific Orthopedic Trauma Devices Industry Revenue (Million), by Country 2024 & 2032
- Figure 12: Asia Pacific Orthopedic Trauma Devices Industry Volume (K Unit), by Country 2024 & 2032
- Figure 13: Asia Pacific Orthopedic Trauma Devices Industry Revenue Share (%), by Country 2024 & 2032
- Figure 14: Asia Pacific Orthopedic Trauma Devices Industry Volume Share (%), by Country 2024 & 2032
- Figure 15: Middle East and Africa Orthopedic Trauma Devices Industry Revenue (Million), by Country 2024 & 2032
- Figure 16: Middle East and Africa Orthopedic Trauma Devices Industry Volume (K Unit), by Country 2024 & 2032
- Figure 17: Middle East and Africa Orthopedic Trauma Devices Industry Revenue Share (%), by Country 2024 & 2032
- Figure 18: Middle East and Africa Orthopedic Trauma Devices Industry Volume Share (%), by Country 2024 & 2032
- Figure 19: South America Orthopedic Trauma Devices Industry Revenue (Million), by Country 2024 & 2032
- Figure 20: South America Orthopedic Trauma Devices Industry Volume (K Unit), by Country 2024 & 2032
- Figure 21: South America Orthopedic Trauma Devices Industry Revenue Share (%), by Country 2024 & 2032
- Figure 22: South America Orthopedic Trauma Devices Industry Volume Share (%), by Country 2024 & 2032
- Figure 23: North America Orthopedic Trauma Devices Industry Revenue (Million), by Type 2024 & 2032
- Figure 24: North America Orthopedic Trauma Devices Industry Volume (K Unit), by Type 2024 & 2032
- Figure 25: North America Orthopedic Trauma Devices Industry Revenue Share (%), by Type 2024 & 2032
- Figure 26: North America Orthopedic Trauma Devices Industry Volume Share (%), by Type 2024 & 2032
- Figure 27: North America Orthopedic Trauma Devices Industry Revenue (Million), by Surgical Site 2024 & 2032
- Figure 28: North America Orthopedic Trauma Devices Industry Volume (K Unit), by Surgical Site 2024 & 2032
- Figure 29: North America Orthopedic Trauma Devices Industry Revenue Share (%), by Surgical Site 2024 & 2032
- Figure 30: North America Orthopedic Trauma Devices Industry Volume Share (%), by Surgical Site 2024 & 2032
- Figure 31: North America Orthopedic Trauma Devices Industry Revenue (Million), by End User 2024 & 2032
- Figure 32: North America Orthopedic Trauma Devices Industry Volume (K Unit), by End User 2024 & 2032
- Figure 33: North America Orthopedic Trauma Devices Industry Revenue Share (%), by End User 2024 & 2032
- Figure 34: North America Orthopedic Trauma Devices Industry Volume Share (%), by End User 2024 & 2032
- Figure 35: North America Orthopedic Trauma Devices Industry Revenue (Million), by Country 2024 & 2032
- Figure 36: North America Orthopedic Trauma Devices Industry Volume (K Unit), by Country 2024 & 2032
- Figure 37: North America Orthopedic Trauma Devices Industry Revenue Share (%), by Country 2024 & 2032
- Figure 38: North America Orthopedic Trauma Devices Industry Volume Share (%), by Country 2024 & 2032
- Figure 39: Europe Orthopedic Trauma Devices Industry Revenue (Million), by Type 2024 & 2032
- Figure 40: Europe Orthopedic Trauma Devices Industry Volume (K Unit), by Type 2024 & 2032
- Figure 41: Europe Orthopedic Trauma Devices Industry Revenue Share (%), by Type 2024 & 2032
- Figure 42: Europe Orthopedic Trauma Devices Industry Volume Share (%), by Type 2024 & 2032
- Figure 43: Europe Orthopedic Trauma Devices Industry Revenue (Million), by Surgical Site 2024 & 2032
- Figure 44: Europe Orthopedic Trauma Devices Industry Volume (K Unit), by Surgical Site 2024 & 2032
- Figure 45: Europe Orthopedic Trauma Devices Industry Revenue Share (%), by Surgical Site 2024 & 2032
- Figure 46: Europe Orthopedic Trauma Devices Industry Volume Share (%), by Surgical Site 2024 & 2032
- Figure 47: Europe Orthopedic Trauma Devices Industry Revenue (Million), by End User 2024 & 2032
- Figure 48: Europe Orthopedic Trauma Devices Industry Volume (K Unit), by End User 2024 & 2032
- Figure 49: Europe Orthopedic Trauma Devices Industry Revenue Share (%), by End User 2024 & 2032
- Figure 50: Europe Orthopedic Trauma Devices Industry Volume Share (%), by End User 2024 & 2032
- Figure 51: Europe Orthopedic Trauma Devices Industry Revenue (Million), by Country 2024 & 2032
- Figure 52: Europe Orthopedic Trauma Devices Industry Volume (K Unit), by Country 2024 & 2032
- Figure 53: Europe Orthopedic Trauma Devices Industry Revenue Share (%), by Country 2024 & 2032
- Figure 54: Europe Orthopedic Trauma Devices Industry Volume Share (%), by Country 2024 & 2032
- Figure 55: Asia Pacific Orthopedic Trauma Devices Industry Revenue (Million), by Type 2024 & 2032
- Figure 56: Asia Pacific Orthopedic Trauma Devices Industry Volume (K Unit), by Type 2024 & 2032
- Figure 57: Asia Pacific Orthopedic Trauma Devices Industry Revenue Share (%), by Type 2024 & 2032
- Figure 58: Asia Pacific Orthopedic Trauma Devices Industry Volume Share (%), by Type 2024 & 2032
- Figure 59: Asia Pacific Orthopedic Trauma Devices Industry Revenue (Million), by Surgical Site 2024 & 2032
- Figure 60: Asia Pacific Orthopedic Trauma Devices Industry Volume (K Unit), by Surgical Site 2024 & 2032
- Figure 61: Asia Pacific Orthopedic Trauma Devices Industry Revenue Share (%), by Surgical Site 2024 & 2032
- Figure 62: Asia Pacific Orthopedic Trauma Devices Industry Volume Share (%), by Surgical Site 2024 & 2032
- Figure 63: Asia Pacific Orthopedic Trauma Devices Industry Revenue (Million), by End User 2024 & 2032
- Figure 64: Asia Pacific Orthopedic Trauma Devices Industry Volume (K Unit), by End User 2024 & 2032
- Figure 65: Asia Pacific Orthopedic Trauma Devices Industry Revenue Share (%), by End User 2024 & 2032
- Figure 66: Asia Pacific Orthopedic Trauma Devices Industry Volume Share (%), by End User 2024 & 2032
- Figure 67: Asia Pacific Orthopedic Trauma Devices Industry Revenue (Million), by Country 2024 & 2032
- Figure 68: Asia Pacific Orthopedic Trauma Devices Industry Volume (K Unit), by Country 2024 & 2032
- Figure 69: Asia Pacific Orthopedic Trauma Devices Industry Revenue Share (%), by Country 2024 & 2032
- Figure 70: Asia Pacific Orthopedic Trauma Devices Industry Volume Share (%), by Country 2024 & 2032
- Figure 71: Middle East and Africa Orthopedic Trauma Devices Industry Revenue (Million), by Type 2024 & 2032
- Figure 72: Middle East and Africa Orthopedic Trauma Devices Industry Volume (K Unit), by Type 2024 & 2032
- Figure 73: Middle East and Africa Orthopedic Trauma Devices Industry Revenue Share (%), by Type 2024 & 2032
- Figure 74: Middle East and Africa Orthopedic Trauma Devices Industry Volume Share (%), by Type 2024 & 2032
- Figure 75: Middle East and Africa Orthopedic Trauma Devices Industry Revenue (Million), by Surgical Site 2024 & 2032
- Figure 76: Middle East and Africa Orthopedic Trauma Devices Industry Volume (K Unit), by Surgical Site 2024 & 2032
- Figure 77: Middle East and Africa Orthopedic Trauma Devices Industry Revenue Share (%), by Surgical Site 2024 & 2032
- Figure 78: Middle East and Africa Orthopedic Trauma Devices Industry Volume Share (%), by Surgical Site 2024 & 2032
- Figure 79: Middle East and Africa Orthopedic Trauma Devices Industry Revenue (Million), by End User 2024 & 2032
- Figure 80: Middle East and Africa Orthopedic Trauma Devices Industry Volume (K Unit), by End User 2024 & 2032
- Figure 81: Middle East and Africa Orthopedic Trauma Devices Industry Revenue Share (%), by End User 2024 & 2032
- Figure 82: Middle East and Africa Orthopedic Trauma Devices Industry Volume Share (%), by End User 2024 & 2032
- Figure 83: Middle East and Africa Orthopedic Trauma Devices Industry Revenue (Million), by Country 2024 & 2032
- Figure 84: Middle East and Africa Orthopedic Trauma Devices Industry Volume (K Unit), by Country 2024 & 2032
- Figure 85: Middle East and Africa Orthopedic Trauma Devices Industry Revenue Share (%), by Country 2024 & 2032
- Figure 86: Middle East and Africa Orthopedic Trauma Devices Industry Volume Share (%), by Country 2024 & 2032
- Figure 87: South America Orthopedic Trauma Devices Industry Revenue (Million), by Type 2024 & 2032
- Figure 88: South America Orthopedic Trauma Devices Industry Volume (K Unit), by Type 2024 & 2032
- Figure 89: South America Orthopedic Trauma Devices Industry Revenue Share (%), by Type 2024 & 2032
- Figure 90: South America Orthopedic Trauma Devices Industry Volume Share (%), by Type 2024 & 2032
- Figure 91: South America Orthopedic Trauma Devices Industry Revenue (Million), by Surgical Site 2024 & 2032
- Figure 92: South America Orthopedic Trauma Devices Industry Volume (K Unit), by Surgical Site 2024 & 2032
- Figure 93: South America Orthopedic Trauma Devices Industry Revenue Share (%), by Surgical Site 2024 & 2032
- Figure 94: South America Orthopedic Trauma Devices Industry Volume Share (%), by Surgical Site 2024 & 2032
- Figure 95: South America Orthopedic Trauma Devices Industry Revenue (Million), by End User 2024 & 2032
- Figure 96: South America Orthopedic Trauma Devices Industry Volume (K Unit), by End User 2024 & 2032
- Figure 97: South America Orthopedic Trauma Devices Industry Revenue Share (%), by End User 2024 & 2032
- Figure 98: South America Orthopedic Trauma Devices Industry Volume Share (%), by End User 2024 & 2032
- Figure 99: South America Orthopedic Trauma Devices Industry Revenue (Million), by Country 2024 & 2032
- Figure 100: South America Orthopedic Trauma Devices Industry Volume (K Unit), by Country 2024 & 2032
- Figure 101: South America Orthopedic Trauma Devices Industry Revenue Share (%), by Country 2024 & 2032
- Figure 102: South America Orthopedic Trauma Devices Industry Volume Share (%), by Country 2024 & 2032
List of Tables
- Table 1: Global Orthopedic Trauma Devices Industry Revenue Million Forecast, by Region 2019 & 2032
- Table 2: Global Orthopedic Trauma Devices Industry Volume K Unit Forecast, by Region 2019 & 2032
- Table 3: Global Orthopedic Trauma Devices Industry Revenue Million Forecast, by Type 2019 & 2032
- Table 4: Global Orthopedic Trauma Devices Industry Volume K Unit Forecast, by Type 2019 & 2032
- Table 5: Global Orthopedic Trauma Devices Industry Revenue Million Forecast, by Surgical Site 2019 & 2032
- Table 6: Global Orthopedic Trauma Devices Industry Volume K Unit Forecast, by Surgical Site 2019 & 2032
- Table 7: Global Orthopedic Trauma Devices Industry Revenue Million Forecast, by End User 2019 & 2032
- Table 8: Global Orthopedic Trauma Devices Industry Volume K Unit Forecast, by End User 2019 & 2032
- Table 9: Global Orthopedic Trauma Devices Industry Revenue Million Forecast, by Region 2019 & 2032
- Table 10: Global Orthopedic Trauma Devices Industry Volume K Unit Forecast, by Region 2019 & 2032
- Table 11: Global Orthopedic Trauma Devices Industry Revenue Million Forecast, by Country 2019 & 2032
- Table 12: Global Orthopedic Trauma Devices Industry Volume K Unit Forecast, by Country 2019 & 2032
- Table 13: Global Orthopedic Trauma Devices Industry Revenue Million Forecast, by Country 2019 & 2032
- Table 14: Global Orthopedic Trauma Devices Industry Volume K Unit Forecast, by Country 2019 & 2032
- Table 15: Global Orthopedic Trauma Devices Industry Revenue Million Forecast, by Country 2019 & 2032
- Table 16: Global Orthopedic Trauma Devices Industry Volume K Unit Forecast, by Country 2019 & 2032
- Table 17: Global Orthopedic Trauma Devices Industry Revenue Million Forecast, by Country 2019 & 2032
- Table 18: Global Orthopedic Trauma Devices Industry Volume K Unit Forecast, by Country 2019 & 2032
- Table 19: Global Orthopedic Trauma Devices Industry Revenue Million Forecast, by Country 2019 & 2032
- Table 20: Global Orthopedic Trauma Devices Industry Volume K Unit Forecast, by Country 2019 & 2032
- Table 21: Global Orthopedic Trauma Devices Industry Revenue Million Forecast, by Type 2019 & 2032
- Table 22: Global Orthopedic Trauma Devices Industry Volume K Unit Forecast, by Type 2019 & 2032
- Table 23: Global Orthopedic Trauma Devices Industry Revenue Million Forecast, by Surgical Site 2019 & 2032
- Table 24: Global Orthopedic Trauma Devices Industry Volume K Unit Forecast, by Surgical Site 2019 & 2032
- Table 25: Global Orthopedic Trauma Devices Industry Revenue Million Forecast, by End User 2019 & 2032
- Table 26: Global Orthopedic Trauma Devices Industry Volume K Unit Forecast, by End User 2019 & 2032
- Table 27: Global Orthopedic Trauma Devices Industry Revenue Million Forecast, by Country 2019 & 2032
- Table 28: Global Orthopedic Trauma Devices Industry Volume K Unit Forecast, by Country 2019 & 2032
- Table 29: United States Orthopedic Trauma Devices Industry Revenue (Million) Forecast, by Application 2019 & 2032
- Table 30: United States Orthopedic Trauma Devices Industry Volume (K Unit) Forecast, by Application 2019 & 2032
- Table 31: Canada Orthopedic Trauma Devices Industry Revenue (Million) Forecast, by Application 2019 & 2032
- Table 32: Canada Orthopedic Trauma Devices Industry Volume (K Unit) Forecast, by Application 2019 & 2032
- Table 33: Mexico Orthopedic Trauma Devices Industry Revenue (Million) Forecast, by Application 2019 & 2032
- Table 34: Mexico Orthopedic Trauma Devices Industry Volume (K Unit) Forecast, by Application 2019 & 2032
- Table 35: Global Orthopedic Trauma Devices Industry Revenue Million Forecast, by Type 2019 & 2032
- Table 36: Global Orthopedic Trauma Devices Industry Volume K Unit Forecast, by Type 2019 & 2032
- Table 37: Global Orthopedic Trauma Devices Industry Revenue Million Forecast, by Surgical Site 2019 & 2032
- Table 38: Global Orthopedic Trauma Devices Industry Volume K Unit Forecast, by Surgical Site 2019 & 2032
- Table 39: Global Orthopedic Trauma Devices Industry Revenue Million Forecast, by End User 2019 & 2032
- Table 40: Global Orthopedic Trauma Devices Industry Volume K Unit Forecast, by End User 2019 & 2032
- Table 41: Global Orthopedic Trauma Devices Industry Revenue Million Forecast, by Country 2019 & 2032
- Table 42: Global Orthopedic Trauma Devices Industry Volume K Unit Forecast, by Country 2019 & 2032
- Table 43: Germany Orthopedic Trauma Devices Industry Revenue (Million) Forecast, by Application 2019 & 2032
- Table 44: Germany Orthopedic Trauma Devices Industry Volume (K Unit) Forecast, by Application 2019 & 2032
- Table 45: United Kingdom Orthopedic Trauma Devices Industry Revenue (Million) Forecast, by Application 2019 & 2032
- Table 46: United Kingdom Orthopedic Trauma Devices Industry Volume (K Unit) Forecast, by Application 2019 & 2032
- Table 47: France Orthopedic Trauma Devices Industry Revenue (Million) Forecast, by Application 2019 & 2032
- Table 48: France Orthopedic Trauma Devices Industry Volume (K Unit) Forecast, by Application 2019 & 2032
- Table 49: Italy Orthopedic Trauma Devices Industry Revenue (Million) Forecast, by Application 2019 & 2032
- Table 50: Italy Orthopedic Trauma Devices Industry Volume (K Unit) Forecast, by Application 2019 & 2032
- Table 51: Spain Orthopedic Trauma Devices Industry Revenue (Million) Forecast, by Application 2019 & 2032
- Table 52: Spain Orthopedic Trauma Devices Industry Volume (K Unit) Forecast, by Application 2019 & 2032
- Table 53: Rest of Europe Orthopedic Trauma Devices Industry Revenue (Million) Forecast, by Application 2019 & 2032
- Table 54: Rest of Europe Orthopedic Trauma Devices Industry Volume (K Unit) Forecast, by Application 2019 & 2032
- Table 55: Global Orthopedic Trauma Devices Industry Revenue Million Forecast, by Type 2019 & 2032
- Table 56: Global Orthopedic Trauma Devices Industry Volume K Unit Forecast, by Type 2019 & 2032
- Table 57: Global Orthopedic Trauma Devices Industry Revenue Million Forecast, by Surgical Site 2019 & 2032
- Table 58: Global Orthopedic Trauma Devices Industry Volume K Unit Forecast, by Surgical Site 2019 & 2032
- Table 59: Global Orthopedic Trauma Devices Industry Revenue Million Forecast, by End User 2019 & 2032
- Table 60: Global Orthopedic Trauma Devices Industry Volume K Unit Forecast, by End User 2019 & 2032
- Table 61: Global Orthopedic Trauma Devices Industry Revenue Million Forecast, by Country 2019 & 2032
- Table 62: Global Orthopedic Trauma Devices Industry Volume K Unit Forecast, by Country 2019 & 2032
- Table 63: China Orthopedic Trauma Devices Industry Revenue (Million) Forecast, by Application 2019 & 2032
- Table 64: China Orthopedic Trauma Devices Industry Volume (K Unit) Forecast, by Application 2019 & 2032
- Table 65: Japan Orthopedic Trauma Devices Industry Revenue (Million) Forecast, by Application 2019 & 2032
- Table 66: Japan Orthopedic Trauma Devices Industry Volume (K Unit) Forecast, by Application 2019 & 2032
- Table 67: India Orthopedic Trauma Devices Industry Revenue (Million) Forecast, by Application 2019 & 2032
- Table 68: India Orthopedic Trauma Devices Industry Volume (K Unit) Forecast, by Application 2019 & 2032
- Table 69: Australia Orthopedic Trauma Devices Industry Revenue (Million) Forecast, by Application 2019 & 2032
- Table 70: Australia Orthopedic Trauma Devices Industry Volume (K Unit) Forecast, by Application 2019 & 2032
- Table 71: South Korea Orthopedic Trauma Devices Industry Revenue (Million) Forecast, by Application 2019 & 2032
- Table 72: South Korea Orthopedic Trauma Devices Industry Volume (K Unit) Forecast, by Application 2019 & 2032
- Table 73: Rest of Asia Pacific Orthopedic Trauma Devices Industry Revenue (Million) Forecast, by Application 2019 & 2032
- Table 74: Rest of Asia Pacific Orthopedic Trauma Devices Industry Volume (K Unit) Forecast, by Application 2019 & 2032
- Table 75: Global Orthopedic Trauma Devices Industry Revenue Million Forecast, by Type 2019 & 2032
- Table 76: Global Orthopedic Trauma Devices Industry Volume K Unit Forecast, by Type 2019 & 2032
- Table 77: Global Orthopedic Trauma Devices Industry Revenue Million Forecast, by Surgical Site 2019 & 2032
- Table 78: Global Orthopedic Trauma Devices Industry Volume K Unit Forecast, by Surgical Site 2019 & 2032
- Table 79: Global Orthopedic Trauma Devices Industry Revenue Million Forecast, by End User 2019 & 2032
- Table 80: Global Orthopedic Trauma Devices Industry Volume K Unit Forecast, by End User 2019 & 2032
- Table 81: Global Orthopedic Trauma Devices Industry Revenue Million Forecast, by Country 2019 & 2032
- Table 82: Global Orthopedic Trauma Devices Industry Volume K Unit Forecast, by Country 2019 & 2032
- Table 83: GCC Orthopedic Trauma Devices Industry Revenue (Million) Forecast, by Application 2019 & 2032
- Table 84: GCC Orthopedic Trauma Devices Industry Volume (K Unit) Forecast, by Application 2019 & 2032
- Table 85: South Africa Orthopedic Trauma Devices Industry Revenue (Million) Forecast, by Application 2019 & 2032
- Table 86: South Africa Orthopedic Trauma Devices Industry Volume (K Unit) Forecast, by Application 2019 & 2032
- Table 87: Rest of Middle East and Africa Orthopedic Trauma Devices Industry Revenue (Million) Forecast, by Application 2019 & 2032
- Table 88: Rest of Middle East and Africa Orthopedic Trauma Devices Industry Volume (K Unit) Forecast, by Application 2019 & 2032
- Table 89: Global Orthopedic Trauma Devices Industry Revenue Million Forecast, by Type 2019 & 2032
- Table 90: Global Orthopedic Trauma Devices Industry Volume K Unit Forecast, by Type 2019 & 2032
- Table 91: Global Orthopedic Trauma Devices Industry Revenue Million Forecast, by Surgical Site 2019 & 2032
- Table 92: Global Orthopedic Trauma Devices Industry Volume K Unit Forecast, by Surgical Site 2019 & 2032
- Table 93: Global Orthopedic Trauma Devices Industry Revenue Million Forecast, by End User 2019 & 2032
- Table 94: Global Orthopedic Trauma Devices Industry Volume K Unit Forecast, by End User 2019 & 2032
- Table 95: Global Orthopedic Trauma Devices Industry Revenue Million Forecast, by Country 2019 & 2032
- Table 96: Global Orthopedic Trauma Devices Industry Volume K Unit Forecast, by Country 2019 & 2032
- Table 97: Brazil Orthopedic Trauma Devices Industry Revenue (Million) Forecast, by Application 2019 & 2032
- Table 98: Brazil Orthopedic Trauma Devices Industry Volume (K Unit) Forecast, by Application 2019 & 2032
- Table 99: Argentina Orthopedic Trauma Devices Industry Revenue (Million) Forecast, by Application 2019 & 2032
- Table 100: Argentina Orthopedic Trauma Devices Industry Volume (K Unit) Forecast, by Application 2019 & 2032
- Table 101: Rest of South America Orthopedic Trauma Devices Industry Revenue (Million) Forecast, by Application 2019 & 2032
- Table 102: Rest of South America Orthopedic Trauma Devices Industry Volume (K Unit) Forecast, by Application 2019 & 2032
Frequently Asked Questions
1. What is the projected Compound Annual Growth Rate (CAGR) of the Orthopedic Trauma Devices Industry?
The projected CAGR is approximately 6.50%.
2. Which companies are prominent players in the Orthopedic Trauma Devices Industry?
Key companies in the market include Smith & Nephew PLC, Arthrex Inc, Braun Melsungen AG, Invibio Ltd, Cardinal Health Inc, Medtronic PLC, Orthofix Medical Inc, Conmed Corporation, Johnson & Johnson, Stryker Corporation, Zimmer Biomet.
3. What are the main segments of the Orthopedic Trauma Devices Industry?
The market segments include Type, Surgical Site, End User.
4. Can you provide details about the market size?
The market size is estimated to be USD XX Million as of 2022.
5. What are some drivers contributing to market growth?
Growing Burden of Bone Degenerative Diseases; Increasing Number of Road Accidents; Technological Advancements in Medical Devices.
6. What are the notable trends driving market growth?
Circular Fixators Segment is Expected to Hold a Major Share in the Trauma Fixation Devices Market.
7. Are there any restraints impacting market growth?
Lack of Trained Professionals; Stringent Regulatory Issues.
8. Can you provide examples of recent developments in the market?
In October 2020, DePuy Synthes (Johnson & Johnson) introduced the 'FIBULINK Syndesmosis Repair System' in the United States. The device is designed to address traumatic injuries to the syndesmosis.
9. What pricing options are available for accessing the report?
Pricing options include single-user, multi-user, and enterprise licenses priced at USD 4750, USD 5250, and USD 8750 respectively.
10. Is the market size provided in terms of value or volume?
The market size is provided in terms of value, measured in Million and volume, measured in K Unit.
11. Are there any specific market keywords associated with the report?
Yes, the market keyword associated with the report is "Orthopedic Trauma Devices Industry," which aids in identifying and referencing the specific market segment covered.
12. How do I determine which pricing option suits my needs best?
The pricing options vary based on user requirements and access needs. Individual users may opt for single-user licenses, while businesses requiring broader access may choose multi-user or enterprise licenses for cost-effective access to the report.
13. Are there any additional resources or data provided in the Orthopedic Trauma Devices Industry report?
While the report offers comprehensive insights, it's advisable to review the specific contents or supplementary materials provided to ascertain if additional resources or data are available.
14. How can I stay updated on further developments or reports in the Orthopedic Trauma Devices Industry?
To stay informed about further developments, trends, and reports in the Orthopedic Trauma Devices Industry, consider subscribing to industry newsletters, following relevant companies and organizations, or regularly checking reputable industry news sources and publications.
Methodology
Step 1 - Identification of Relevant Samples Size from Population Database


Step 2 - Approaches for Defining Global Market Size (Value, Volume* & Price*)

Note*: In applicable scenarios
Step 3 - Data Sources
Primary Research
- Web Analytics
- Survey Reports
- Research Institute
- Latest Research Reports
- Opinion Leaders
Secondary Research
- Annual Reports
- White Paper
- Latest Press Release
- Industry Association
- Paid Database
- Investor Presentations

Step 4 - Data Triangulation
Involves using different sources of information in order to increase the validity of a study
These sources are likely to be stakeholders in a program - participants, other researchers, program staff, other community members, and so on.
Then we put all data in single framework & apply various statistical tools to find out the dynamic on the market.
During the analysis stage, feedback from the stakeholder groups would be compared to determine areas of agreement as well as areas of divergence
