

Key Insights
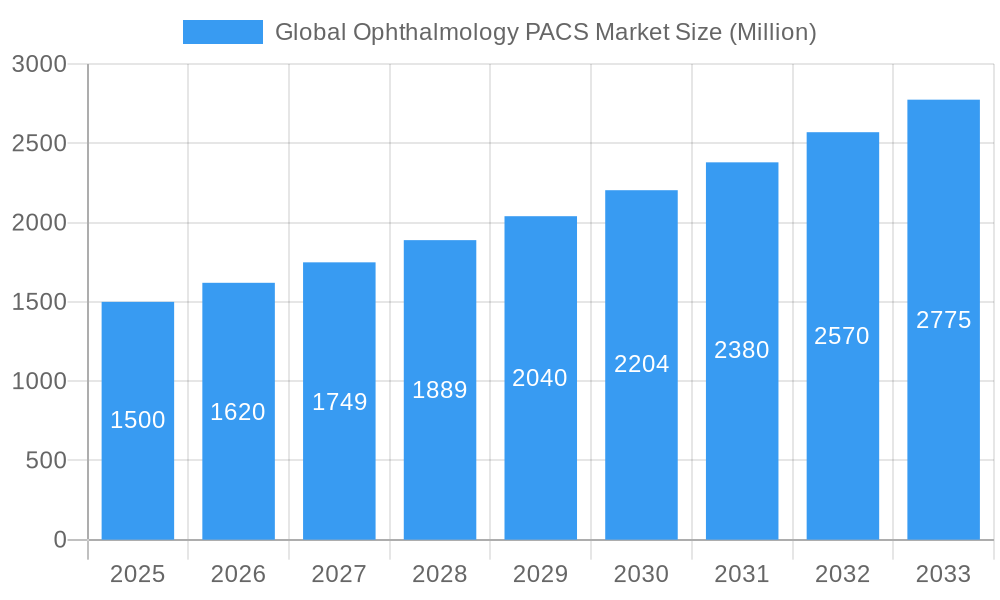
The Global Ophthalmology PACS Market is set for substantial growth, propelled by a rising incidence of ocular diseases and an escalating demand for sophisticated diagnostic imaging. Projecting a market size of $184.4 million by 2025, the market is anticipated to expand at a Compound Annual Growth Rate (CAGR) of 8.4%. This expansion is primarily attributed to the widespread integration of digital imaging technologies in ophthalmology, facilitating precise diagnostics, streamlined workflows, and enhanced patient outcomes. The increasing prevalence of conditions such as diabetic retinopathy, glaucoma, and age-related macular degeneration, particularly within aging global demographics, underscores the critical need for advanced Picture Archiving and Communication Systems (PACS) for effective management. Moreover, advancements in imaging modalities, including Optical Coherence Tomography (OCT), fundus photography, and ultrasound, are driving the demand for integrated PACS solutions capable of efficiently storing, retrieving, and analyzing diverse ophthalmic data.
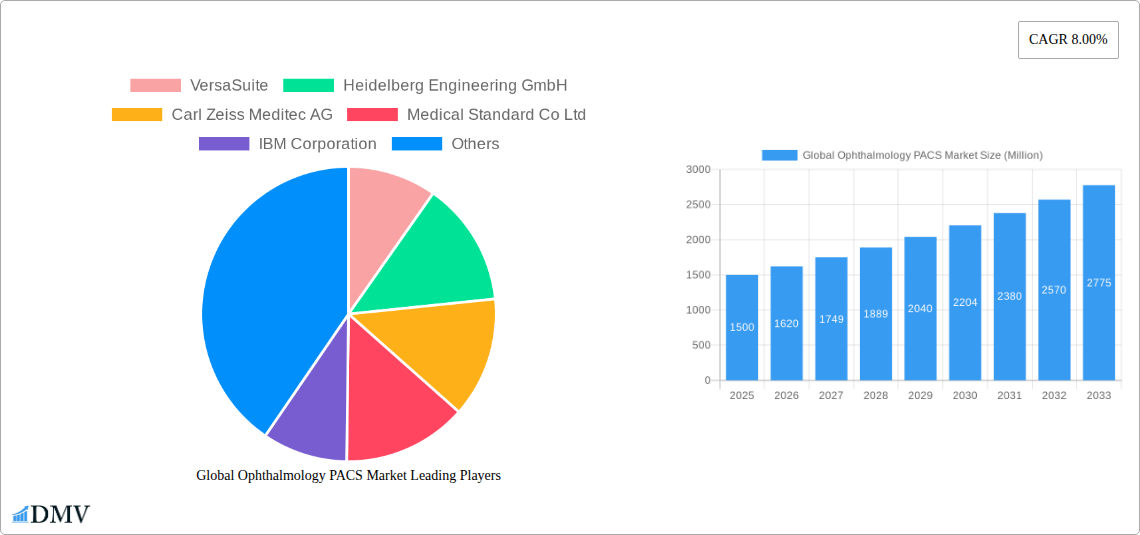
Global Ophthalmology PACS Market Market Size (In Million)
The market is characterized by continuous technological innovation and evolving healthcare infrastructure. Integrated PACS, offering comprehensive functionalities beyond basic storage, are gaining prominence for their ability to significantly improve ophthalmologists' workflow efficiency. Concurrently, the adoption of Cloud-Based PACS solutions is accelerating, providing scalable, cost-effective, and remotely accessible platforms, which are particularly beneficial for smaller healthcare facilities. While these technological advancements and the growing disease burden are key growth drivers, potential challenges include the significant initial investment required for advanced PACS implementation, concerns surrounding data security and privacy in cloud-based systems, and the necessity for specialized IT expertise. Nevertheless, the ongoing digital transformation in healthcare and the indispensable role of ophthalmic imaging in contemporary eye care ensure a trajectory of sustained and significant growth for the Ophthalmology PACS Market.
Global Ophthalmology PACS Market Company Market Share
Global Ophthalmology PACS Market: A Comprehensive Insight Report 2024-2033
Unlock the future of eye care with our in-depth Global Ophthalmology PACS Market report, meticulously crafted to provide strategic insights for stakeholders. This report delves into market dynamics, technological advancements, and growth opportunities within the ophthalmology Picture Archiving and Communication Systems (PACS) sector. Covering the period from 2019 to 2033, with a base year of 2025, our analysis offers a clear roadmap for navigating this rapidly evolving landscape. Discover how integrated PACS and cloud-based models are reshaping patient care and operational efficiency in ophthalmology.
Global Ophthalmology PACS Market Market Composition & Trends
The global ophthalmology PACS market exhibits a dynamic composition characterized by increasing market concentration among key players and a robust pace of innovation. Major companies like Carl Zeiss Meditec AG, Heidelberg Engineering GmbH, and IBM Corporation are at the forefront, driving advancements in ophthalmology PACS solutions. Market trends are heavily influenced by the escalating adoption of digital imaging technologies and the growing demand for streamlined diagnostic workflows. Regulatory landscapes, while presenting a degree of complexity, are also encouraging the standardization and interoperability of PACS, leading to improved patient data management. The prevalence of ocular diseases and an aging global population act as significant substitute product deterrents, reinforcing the necessity of advanced PACS. End-user profiles are diversifying, with a notable increase in the integration of PACS within specialized ambulatory surgical centers and smaller hospitals & clinics, alongside larger healthcare institutions. Mergers and acquisitions (M&A) activities are expected to continue, consolidating market share and fostering synergistic growth, with estimated M&A deal values in the tens of millions for strategic acquisitions. The market share distribution is steadily shifting towards solutions offering enhanced analytical capabilities and AI integration.
Global Ophthalmology PACS Market Industry Evolution
The global ophthalmology PACS market has undergone a significant evolution, transforming from rudimentary digital archiving to sophisticated, AI-integrated platforms designed to enhance diagnostic accuracy and operational efficiency. Over the historical period (2019-2024), the market witnessed a steady climb in adoption, driven by the increasing digitization of medical imaging and a growing awareness of the benefits of PACS in managing large volumes of ophthalmic data. The base year (2025) represents a pivotal point, with widespread acceptance of integrated PACS solutions that offer seamless integration with other ophthalmic diagnostic devices and electronic health records (EHRs). The forecast period (2025-2033) anticipates accelerated growth, fueled by technological advancements such as advanced image processing algorithms, predictive analytics for disease progression, and enhanced cloud-based infrastructure that enables remote access and collaboration.
Technological advancements have been a primary catalyst. Early iterations focused on simple image storage and retrieval. However, the market has progressed to incorporate advanced features like automated image analysis, lesion detection, and quantitative measurements, which significantly reduce the burden on ophthalmologists and improve diagnostic consistency. The shift towards cloud-based PACS models has been transformative, offering scalability, cost-effectiveness, and improved accessibility for healthcare providers of all sizes. This transition has democratized access to advanced PACS technology, particularly for smaller hospitals & clinics and ambulatory surgical centers that may not have the capital for extensive on-premise infrastructure.
Shifting consumer demands, characterized by a greater emphasis on patient outcomes and personalized medicine, are also shaping the industry. Patients and providers alike are seeking more efficient and accurate diagnostic tools. This demand is pushing the market towards PACS solutions that can not only store images but also provide actionable insights, aiding in early disease detection and personalized treatment planning. The increasing prevalence of chronic eye conditions like diabetic retinopathy, glaucoma, and age-related macular degeneration (AMD) further amplifies the need for robust and efficient PACS systems to manage and analyze the growing volume of patient data. Projections indicate a compound annual growth rate (CAGR) of approximately 7-9% during the forecast period, with key market drivers including the rising incidence of eye diseases, technological innovation, and supportive government initiatives promoting digital health. Adoption metrics show a significant increase in cloud-based solutions, with estimates suggesting over 60% of new PACS implementations opting for cloud deployments by 2028.
Leading Regions, Countries, or Segments in Global Ophthalmology PACS Market
The global ophthalmology PACS market is currently experiencing significant leadership and growth across various regions and segments. In terms of geographical dominance, North America stands out as a leading region. This leadership is attributed to several key factors:
- High Healthcare Expenditure: North America, particularly the United States, boasts substantial healthcare spending, allowing for greater investment in advanced medical technologies like ophthalmology PACS. This enables widespread adoption by large hospital networks and specialized eye care centers.
- Technological Adoption Rate: The region demonstrates a high propensity for adopting cutting-edge technologies, including digital imaging solutions and cloud-based services. This proactive approach to technology integration facilitates the rapid deployment and utilization of advanced ophthalmology PACS.
- Robust Regulatory Framework: While stringent, the regulatory environment in North America often drives innovation by setting high standards for data security, interoperability, and system performance, ultimately benefiting the quality of PACS solutions available.
- Prevalence of Ocular Diseases: The significant burden of age-related eye diseases, diabetes-related eye complications, and other ophthalmic conditions in North America creates a strong demand for efficient diagnostic and management tools, directly boosting the ophthalmology PACS market.
Within the segmentation by Type, Integrated PACS are demonstrating a pronounced lead. This dominance stems from their inherent advantage in offering a cohesive workflow by seamlessly connecting imaging devices, diagnostic equipment, and EHR systems. This holistic approach significantly enhances efficiency and reduces data silos, a critical need in the complex field of ophthalmology.
- Key Drivers for Integrated PACS:
- Improved diagnostic workflow efficiency.
- Enhanced data accuracy and reduced manual entry errors.
- Better integration with existing hospital IT infrastructure.
- Support for advanced image analysis and AI-driven insights.
The Delivery Model segment is witnessing a rapid ascendance of the Cloud-Based Model. While the On-Premise Model still holds a significant share, cloud solutions are rapidly gaining traction due to their scalability, cost-effectiveness, and accessibility. This trend is particularly pronounced in emerging economies and among smaller healthcare providers who benefit from reduced upfront investment and flexible subscription-based pricing.
- Key Drivers for Cloud-Based Model:
- Lower initial capital expenditure.
- Scalability to meet growing data needs.
- Remote access and collaboration capabilities.
- Reduced IT maintenance burden.
Considering the End User segment, Hospitals & Clinics represent the largest market share. This is primarily due to the higher volume of patients, the comprehensive range of ophthalmic services offered, and the substantial infrastructure typically present in these institutions. However, Ambulatory Surgical Centers are showing remarkable growth, driven by the increasing trend of outpatient eye surgeries and the need for specialized, efficient PACS to manage surgical imaging and patient records within a focused environment.
- Key Drivers for Hospitals & Clinics:
- Higher patient volume and complex case management.
- Established IT infrastructure.
- Need for comprehensive data management across departments.
The competitive landscape is characterized by intense innovation and strategic partnerships, with companies like Carl Zeiss Meditec AG, Heidelberg Engineering GmbH, and VersaSuite investing heavily in R&D to capture market share. Investment trends are leaning towards AI integration and cloud-native solutions, further solidifying the dominance of North America and the growth of integrated and cloud-based PACS.
Global Ophthalmology PACS Market Product Innovations
Product innovations in the global ophthalmology PACS market are rapidly enhancing diagnostic capabilities and operational efficiencies. Key advancements include the integration of Artificial Intelligence (AI) for automated image analysis, enabling faster and more accurate detection of subtle pathologies like diabetic retinopathy, glaucoma, and macular degeneration. Companies are developing Integrated PACS solutions that seamlessly connect with a wide array of diagnostic equipment, such as OCT (Optical Coherence Tomography) scanners, fundus cameras, and visual field analyzers, creating a unified workflow. Performance metrics are being optimized for faster image loading, efficient data compression, and secure remote access. For instance, ZEISS Medical Technology's QUATERA 700, a revolutionary phaco technology approved by the FDA, exemplifies the trend towards digitally integrated surgical workflows, enhancing surgeon efficiency from clinic to operating room. These innovations are designed to improve patient outcomes by enabling earlier diagnosis, more precise treatment planning, and streamlined follow-up care.
Propelling Factors for Global Ophthalmology PACS Market Growth
Several critical factors are propelling the growth of the global ophthalmology PACS market. The escalating prevalence of age-related eye diseases, such as glaucoma, cataracts, and age-related macular degeneration, due to an aging global population, creates a sustained demand for advanced diagnostic and management tools. Technological advancements, particularly in AI and machine learning, are enabling more accurate and faster analysis of ophthalmic images, leading to earlier disease detection and improved patient outcomes. The increasing adoption of digital imaging technologies across hospitals & clinics and ambulatory surgical centers is directly driving the need for robust PACS solutions. Furthermore, supportive government initiatives and regulatory frameworks promoting digital health and EHR adoption are creating a conducive environment for market expansion. The shift towards cloud-based PACS models is also a significant growth driver, offering scalability, cost-effectiveness, and enhanced accessibility for healthcare providers worldwide.
Obstacles in the Global Ophthalmology PACS Market Market
Despite robust growth, the global ophthalmology PACS market faces several obstacles. High upfront costs associated with implementing advanced PACS, particularly for smaller healthcare providers, can be a significant barrier. Data security and privacy concerns, especially with the increasing adoption of cloud-based PACS, require stringent regulatory compliance and robust cybersecurity measures, which can be complex and expensive to implement. Interoperability issues between different PACS vendors and existing hospital IT systems can hinder seamless data integration and workflow efficiency. Furthermore, a shortage of skilled IT professionals capable of managing and maintaining sophisticated PACS infrastructure can pose challenges for healthcare organizations. Resistance to change among some healthcare professionals and the need for extensive training can also slow down the adoption of new technologies, impacting overall market penetration.
Future Opportunities in Global Ophthalmology PACS Market
The global ophthalmology PACS market is ripe with future opportunities. The increasing integration of Artificial Intelligence (AI) and machine learning algorithms within PACS offers immense potential for automated diagnostics, predictive analytics for disease progression, and personalized treatment recommendations. The expansion of telemedicine and remote patient monitoring services creates a demand for cloud-based PACS solutions that enable secure, remote access to patient data and images, facilitating consultations and follow-ups. Growing demand in emerging economies, where healthcare infrastructure is rapidly developing, presents a significant untapped market. The continuous development of higher resolution imaging modalities necessitates advanced PACS capable of handling larger data volumes and sophisticated visualization tools. Furthermore, the increasing focus on value-based healthcare and population health management will drive the demand for PACS that can provide comprehensive data analytics for research and public health initiatives.
Major Players in the Global Ophthalmology PACS Market Ecosystem
- VersaSuite
- Heidelberg Engineering GmbH
- Carl Zeiss Meditec AG
- Medical Standard Co Ltd
- IBM Corporation
- Agfa-Gevaert N V
- Visbion Limited
- Sonomed Escalon
Key Developments in Global Ophthalmology PACS Market Industry
- May 2022: OMNY Health partnered with community-based ophthalmology practices to launch a real-world data ecosystem focused on driving collaborative research partnerships to advance treatments and improve outcomes for patients with ophthalmic disorders.
- April 2022: ZEISS Medical Technology's product, QUATERA 700, a revolution in phaco technology, received FDA approval. The ZEISS QUATERA 700 is designed to increase a surgeon's workflow efficiency from the clinic to the operating room (OR), enabling a digitally integrated surgical workflow.
Strategic Global Ophthalmology PACS Market Market Forecast
The global ophthalmology PACS market is poised for substantial growth driven by an confluence of technological innovation and increasing healthcare demands. The forecast period (2025–2033) anticipates an accelerated trajectory, fueled by the widespread adoption of AI-powered diagnostic tools and the seamless integration of these systems into Integrated PACS and cloud-based models. The rising incidence of chronic eye diseases, coupled with an aging global population, will continue to be a primary market catalyst, necessitating more efficient and accurate diagnostic solutions. Key growth catalysts include the ongoing advancements in medical imaging technology, the expanding reach of telemedicine, and supportive government initiatives promoting digital health infrastructure. The strategic focus on enhancing patient outcomes and streamlining clinical workflows will further propel investment in sophisticated ophthalmology PACS, solidifying its crucial role in modern eye care delivery.
Global Ophthalmology PACS Market Segmentation
-
1. Type
- 1.1. Integrated PACS
- 1.2. Standalone PACS
-
2. Delivery Model
- 2.1. Cloud-Based Model
- 2.2. On-Premise Model
-
3. End User
- 3.1. Hospitals & Clinics
- 3.2. Ambulatory Surgical Centers
Global Ophthalmology PACS Market Segmentation By Geography
-
1. North America
- 1.1. United States
- 1.2. Canada
- 1.3. Mexico
-
2. Europe
- 2.1. Germany
- 2.2. United Kingdom
- 2.3. France
- 2.4. Italy
- 2.5. Spain
- 2.6. Rest of Europe
-
3. Asia Pacific
- 3.1. China
- 3.2. Japan
- 3.3. India
- 3.4. Australia
- 3.5. South Korea
- 3.6. Rest of Asia Pacific
-
4. Middle East and Africa
- 4.1. GCC
- 4.2. South Africa
- 4.3. Rest of Middle East and Africa
-
5. South America
- 5.1. Brazil
- 5.2. Argentina
- 5.3. Rest of South America
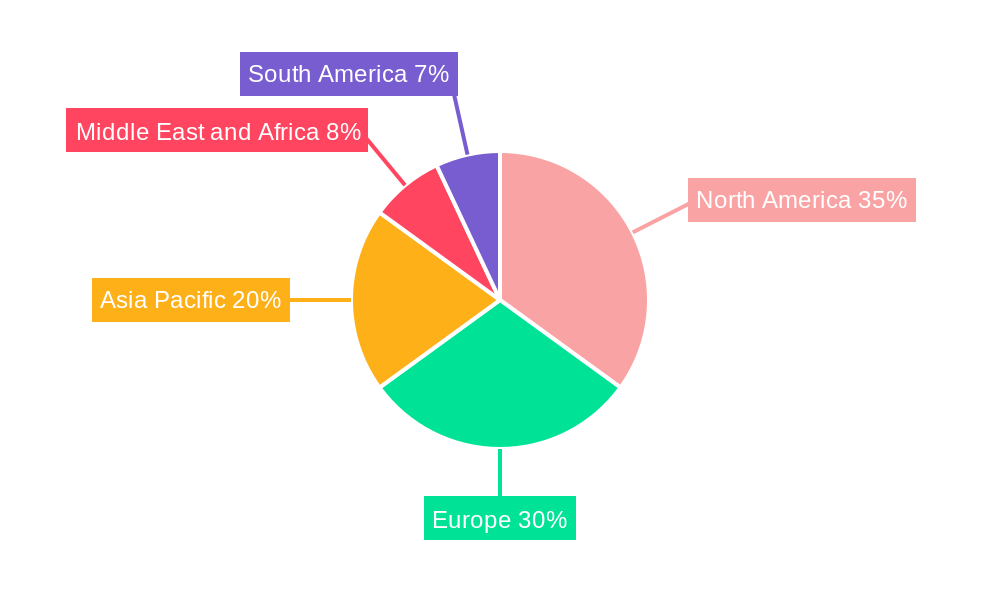
Global Ophthalmology PACS Market Regional Market Share
Geographic Coverage of Global Ophthalmology PACS Market
Global Ophthalmology PACS Market REPORT HIGHLIGHTS
| Aspects | Details |
|---|---|
| Study Period | 2020-2034 |
| Base Year | 2025 |
| Estimated Year | 2026 |
| Forecast Period | 2026-2034 |
| Historical Period | 2020-2025 |
| Growth Rate | CAGR of 8.4% from 2020-2034 |
| Segmentation |
|
Table of Contents
- 1. Introduction
- 1.1. Research Scope
- 1.2. Market Segmentation
- 1.3. Research Objective
- 1.4. Definitions and Assumptions
- 2. Executive Summary
- 2.1. Market Snapshot
- 3. Market Dynamics
- 3.1. Market Drivers
- 3.2. Market Restrains
- 3.3. Market Trends
- 3.4. Market Opportunities
- 4. Market Factor Analysis
- 4.1. Porters Five Forces
- 4.1.1. Bargaining Power of Suppliers
- 4.1.2. Bargaining Power of Buyers
- 4.1.3. Threat of New Entrants
- 4.1.4. Threat of Substitutes
- 4.1.5. Competitive Rivalry
- 4.2. PESTEL analysis
- 4.3. BCG Analysis
- 4.3.1. Stars (High Growth, High Market Share)
- 4.3.2. Cash Cows (Low Growth, High Market Share)
- 4.3.3. Question Mark (High Growth, Low Market Share)
- 4.3.4. Dogs (Low Growth, Low Market Share)
- 4.4. Ansoff Matrix Analysis
- 4.5. Supply Chain Analysis
- 4.6. Regulatory Landscape
- 4.7. Current Market Potential and Opportunity Assessment (TAM–SAM–SOM Framework)
- 4.8. DMV Analyst Note
- 4.1. Porters Five Forces
- 5. Market Analysis, Insights and Forecast 2021-2033
- 5.1. Market Analysis, Insights and Forecast - by Type
- 5.1.1. Integrated PACS
- 5.1.2. Standalone PACS
- 5.2. Market Analysis, Insights and Forecast - by Delivery Model
- 5.2.1. Cloud-Based Model
- 5.2.2. On-Premise Model
- 5.3. Market Analysis, Insights and Forecast - by End User
- 5.3.1. Hospitals & Clinics
- 5.3.2. Ambulatory Surgical Centers
- 5.4. Market Analysis, Insights and Forecast - by Region
- 5.4.1. North America
- 5.4.2. Europe
- 5.4.3. Asia Pacific
- 5.4.4. Middle East and Africa
- 5.4.5. South America
- 5.1. Market Analysis, Insights and Forecast - by Type
- 6. Global Ophthalmology PACS Market Analysis, Insights and Forecast, 2021-2033
- 6.1. Market Analysis, Insights and Forecast - by Type
- 6.1.1. Integrated PACS
- 6.1.2. Standalone PACS
- 6.2. Market Analysis, Insights and Forecast - by Delivery Model
- 6.2.1. Cloud-Based Model
- 6.2.2. On-Premise Model
- 6.3. Market Analysis, Insights and Forecast - by End User
- 6.3.1. Hospitals & Clinics
- 6.3.2. Ambulatory Surgical Centers
- 6.1. Market Analysis, Insights and Forecast - by Type
- 7. North America Global Ophthalmology PACS Market Analysis, Insights and Forecast, 2020-2032
- 7.1. Market Analysis, Insights and Forecast - by Type
- 7.1.1. Integrated PACS
- 7.1.2. Standalone PACS
- 7.2. Market Analysis, Insights and Forecast - by Delivery Model
- 7.2.1. Cloud-Based Model
- 7.2.2. On-Premise Model
- 7.3. Market Analysis, Insights and Forecast - by End User
- 7.3.1. Hospitals & Clinics
- 7.3.2. Ambulatory Surgical Centers
- 7.1. Market Analysis, Insights and Forecast - by Type
- 8. Europe Global Ophthalmology PACS Market Analysis, Insights and Forecast, 2020-2032
- 8.1. Market Analysis, Insights and Forecast - by Type
- 8.1.1. Integrated PACS
- 8.1.2. Standalone PACS
- 8.2. Market Analysis, Insights and Forecast - by Delivery Model
- 8.2.1. Cloud-Based Model
- 8.2.2. On-Premise Model
- 8.3. Market Analysis, Insights and Forecast - by End User
- 8.3.1. Hospitals & Clinics
- 8.3.2. Ambulatory Surgical Centers
- 8.1. Market Analysis, Insights and Forecast - by Type
- 9. Asia Pacific Global Ophthalmology PACS Market Analysis, Insights and Forecast, 2020-2032
- 9.1. Market Analysis, Insights and Forecast - by Type
- 9.1.1. Integrated PACS
- 9.1.2. Standalone PACS
- 9.2. Market Analysis, Insights and Forecast - by Delivery Model
- 9.2.1. Cloud-Based Model
- 9.2.2. On-Premise Model
- 9.3. Market Analysis, Insights and Forecast - by End User
- 9.3.1. Hospitals & Clinics
- 9.3.2. Ambulatory Surgical Centers
- 9.1. Market Analysis, Insights and Forecast - by Type
- 10. Middle East and Africa Global Ophthalmology PACS Market Analysis, Insights and Forecast, 2020-2032
- 10.1. Market Analysis, Insights and Forecast - by Type
- 10.1.1. Integrated PACS
- 10.1.2. Standalone PACS
- 10.2. Market Analysis, Insights and Forecast - by Delivery Model
- 10.2.1. Cloud-Based Model
- 10.2.2. On-Premise Model
- 10.3. Market Analysis, Insights and Forecast - by End User
- 10.3.1. Hospitals & Clinics
- 10.3.2. Ambulatory Surgical Centers
- 10.1. Market Analysis, Insights and Forecast - by Type
- 11. South America Global Ophthalmology PACS Market Analysis, Insights and Forecast, 2020-2032
- 11.1. Market Analysis, Insights and Forecast - by Type
- 11.1.1. Integrated PACS
- 11.1.2. Standalone PACS
- 11.2. Market Analysis, Insights and Forecast - by Delivery Model
- 11.2.1. Cloud-Based Model
- 11.2.2. On-Premise Model
- 11.3. Market Analysis, Insights and Forecast - by End User
- 11.3.1. Hospitals & Clinics
- 11.3.2. Ambulatory Surgical Centers
- 11.1. Market Analysis, Insights and Forecast - by Type
- 12. Competitive Analysis
- 12.1. Company Profiles
- 12.1.1 VersaSuite
- 12.1.1.1. Company Overview
- 12.1.1.2. Products
- 12.1.1.3. Company Financials
- 12.1.1.4. SWOT Analysis
- 12.1.2 Heidelberg Engineering GmbH
- 12.1.2.1. Company Overview
- 12.1.2.2. Products
- 12.1.2.3. Company Financials
- 12.1.2.4. SWOT Analysis
- 12.1.3 Carl Zeiss Meditec AG
- 12.1.3.1. Company Overview
- 12.1.3.2. Products
- 12.1.3.3. Company Financials
- 12.1.3.4. SWOT Analysis
- 12.1.4 Medical Standard Co Ltd
- 12.1.4.1. Company Overview
- 12.1.4.2. Products
- 12.1.4.3. Company Financials
- 12.1.4.4. SWOT Analysis
- 12.1.5 IBM Corporation
- 12.1.5.1. Company Overview
- 12.1.5.2. Products
- 12.1.5.3. Company Financials
- 12.1.5.4. SWOT Analysis
- 12.1.6 Agfa-Gevaert N V
- 12.1.6.1. Company Overview
- 12.1.6.2. Products
- 12.1.6.3. Company Financials
- 12.1.6.4. SWOT Analysis
- 12.1.7 Visbion Limited
- 12.1.7.1. Company Overview
- 12.1.7.2. Products
- 12.1.7.3. Company Financials
- 12.1.7.4. SWOT Analysis
- 12.1.8 Sonomed Escalon
- 12.1.8.1. Company Overview
- 12.1.8.2. Products
- 12.1.8.3. Company Financials
- 12.1.8.4. SWOT Analysis
- 12.1.1 VersaSuite
- 12.2. Market Entropy
- 12.2.1 Company's Key Areas Served
- 12.2.2 Recent Developments
- 12.3. Company Market Share Analysis 2025
- 12.3.1 Top 5 Companies Market Share Analysis
- 12.3.2 Top 3 Companies Market Share Analysis
- 12.4. List of Potential Customers
- 13. Research Methodology
List of Figures
- Figure 1: Global Global Ophthalmology PACS Market Revenue Breakdown (million, %) by Region 2025 & 2033
- Figure 2: Global Global Ophthalmology PACS Market Volume Breakdown (K Unit, %) by Region 2025 & 2033
- Figure 3: North America Global Ophthalmology PACS Market Revenue (million), by Type 2025 & 2033
- Figure 4: North America Global Ophthalmology PACS Market Volume (K Unit), by Type 2025 & 2033
- Figure 5: North America Global Ophthalmology PACS Market Revenue Share (%), by Type 2025 & 2033
- Figure 6: North America Global Ophthalmology PACS Market Volume Share (%), by Type 2025 & 2033
- Figure 7: North America Global Ophthalmology PACS Market Revenue (million), by Delivery Model 2025 & 2033
- Figure 8: North America Global Ophthalmology PACS Market Volume (K Unit), by Delivery Model 2025 & 2033
- Figure 9: North America Global Ophthalmology PACS Market Revenue Share (%), by Delivery Model 2025 & 2033
- Figure 10: North America Global Ophthalmology PACS Market Volume Share (%), by Delivery Model 2025 & 2033
- Figure 11: North America Global Ophthalmology PACS Market Revenue (million), by End User 2025 & 2033
- Figure 12: North America Global Ophthalmology PACS Market Volume (K Unit), by End User 2025 & 2033
- Figure 13: North America Global Ophthalmology PACS Market Revenue Share (%), by End User 2025 & 2033
- Figure 14: North America Global Ophthalmology PACS Market Volume Share (%), by End User 2025 & 2033
- Figure 15: North America Global Ophthalmology PACS Market Revenue (million), by Country 2025 & 2033
- Figure 16: North America Global Ophthalmology PACS Market Volume (K Unit), by Country 2025 & 2033
- Figure 17: North America Global Ophthalmology PACS Market Revenue Share (%), by Country 2025 & 2033
- Figure 18: North America Global Ophthalmology PACS Market Volume Share (%), by Country 2025 & 2033
- Figure 19: Europe Global Ophthalmology PACS Market Revenue (million), by Type 2025 & 2033
- Figure 20: Europe Global Ophthalmology PACS Market Volume (K Unit), by Type 2025 & 2033
- Figure 21: Europe Global Ophthalmology PACS Market Revenue Share (%), by Type 2025 & 2033
- Figure 22: Europe Global Ophthalmology PACS Market Volume Share (%), by Type 2025 & 2033
- Figure 23: Europe Global Ophthalmology PACS Market Revenue (million), by Delivery Model 2025 & 2033
- Figure 24: Europe Global Ophthalmology PACS Market Volume (K Unit), by Delivery Model 2025 & 2033
- Figure 25: Europe Global Ophthalmology PACS Market Revenue Share (%), by Delivery Model 2025 & 2033
- Figure 26: Europe Global Ophthalmology PACS Market Volume Share (%), by Delivery Model 2025 & 2033
- Figure 27: Europe Global Ophthalmology PACS Market Revenue (million), by End User 2025 & 2033
- Figure 28: Europe Global Ophthalmology PACS Market Volume (K Unit), by End User 2025 & 2033
- Figure 29: Europe Global Ophthalmology PACS Market Revenue Share (%), by End User 2025 & 2033
- Figure 30: Europe Global Ophthalmology PACS Market Volume Share (%), by End User 2025 & 2033
- Figure 31: Europe Global Ophthalmology PACS Market Revenue (million), by Country 2025 & 2033
- Figure 32: Europe Global Ophthalmology PACS Market Volume (K Unit), by Country 2025 & 2033
- Figure 33: Europe Global Ophthalmology PACS Market Revenue Share (%), by Country 2025 & 2033
- Figure 34: Europe Global Ophthalmology PACS Market Volume Share (%), by Country 2025 & 2033
- Figure 35: Asia Pacific Global Ophthalmology PACS Market Revenue (million), by Type 2025 & 2033
- Figure 36: Asia Pacific Global Ophthalmology PACS Market Volume (K Unit), by Type 2025 & 2033
- Figure 37: Asia Pacific Global Ophthalmology PACS Market Revenue Share (%), by Type 2025 & 2033
- Figure 38: Asia Pacific Global Ophthalmology PACS Market Volume Share (%), by Type 2025 & 2033
- Figure 39: Asia Pacific Global Ophthalmology PACS Market Revenue (million), by Delivery Model 2025 & 2033
- Figure 40: Asia Pacific Global Ophthalmology PACS Market Volume (K Unit), by Delivery Model 2025 & 2033
- Figure 41: Asia Pacific Global Ophthalmology PACS Market Revenue Share (%), by Delivery Model 2025 & 2033
- Figure 42: Asia Pacific Global Ophthalmology PACS Market Volume Share (%), by Delivery Model 2025 & 2033
- Figure 43: Asia Pacific Global Ophthalmology PACS Market Revenue (million), by End User 2025 & 2033
- Figure 44: Asia Pacific Global Ophthalmology PACS Market Volume (K Unit), by End User 2025 & 2033
- Figure 45: Asia Pacific Global Ophthalmology PACS Market Revenue Share (%), by End User 2025 & 2033
- Figure 46: Asia Pacific Global Ophthalmology PACS Market Volume Share (%), by End User 2025 & 2033
- Figure 47: Asia Pacific Global Ophthalmology PACS Market Revenue (million), by Country 2025 & 2033
- Figure 48: Asia Pacific Global Ophthalmology PACS Market Volume (K Unit), by Country 2025 & 2033
- Figure 49: Asia Pacific Global Ophthalmology PACS Market Revenue Share (%), by Country 2025 & 2033
- Figure 50: Asia Pacific Global Ophthalmology PACS Market Volume Share (%), by Country 2025 & 2033
- Figure 51: Middle East and Africa Global Ophthalmology PACS Market Revenue (million), by Type 2025 & 2033
- Figure 52: Middle East and Africa Global Ophthalmology PACS Market Volume (K Unit), by Type 2025 & 2033
- Figure 53: Middle East and Africa Global Ophthalmology PACS Market Revenue Share (%), by Type 2025 & 2033
- Figure 54: Middle East and Africa Global Ophthalmology PACS Market Volume Share (%), by Type 2025 & 2033
- Figure 55: Middle East and Africa Global Ophthalmology PACS Market Revenue (million), by Delivery Model 2025 & 2033
- Figure 56: Middle East and Africa Global Ophthalmology PACS Market Volume (K Unit), by Delivery Model 2025 & 2033
- Figure 57: Middle East and Africa Global Ophthalmology PACS Market Revenue Share (%), by Delivery Model 2025 & 2033
- Figure 58: Middle East and Africa Global Ophthalmology PACS Market Volume Share (%), by Delivery Model 2025 & 2033
- Figure 59: Middle East and Africa Global Ophthalmology PACS Market Revenue (million), by End User 2025 & 2033
- Figure 60: Middle East and Africa Global Ophthalmology PACS Market Volume (K Unit), by End User 2025 & 2033
- Figure 61: Middle East and Africa Global Ophthalmology PACS Market Revenue Share (%), by End User 2025 & 2033
- Figure 62: Middle East and Africa Global Ophthalmology PACS Market Volume Share (%), by End User 2025 & 2033
- Figure 63: Middle East and Africa Global Ophthalmology PACS Market Revenue (million), by Country 2025 & 2033
- Figure 64: Middle East and Africa Global Ophthalmology PACS Market Volume (K Unit), by Country 2025 & 2033
- Figure 65: Middle East and Africa Global Ophthalmology PACS Market Revenue Share (%), by Country 2025 & 2033
- Figure 66: Middle East and Africa Global Ophthalmology PACS Market Volume Share (%), by Country 2025 & 2033
- Figure 67: South America Global Ophthalmology PACS Market Revenue (million), by Type 2025 & 2033
- Figure 68: South America Global Ophthalmology PACS Market Volume (K Unit), by Type 2025 & 2033
- Figure 69: South America Global Ophthalmology PACS Market Revenue Share (%), by Type 2025 & 2033
- Figure 70: South America Global Ophthalmology PACS Market Volume Share (%), by Type 2025 & 2033
- Figure 71: South America Global Ophthalmology PACS Market Revenue (million), by Delivery Model 2025 & 2033
- Figure 72: South America Global Ophthalmology PACS Market Volume (K Unit), by Delivery Model 2025 & 2033
- Figure 73: South America Global Ophthalmology PACS Market Revenue Share (%), by Delivery Model 2025 & 2033
- Figure 74: South America Global Ophthalmology PACS Market Volume Share (%), by Delivery Model 2025 & 2033
- Figure 75: South America Global Ophthalmology PACS Market Revenue (million), by End User 2025 & 2033
- Figure 76: South America Global Ophthalmology PACS Market Volume (K Unit), by End User 2025 & 2033
- Figure 77: South America Global Ophthalmology PACS Market Revenue Share (%), by End User 2025 & 2033
- Figure 78: South America Global Ophthalmology PACS Market Volume Share (%), by End User 2025 & 2033
- Figure 79: South America Global Ophthalmology PACS Market Revenue (million), by Country 2025 & 2033
- Figure 80: South America Global Ophthalmology PACS Market Volume (K Unit), by Country 2025 & 2033
- Figure 81: South America Global Ophthalmology PACS Market Revenue Share (%), by Country 2025 & 2033
- Figure 82: South America Global Ophthalmology PACS Market Volume Share (%), by Country 2025 & 2033
List of Tables
- Table 1: Global Ophthalmology PACS Market Revenue million Forecast, by Type 2020 & 2033
- Table 2: Global Ophthalmology PACS Market Volume K Unit Forecast, by Type 2020 & 2033
- Table 3: Global Ophthalmology PACS Market Revenue million Forecast, by Delivery Model 2020 & 2033
- Table 4: Global Ophthalmology PACS Market Volume K Unit Forecast, by Delivery Model 2020 & 2033
- Table 5: Global Ophthalmology PACS Market Revenue million Forecast, by End User 2020 & 2033
- Table 6: Global Ophthalmology PACS Market Volume K Unit Forecast, by End User 2020 & 2033
- Table 7: Global Ophthalmology PACS Market Revenue million Forecast, by Region 2020 & 2033
- Table 8: Global Ophthalmology PACS Market Volume K Unit Forecast, by Region 2020 & 2033
- Table 9: Global Ophthalmology PACS Market Revenue million Forecast, by Type 2020 & 2033
- Table 10: Global Ophthalmology PACS Market Volume K Unit Forecast, by Type 2020 & 2033
- Table 11: Global Ophthalmology PACS Market Revenue million Forecast, by Delivery Model 2020 & 2033
- Table 12: Global Ophthalmology PACS Market Volume K Unit Forecast, by Delivery Model 2020 & 2033
- Table 13: Global Ophthalmology PACS Market Revenue million Forecast, by End User 2020 & 2033
- Table 14: Global Ophthalmology PACS Market Volume K Unit Forecast, by End User 2020 & 2033
- Table 15: Global Ophthalmology PACS Market Revenue million Forecast, by Country 2020 & 2033
- Table 16: Global Ophthalmology PACS Market Volume K Unit Forecast, by Country 2020 & 2033
- Table 17: United States Global Ophthalmology PACS Market Revenue (million) Forecast, by Application 2020 & 2033
- Table 18: United States Global Ophthalmology PACS Market Volume (K Unit) Forecast, by Application 2020 & 2033
- Table 19: Canada Global Ophthalmology PACS Market Revenue (million) Forecast, by Application 2020 & 2033
- Table 20: Canada Global Ophthalmology PACS Market Volume (K Unit) Forecast, by Application 2020 & 2033
- Table 21: Mexico Global Ophthalmology PACS Market Revenue (million) Forecast, by Application 2020 & 2033
- Table 22: Mexico Global Ophthalmology PACS Market Volume (K Unit) Forecast, by Application 2020 & 2033
- Table 23: Global Ophthalmology PACS Market Revenue million Forecast, by Type 2020 & 2033
- Table 24: Global Ophthalmology PACS Market Volume K Unit Forecast, by Type 2020 & 2033
- Table 25: Global Ophthalmology PACS Market Revenue million Forecast, by Delivery Model 2020 & 2033
- Table 26: Global Ophthalmology PACS Market Volume K Unit Forecast, by Delivery Model 2020 & 2033
- Table 27: Global Ophthalmology PACS Market Revenue million Forecast, by End User 2020 & 2033
- Table 28: Global Ophthalmology PACS Market Volume K Unit Forecast, by End User 2020 & 2033
- Table 29: Global Ophthalmology PACS Market Revenue million Forecast, by Country 2020 & 2033
- Table 30: Global Ophthalmology PACS Market Volume K Unit Forecast, by Country 2020 & 2033
- Table 31: Germany Global Ophthalmology PACS Market Revenue (million) Forecast, by Application 2020 & 2033
- Table 32: Germany Global Ophthalmology PACS Market Volume (K Unit) Forecast, by Application 2020 & 2033
- Table 33: United Kingdom Global Ophthalmology PACS Market Revenue (million) Forecast, by Application 2020 & 2033
- Table 34: United Kingdom Global Ophthalmology PACS Market Volume (K Unit) Forecast, by Application 2020 & 2033
- Table 35: France Global Ophthalmology PACS Market Revenue (million) Forecast, by Application 2020 & 2033
- Table 36: France Global Ophthalmology PACS Market Volume (K Unit) Forecast, by Application 2020 & 2033
- Table 37: Italy Global Ophthalmology PACS Market Revenue (million) Forecast, by Application 2020 & 2033
- Table 38: Italy Global Ophthalmology PACS Market Volume (K Unit) Forecast, by Application 2020 & 2033
- Table 39: Spain Global Ophthalmology PACS Market Revenue (million) Forecast, by Application 2020 & 2033
- Table 40: Spain Global Ophthalmology PACS Market Volume (K Unit) Forecast, by Application 2020 & 2033
- Table 41: Rest of Europe Global Ophthalmology PACS Market Revenue (million) Forecast, by Application 2020 & 2033
- Table 42: Rest of Europe Global Ophthalmology PACS Market Volume (K Unit) Forecast, by Application 2020 & 2033
- Table 43: Global Ophthalmology PACS Market Revenue million Forecast, by Type 2020 & 2033
- Table 44: Global Ophthalmology PACS Market Volume K Unit Forecast, by Type 2020 & 2033
- Table 45: Global Ophthalmology PACS Market Revenue million Forecast, by Delivery Model 2020 & 2033
- Table 46: Global Ophthalmology PACS Market Volume K Unit Forecast, by Delivery Model 2020 & 2033
- Table 47: Global Ophthalmology PACS Market Revenue million Forecast, by End User 2020 & 2033
- Table 48: Global Ophthalmology PACS Market Volume K Unit Forecast, by End User 2020 & 2033
- Table 49: Global Ophthalmology PACS Market Revenue million Forecast, by Country 2020 & 2033
- Table 50: Global Ophthalmology PACS Market Volume K Unit Forecast, by Country 2020 & 2033
- Table 51: China Global Ophthalmology PACS Market Revenue (million) Forecast, by Application 2020 & 2033
- Table 52: China Global Ophthalmology PACS Market Volume (K Unit) Forecast, by Application 2020 & 2033
- Table 53: Japan Global Ophthalmology PACS Market Revenue (million) Forecast, by Application 2020 & 2033
- Table 54: Japan Global Ophthalmology PACS Market Volume (K Unit) Forecast, by Application 2020 & 2033
- Table 55: India Global Ophthalmology PACS Market Revenue (million) Forecast, by Application 2020 & 2033
- Table 56: India Global Ophthalmology PACS Market Volume (K Unit) Forecast, by Application 2020 & 2033
- Table 57: Australia Global Ophthalmology PACS Market Revenue (million) Forecast, by Application 2020 & 2033
- Table 58: Australia Global Ophthalmology PACS Market Volume (K Unit) Forecast, by Application 2020 & 2033
- Table 59: South Korea Global Ophthalmology PACS Market Revenue (million) Forecast, by Application 2020 & 2033
- Table 60: South Korea Global Ophthalmology PACS Market Volume (K Unit) Forecast, by Application 2020 & 2033
- Table 61: Rest of Asia Pacific Global Ophthalmology PACS Market Revenue (million) Forecast, by Application 2020 & 2033
- Table 62: Rest of Asia Pacific Global Ophthalmology PACS Market Volume (K Unit) Forecast, by Application 2020 & 2033
- Table 63: Global Ophthalmology PACS Market Revenue million Forecast, by Type 2020 & 2033
- Table 64: Global Ophthalmology PACS Market Volume K Unit Forecast, by Type 2020 & 2033
- Table 65: Global Ophthalmology PACS Market Revenue million Forecast, by Delivery Model 2020 & 2033
- Table 66: Global Ophthalmology PACS Market Volume K Unit Forecast, by Delivery Model 2020 & 2033
- Table 67: Global Ophthalmology PACS Market Revenue million Forecast, by End User 2020 & 2033
- Table 68: Global Ophthalmology PACS Market Volume K Unit Forecast, by End User 2020 & 2033
- Table 69: Global Ophthalmology PACS Market Revenue million Forecast, by Country 2020 & 2033
- Table 70: Global Ophthalmology PACS Market Volume K Unit Forecast, by Country 2020 & 2033
- Table 71: GCC Global Ophthalmology PACS Market Revenue (million) Forecast, by Application 2020 & 2033
- Table 72: GCC Global Ophthalmology PACS Market Volume (K Unit) Forecast, by Application 2020 & 2033
- Table 73: South Africa Global Ophthalmology PACS Market Revenue (million) Forecast, by Application 2020 & 2033
- Table 74: South Africa Global Ophthalmology PACS Market Volume (K Unit) Forecast, by Application 2020 & 2033
- Table 75: Rest of Middle East and Africa Global Ophthalmology PACS Market Revenue (million) Forecast, by Application 2020 & 2033
- Table 76: Rest of Middle East and Africa Global Ophthalmology PACS Market Volume (K Unit) Forecast, by Application 2020 & 2033
- Table 77: Global Ophthalmology PACS Market Revenue million Forecast, by Type 2020 & 2033
- Table 78: Global Ophthalmology PACS Market Volume K Unit Forecast, by Type 2020 & 2033
- Table 79: Global Ophthalmology PACS Market Revenue million Forecast, by Delivery Model 2020 & 2033
- Table 80: Global Ophthalmology PACS Market Volume K Unit Forecast, by Delivery Model 2020 & 2033
- Table 81: Global Ophthalmology PACS Market Revenue million Forecast, by End User 2020 & 2033
- Table 82: Global Ophthalmology PACS Market Volume K Unit Forecast, by End User 2020 & 2033
- Table 83: Global Ophthalmology PACS Market Revenue million Forecast, by Country 2020 & 2033
- Table 84: Global Ophthalmology PACS Market Volume K Unit Forecast, by Country 2020 & 2033
- Table 85: Brazil Global Ophthalmology PACS Market Revenue (million) Forecast, by Application 2020 & 2033
- Table 86: Brazil Global Ophthalmology PACS Market Volume (K Unit) Forecast, by Application 2020 & 2033
- Table 87: Argentina Global Ophthalmology PACS Market Revenue (million) Forecast, by Application 2020 & 2033
- Table 88: Argentina Global Ophthalmology PACS Market Volume (K Unit) Forecast, by Application 2020 & 2033
- Table 89: Rest of South America Global Ophthalmology PACS Market Revenue (million) Forecast, by Application 2020 & 2033
- Table 90: Rest of South America Global Ophthalmology PACS Market Volume (K Unit) Forecast, by Application 2020 & 2033
Frequently Asked Questions
1. What is the projected Compound Annual Growth Rate (CAGR) of the Global Ophthalmology PACS Market?
The projected CAGR is approximately 8.4%.
2. Which companies are prominent players in the Global Ophthalmology PACS Market?
Key companies in the market include VersaSuite, Heidelberg Engineering GmbH, Carl Zeiss Meditec AG, Medical Standard Co Ltd, IBM Corporation, Agfa-Gevaert N V, Visbion Limited, Sonomed Escalon.
3. What are the main segments of the Global Ophthalmology PACS Market?
The market segments include Type, Delivery Model, End User.
4. Can you provide details about the market size?
The market size is estimated to be USD 184.4 million as of 2022.
5. What are some drivers contributing to market growth?
High Prevalence of Eye Diseases; Increasing Geriatric Population; Expansion of Teleophthalmology.
6. What are the notable trends driving market growth?
Integrated PACS Segment is Expected to Show Better Growth Over the Forecast Years.
7. Are there any restraints impacting market growth?
High Implementation and Maintenance Costs.
8. Can you provide examples of recent developments in the market?
May 2022: OMNY Health partnered with community-based ophthalmology practices to launch a real-world data ecosystem focused on driving collaborative research partnerships to advance treatments and improve outcomes for patients with ophthalmic disorders.
9. What pricing options are available for accessing the report?
Pricing options include single-user, multi-user, and enterprise licenses priced at USD 4750, USD 5250, and USD 8750 respectively.
10. Is the market size provided in terms of value or volume?
The market size is provided in terms of value, measured in million and volume, measured in K Unit.
11. Are there any specific market keywords associated with the report?
Yes, the market keyword associated with the report is "Global Ophthalmology PACS Market," which aids in identifying and referencing the specific market segment covered.
12. How do I determine which pricing option suits my needs best?
The pricing options vary based on user requirements and access needs. Individual users may opt for single-user licenses, while businesses requiring broader access may choose multi-user or enterprise licenses for cost-effective access to the report.
13. Are there any additional resources or data provided in the Global Ophthalmology PACS Market report?
While the report offers comprehensive insights, it's advisable to review the specific contents or supplementary materials provided to ascertain if additional resources or data are available.
14. How can I stay updated on further developments or reports in the Global Ophthalmology PACS Market?
To stay informed about further developments, trends, and reports in the Global Ophthalmology PACS Market, consider subscribing to industry newsletters, following relevant companies and organizations, or regularly checking reputable industry news sources and publications.
Methodology
Step 1 - Identification of Relevant Samples Size from Population Database


Step 2 - Approaches for Defining Global Market Size (Value, Volume* & Price*)

Note*: In applicable scenarios
Step 3 - Data Sources
Primary Research
- Web Analytics
- Survey Reports
- Research Institute
- Latest Research Reports
- Opinion Leaders
Secondary Research
- Annual Reports
- White Paper
- Latest Press Release
- Industry Association
- Paid Database
- Investor Presentations

Step 4 - Data Triangulation
Involves using different sources of information in order to increase the validity of a study
These sources are likely to be stakeholders in a program - participants, other researchers, program staff, other community members, and so on.
Then we put all data in single framework & apply various statistical tools to find out the dynamic on the market.
During the analysis stage, feedback from the stakeholder groups would be compared to determine areas of agreement as well as areas of divergence