

Key Insights
The Global Pulmonary Arterial Hypertension (PAH) market is projected to reach $8.7 billion by 2025, exhibiting a Compound Annual Growth Rate (CAGR) of 5.4%. This robust growth is driven by increasing PAH prevalence, advancements in drug development, and enhanced disease awareness. Improved diagnostics and a rising demand for targeted therapies are key accelerators, offering better efficacy and quality of life for patients. The market is segmented by drug classes including Prostacyclin and Analogs, Calcium Channel Blockers, PDE-5 inhibitors, and Endothelin Receptor Antagonists (ERAs). Emerging treatments in the "Others" segment are also expected to contribute to market expansion.
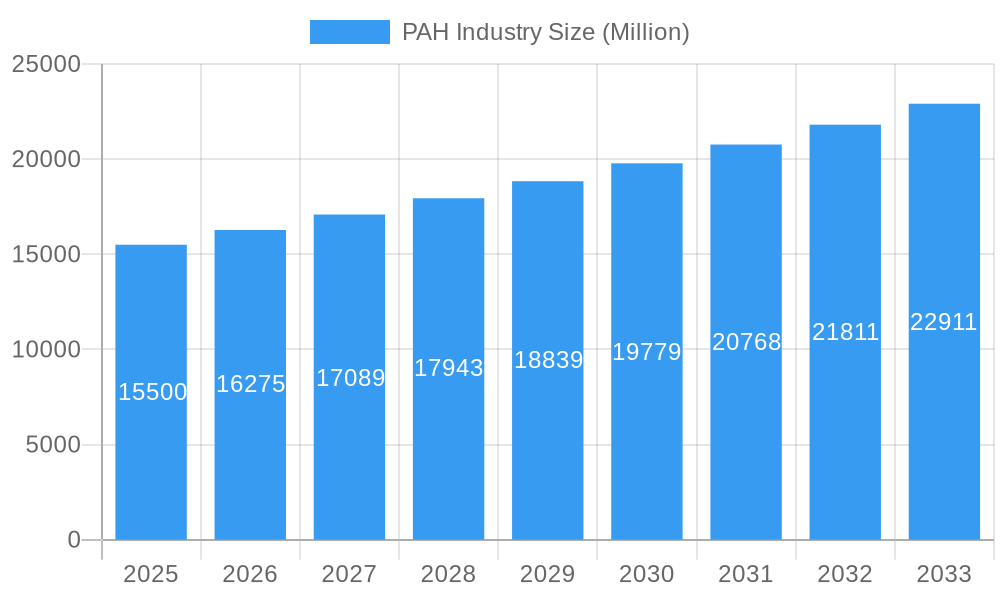
PAH Industry Market Size (In Billion)
The competitive landscape features major pharmaceutical companies such as Bayer AG, Novartis International AG, Merck & Co. Inc., GlaxoSmithKline Plc, Actelion Pharmaceuticals (Johnson & Johnson), and United Therapeutics Corporation, focusing on innovation and strategic alliances. Key restraints include the high cost of treatments and potential reimbursement challenges, impacting patient accessibility. Geographic growth is led by North America due to its advanced healthcare infrastructure and R&D investments. Europe and Asia Pacific are also set for substantial growth, fueled by rising healthcare expenditure, disease awareness, and expanding market access, with China and India emerging as significant growth centers.
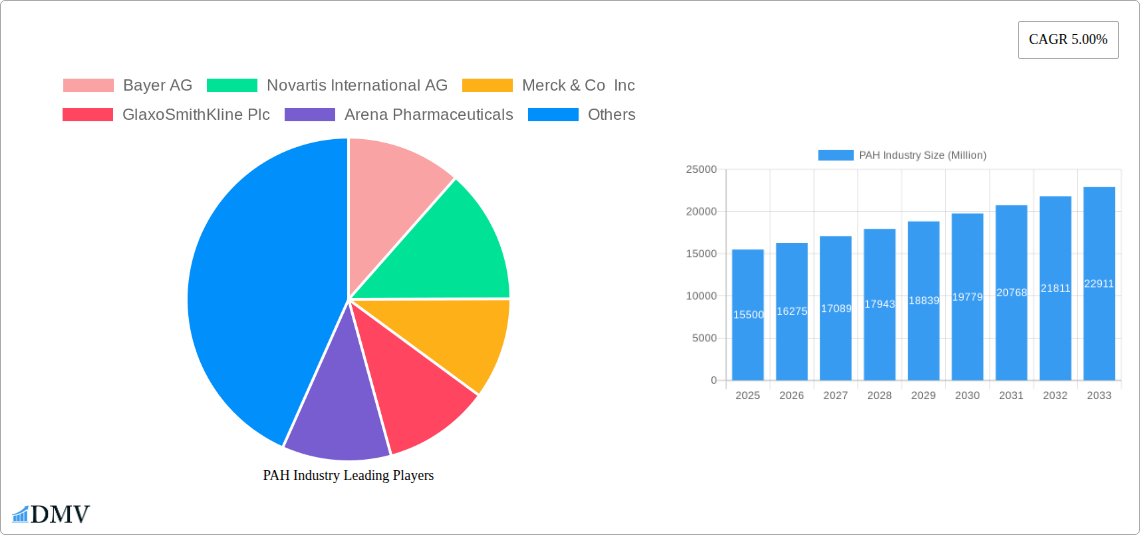
PAH Industry Company Market Share
PAH Industry Market Composition & Trends
The global Pulmonary Arterial Hypertension (PAH) market is characterized by a concentrated landscape, with a few key pharmaceutical giants dominating market share. Bayer AG, Novartis International AG, Merck & Co Inc, and GlaxoSmithKline Plc are at the forefront, collectively holding an estimated XX% market share. Innovation remains a critical catalyst, driven by continuous research and development efforts into novel therapeutic pathways and drug delivery systems. The regulatory landscape, while stringent, provides a framework for market entry, with agencies like the FDA and EMA playing pivotal roles in drug approval processes. Substitute products, though limited for severe PAH, include supportive therapies and interventional procedures. End-user profiles span a range of demographics, with a focus on improving quality of life and extending survival rates for PAH patients. Mergers and acquisitions (M&A) activity, valued at approximately XX Million historically, is a significant trend, enabling companies to expand their portfolios and consolidate market presence. For instance, Johnson & Johnson (Actelion Pharmaceuticals Ltd) acquisition of Actelion Pharmaceuticals Ltd in XXXX for XX Million significantly reshaped the market.
- Market Share Distribution: Key players like Bayer AG, Novartis International AG, Merck & Co Inc, and GlaxoSmithKline Plc hold a substantial collective market share, estimated at XX%.
- M&A Deal Values: Historical M&A activity has reached approximately XX Million, reflecting strategic consolidations and portfolio expansions.
- Innovation Catalysts: Ongoing R&D for novel therapies and delivery methods.
- Regulatory Landscape: Stringent but structured approval processes by FDA and EMA.
- End-User Profiles: Focus on enhancing patient quality of life and survival.
PAH Industry Industry Evolution
The Pulmonary Arterial Hypertension (PAH) industry has witnessed a remarkable evolution, driven by a persistent need for more effective and accessible treatments. Over the historical period of 2019–2024, the market has experienced a compound annual growth rate (CAGR) of approximately XX%, projected to continue at a robust XX% during the forecast period of 2025–2033. This growth trajectory is largely attributable to significant advancements in our understanding of PAH pathogenesis, leading to the development of targeted therapies. Technological advancements have played a crucial role, enabling more precise drug development, improved diagnostic tools, and innovative drug delivery mechanisms. The shift in consumer demands has also been a key influencer, with patients and healthcare providers increasingly seeking treatments that not only extend survival but also improve functional capacity and overall quality of life. The introduction of new drug classes and the refinement of existing ones have been instrumental in addressing unmet needs. For example, the emergence of Endothelin Receptor Antagonists (ERA) and Phosphodiesterase 5 (PDE-5) inhibitors marked a significant leap forward in treatment efficacy. Furthermore, increased awareness campaigns and improved diagnostic capabilities have led to earlier detection and intervention, contributing to market expansion. The integration of digital health solutions for patient monitoring and adherence is also emerging as a transformative trend, further shaping the industry's evolution. The estimated market size for the base year of 2025 is projected to be XX Million.
Leading Regions, Countries, or Segments in PAH Industry
The Pulmonary Arterial Hypertension (PAH) market's dominance is multifaceted, with the North America region consistently emerging as a leading force. This leadership is underpinned by a confluence of factors, including robust healthcare infrastructure, high patient awareness, and significant investment in pharmaceutical research and development. Within North America, the United States spearheads this dominance due to its advanced medical research capabilities, favorable reimbursement policies, and a substantial patient population with a high prevalence of PAH diagnoses. The market's segmentation across drug classes reveals distinct patterns of leadership and growth.
Drug Class Dominance:
- Prostacyclin and Prostacyclin Analogs: This segment, critical for advanced PAH, has historically commanded a significant market share due to its efficacy in improving symptoms and survival. Companies like United Therapeutics Corporation have been instrumental in this segment's growth.
- Endothelin Receptor Antagonists (ERA): ERAs have also been a cornerstone of PAH treatment, with major players like Actelion Pharmaceuticals Ltd (now part of Johnson & Johnson), Merck & Co Inc, and Bristol-Myers Squibb Company offering leading therapies. The ongoing development of novel ERA formulations continues to drive growth in this segment.
- Phosphodiesterase 5 (PDE-5) Inhibitors: While often used in combination therapy, PDE-5 inhibitors have seen widespread adoption, contributing substantially to the market. Pfizer Inc's Viagra and other similar drugs have been vital in this space.
- Calcium Channel Blockers: These are typically used for a subset of PAH patients and represent a smaller but important segment, often as an adjunctive therapy.
- Others: This category encompasses emerging therapies and investigational drugs, representing future growth potential.
Key Drivers of Regional Dominance (North America):
- Investment Trends: Significant R&D investments by pharmaceutical giants like Bayer AG, Novartis International AG, and Gilead Sciences Inc in the US fuel innovation and new drug development.
- Regulatory Support: Favorable regulatory pathways and incentives for orphan drug development in the US accelerate the approval of novel PAH treatments.
- Healthcare Expenditure: High per capita healthcare spending in the US allows for greater access to advanced and often expensive PAH therapies.
- Patient Advocacy and Awareness: Strong patient advocacy groups in North America contribute to increased disease awareness, early diagnosis, and demand for treatments.
- Prevalence and Diagnosis Rates: A combination of genetic predisposition and improved diagnostic methodologies leads to higher reported prevalence and diagnosis rates in the region.
The overall market is projected to reach XX Million by 2033, with North America expected to maintain its leadership position, followed by Europe. The Asia-Pacific region is anticipated to exhibit the fastest growth due to increasing healthcare access and rising awareness.
PAH Industry Product Innovations
Product innovations in the PAH industry are continuously striving to enhance therapeutic efficacy, improve patient convenience, and address unmet medical needs. Recent advancements include the development of novel oral prostacyclin receptor agonists and more targeted therapies for specific PAH subtypes. The introduction of combination therapies, leveraging the synergistic effects of different drug classes, represents a significant innovation, offering improved clinical outcomes. For instance, the ongoing exploration of drugs like seralutinib for PAH by Gossamer Bio, Inc. showcases the industry's commitment to pushing the boundaries of treatment. These innovations are characterized by improved pharmacokinetic profiles, reduced side effects, and enhanced patient adherence, ultimately aiming to significantly improve the quality of life and long-term prognosis for individuals living with PAH. The estimated market size driven by these innovations is projected to reach XX Million by 2033.
Propelling Factors for PAH Industry Growth
The Pulmonary Arterial Hypertension (PAH) industry's growth is propelled by several key factors. Firstly, increasing global awareness of the disease and improvements in diagnostic techniques lead to earlier and more accurate diagnoses, expanding the patient pool seeking treatment. Secondly, significant investments in research and development by major pharmaceutical companies, including Bayer AG and Novartis International AG, are continuously introducing novel and more effective therapeutic agents. Thirdly, favorable reimbursement policies and government initiatives aimed at treating rare diseases, such as PAH, further incentivize market expansion. The growing prevalence of associated conditions like connective tissue diseases and congenital heart defects also contributes to the rising incidence of PAH, driving demand for effective treatments.
Obstacles in the PAH Industry Market
Despite the promising growth, the PAH industry faces several significant obstacles. High treatment costs associated with novel therapies remain a substantial barrier for many patients and healthcare systems globally, impacting market accessibility. The complex and lengthy drug development process, coupled with stringent regulatory requirements for orphan diseases, can delay market entry for new innovations. Supply chain disruptions, particularly for specialized biologics and raw materials, can also pose challenges to consistent product availability. Furthermore, the competitive landscape, while growing, can lead to intense market pressures and pricing challenges for established players like Merck & Co Inc and GlaxoSmithKline Plc. The limited number of approved therapies for specific PAH patient groups also presents an unmet medical need.
Future Opportunities in PAH Industry
The future of the PAH industry is ripe with opportunities. The development of personalized medicine approaches, tailoring treatments based on a patient's genetic profile and disease specificities, presents a significant avenue for growth. Exploring new therapeutic targets beyond established pathways, such as inflammatory mediators and cellular signaling pathways, holds immense potential. The expanding market in emerging economies, with increasing healthcare infrastructure and disposable income, offers substantial untapped potential. Furthermore, advancements in drug delivery systems, including long-acting injectables and inhaled therapies, can improve patient compliance and outcomes. The potential for digital health solutions in remote patient monitoring and adherence support also represents a growing opportunity for companies like Gilead Sciences Inc and Bristol-Myers Squibb Company.
Major Players in the PAH Industry Ecosystem
- Bayer AG
- Novartis International AG
- Merck & Co Inc
- GlaxoSmithKline Plc
- Arena Pharmaceuticals
- Johnson & Johnson
- Gilead Sciences Inc
- Bristol-Myers Squibb Company
- United Therapeutics Corporation
- Pfizer Inc
Key Developments in PAH Industry Industry
- July 2022: Cereno Scientific announced that the first patient had been enrolled in the Phase II study in pulmonary arterial hypertension (PAH) with drug candidate CS1.
- June 2022: Gossamer Bio, Inc. announced the publication of key preclinical data supporting the potential of seralutinib for the treatment of pulmonary arterial hypertension (PAH).
Strategic PAH Industry Market Forecast
The PAH industry market is poised for substantial growth driven by continued therapeutic innovation and increasing global diagnosis rates. The forecast period of 2025–2033 anticipates a robust CAGR of XX%, with the market reaching an estimated XX Million by 2033. Key growth catalysts include the ongoing development of novel drug candidates by companies like Arena Pharmaceuticals and Johnson & Johnson (Actelion Pharmaceuticals Ltd), focusing on unmet needs in advanced PAH. Furthermore, the expanding market penetration in emerging economies and the adoption of combination therapies will significantly contribute to market expansion. Strategic collaborations and mergers, valued at an estimated XX Million annually, will continue to shape the competitive landscape, driving research and development and enhancing market access for life-changing PAH treatments.
PAH Industry Segmentation
-
1. Drug Class
- 1.1. Prostacyclin and Prostacyclin Analogs
- 1.2. Calcium Channel Blockers
- 1.3. Phosphodiesterase 5 (PDE-5)
- 1.4. Endothelin Receptor Antagonists (ERA)
- 1.5. Others
PAH Industry Segmentation By Geography
-
1. North America
- 1.1. United States
- 1.2. Canada
- 1.3. Mexico
-
2. Europe
- 2.1. Germany
- 2.2. United Kingdom
- 2.3. France
- 2.4. Italy
- 2.5. Spain
- 2.6. Rest of Europe
-
3. Asia Pacific
- 3.1. China
- 3.2. Japan
- 3.3. India
- 3.4. Australia
- 3.5. South Korea
- 3.6. Rest of Asia Pacific
-
4. Middle East and Africa
- 4.1. GCC
- 4.2. South Africa
- 4.3. Rest of Middle East and Africa
-
5. South America
- 5.1. Brazil
- 5.2. Argentina
- 5.3. Rest of South America
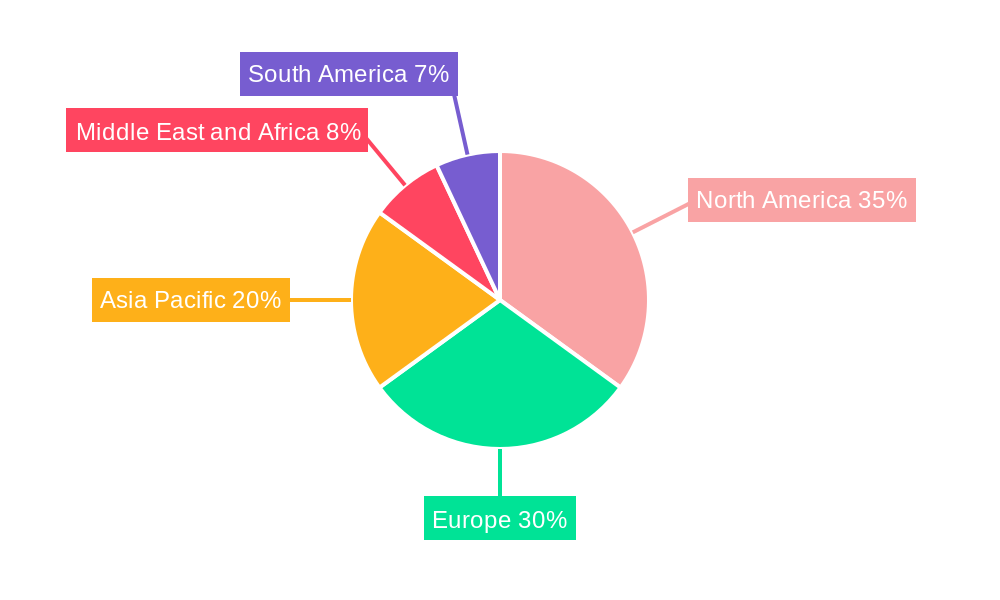
PAH Industry Regional Market Share
Geographic Coverage of PAH Industry
PAH Industry REPORT HIGHLIGHTS
| Aspects | Details |
|---|---|
| Study Period | 2020-2034 |
| Base Year | 2025 |
| Estimated Year | 2026 |
| Forecast Period | 2026-2034 |
| Historical Period | 2020-2025 |
| Growth Rate | CAGR of 5.4% from 2020-2034 |
| Segmentation |
|
Table of Contents
- 1. Introduction
- 1.1. Research Scope
- 1.2. Market Segmentation
- 1.3. Research Objective
- 1.4. Definitions and Assumptions
- 2. Executive Summary
- 2.1. Market Snapshot
- 3. Market Dynamics
- 3.1. Market Drivers
- 3.2. Market Restrains
- 3.3. Market Trends
- 3.4. Market Opportunities
- 4. Market Factor Analysis
- 4.1. Porters Five Forces
- 4.1.1. Bargaining Power of Suppliers
- 4.1.2. Bargaining Power of Buyers
- 4.1.3. Threat of New Entrants
- 4.1.4. Threat of Substitutes
- 4.1.5. Competitive Rivalry
- 4.2. PESTEL analysis
- 4.3. BCG Analysis
- 4.3.1. Stars (High Growth, High Market Share)
- 4.3.2. Cash Cows (Low Growth, High Market Share)
- 4.3.3. Question Mark (High Growth, Low Market Share)
- 4.3.4. Dogs (Low Growth, Low Market Share)
- 4.4. Ansoff Matrix Analysis
- 4.5. Supply Chain Analysis
- 4.6. Regulatory Landscape
- 4.7. Current Market Potential and Opportunity Assessment (TAM–SAM–SOM Framework)
- 4.8. DMV Analyst Note
- 4.1. Porters Five Forces
- 5. Market Analysis, Insights and Forecast 2021-2033
- 5.1. Market Analysis, Insights and Forecast - by Drug Class
- 5.1.1. Prostacyclin and Prostacyclin Analogs
- 5.1.2. Calcium Channel Blockers
- 5.1.3. Phosphodiesterase 5 (PDE-5)
- 5.1.4. Endothelin Receptor Antagonists (ERA)
- 5.1.5. Others
- 5.2. Market Analysis, Insights and Forecast - by Region
- 5.2.1. North America
- 5.2.2. Europe
- 5.2.3. Asia Pacific
- 5.2.4. Middle East and Africa
- 5.2.5. South America
- 5.1. Market Analysis, Insights and Forecast - by Drug Class
- 6. Global PAH Industry Analysis, Insights and Forecast, 2021-2033
- 6.1. Market Analysis, Insights and Forecast - by Drug Class
- 6.1.1. Prostacyclin and Prostacyclin Analogs
- 6.1.2. Calcium Channel Blockers
- 6.1.3. Phosphodiesterase 5 (PDE-5)
- 6.1.4. Endothelin Receptor Antagonists (ERA)
- 6.1.5. Others
- 6.1. Market Analysis, Insights and Forecast - by Drug Class
- 7. North America PAH Industry Analysis, Insights and Forecast, 2020-2032
- 7.1. Market Analysis, Insights and Forecast - by Drug Class
- 7.1.1. Prostacyclin and Prostacyclin Analogs
- 7.1.2. Calcium Channel Blockers
- 7.1.3. Phosphodiesterase 5 (PDE-5)
- 7.1.4. Endothelin Receptor Antagonists (ERA)
- 7.1.5. Others
- 7.1. Market Analysis, Insights and Forecast - by Drug Class
- 8. Europe PAH Industry Analysis, Insights and Forecast, 2020-2032
- 8.1. Market Analysis, Insights and Forecast - by Drug Class
- 8.1.1. Prostacyclin and Prostacyclin Analogs
- 8.1.2. Calcium Channel Blockers
- 8.1.3. Phosphodiesterase 5 (PDE-5)
- 8.1.4. Endothelin Receptor Antagonists (ERA)
- 8.1.5. Others
- 8.1. Market Analysis, Insights and Forecast - by Drug Class
- 9. Asia Pacific PAH Industry Analysis, Insights and Forecast, 2020-2032
- 9.1. Market Analysis, Insights and Forecast - by Drug Class
- 9.1.1. Prostacyclin and Prostacyclin Analogs
- 9.1.2. Calcium Channel Blockers
- 9.1.3. Phosphodiesterase 5 (PDE-5)
- 9.1.4. Endothelin Receptor Antagonists (ERA)
- 9.1.5. Others
- 9.1. Market Analysis, Insights and Forecast - by Drug Class
- 10. Middle East and Africa PAH Industry Analysis, Insights and Forecast, 2020-2032
- 10.1. Market Analysis, Insights and Forecast - by Drug Class
- 10.1.1. Prostacyclin and Prostacyclin Analogs
- 10.1.2. Calcium Channel Blockers
- 10.1.3. Phosphodiesterase 5 (PDE-5)
- 10.1.4. Endothelin Receptor Antagonists (ERA)
- 10.1.5. Others
- 10.1. Market Analysis, Insights and Forecast - by Drug Class
- 11. South America PAH Industry Analysis, Insights and Forecast, 2020-2032
- 11.1. Market Analysis, Insights and Forecast - by Drug Class
- 11.1.1. Prostacyclin and Prostacyclin Analogs
- 11.1.2. Calcium Channel Blockers
- 11.1.3. Phosphodiesterase 5 (PDE-5)
- 11.1.4. Endothelin Receptor Antagonists (ERA)
- 11.1.5. Others
- 11.1. Market Analysis, Insights and Forecast - by Drug Class
- 12. Competitive Analysis
- 12.1. Company Profiles
- 12.1.1 Bayer AG
- 12.1.1.1. Company Overview
- 12.1.1.2. Products
- 12.1.1.3. Company Financials
- 12.1.1.4. SWOT Analysis
- 12.1.2 Novartis International AG
- 12.1.2.1. Company Overview
- 12.1.2.2. Products
- 12.1.2.3. Company Financials
- 12.1.2.4. SWOT Analysis
- 12.1.3 Merck & Co Inc
- 12.1.3.1. Company Overview
- 12.1.3.2. Products
- 12.1.3.3. Company Financials
- 12.1.3.4. SWOT Analysis
- 12.1.4 GlaxoSmithKline Plc
- 12.1.4.1. Company Overview
- 12.1.4.2. Products
- 12.1.4.3. Company Financials
- 12.1.4.4. SWOT Analysis
- 12.1.5 Arena Pharmaceuticals
- 12.1.5.1. Company Overview
- 12.1.5.2. Products
- 12.1.5.3. Company Financials
- 12.1.5.4. SWOT Analysis
- 12.1.6 Johnson & Johnson (Actelion Pharmaceuticals Ltd )
- 12.1.6.1. Company Overview
- 12.1.6.2. Products
- 12.1.6.3. Company Financials
- 12.1.6.4. SWOT Analysis
- 12.1.7 Gilead Sciences Inc
- 12.1.7.1. Company Overview
- 12.1.7.2. Products
- 12.1.7.3. Company Financials
- 12.1.7.4. SWOT Analysis
- 12.1.8 Bristol-Myers Squibb Company
- 12.1.8.1. Company Overview
- 12.1.8.2. Products
- 12.1.8.3. Company Financials
- 12.1.8.4. SWOT Analysis
- 12.1.9 United Therapeutics Corporation
- 12.1.9.1. Company Overview
- 12.1.9.2. Products
- 12.1.9.3. Company Financials
- 12.1.9.4. SWOT Analysis
- 12.1.10 Pfizer Inc
- 12.1.10.1. Company Overview
- 12.1.10.2. Products
- 12.1.10.3. Company Financials
- 12.1.10.4. SWOT Analysis
- 12.1.1 Bayer AG
- 12.2. Market Entropy
- 12.2.1 Company's Key Areas Served
- 12.2.2 Recent Developments
- 12.3. Company Market Share Analysis 2025
- 12.3.1 Top 5 Companies Market Share Analysis
- 12.3.2 Top 3 Companies Market Share Analysis
- 12.4. List of Potential Customers
- 13. Research Methodology
List of Figures
- Figure 1: Global PAH Industry Revenue Breakdown (billion, %) by Region 2025 & 2033
- Figure 2: Global PAH Industry Volume Breakdown (K Unit, %) by Region 2025 & 2033
- Figure 3: North America PAH Industry Revenue (billion), by Drug Class 2025 & 2033
- Figure 4: North America PAH Industry Volume (K Unit), by Drug Class 2025 & 2033
- Figure 5: North America PAH Industry Revenue Share (%), by Drug Class 2025 & 2033
- Figure 6: North America PAH Industry Volume Share (%), by Drug Class 2025 & 2033
- Figure 7: North America PAH Industry Revenue (billion), by Country 2025 & 2033
- Figure 8: North America PAH Industry Volume (K Unit), by Country 2025 & 2033
- Figure 9: North America PAH Industry Revenue Share (%), by Country 2025 & 2033
- Figure 10: North America PAH Industry Volume Share (%), by Country 2025 & 2033
- Figure 11: Europe PAH Industry Revenue (billion), by Drug Class 2025 & 2033
- Figure 12: Europe PAH Industry Volume (K Unit), by Drug Class 2025 & 2033
- Figure 13: Europe PAH Industry Revenue Share (%), by Drug Class 2025 & 2033
- Figure 14: Europe PAH Industry Volume Share (%), by Drug Class 2025 & 2033
- Figure 15: Europe PAH Industry Revenue (billion), by Country 2025 & 2033
- Figure 16: Europe PAH Industry Volume (K Unit), by Country 2025 & 2033
- Figure 17: Europe PAH Industry Revenue Share (%), by Country 2025 & 2033
- Figure 18: Europe PAH Industry Volume Share (%), by Country 2025 & 2033
- Figure 19: Asia Pacific PAH Industry Revenue (billion), by Drug Class 2025 & 2033
- Figure 20: Asia Pacific PAH Industry Volume (K Unit), by Drug Class 2025 & 2033
- Figure 21: Asia Pacific PAH Industry Revenue Share (%), by Drug Class 2025 & 2033
- Figure 22: Asia Pacific PAH Industry Volume Share (%), by Drug Class 2025 & 2033
- Figure 23: Asia Pacific PAH Industry Revenue (billion), by Country 2025 & 2033
- Figure 24: Asia Pacific PAH Industry Volume (K Unit), by Country 2025 & 2033
- Figure 25: Asia Pacific PAH Industry Revenue Share (%), by Country 2025 & 2033
- Figure 26: Asia Pacific PAH Industry Volume Share (%), by Country 2025 & 2033
- Figure 27: Middle East and Africa PAH Industry Revenue (billion), by Drug Class 2025 & 2033
- Figure 28: Middle East and Africa PAH Industry Volume (K Unit), by Drug Class 2025 & 2033
- Figure 29: Middle East and Africa PAH Industry Revenue Share (%), by Drug Class 2025 & 2033
- Figure 30: Middle East and Africa PAH Industry Volume Share (%), by Drug Class 2025 & 2033
- Figure 31: Middle East and Africa PAH Industry Revenue (billion), by Country 2025 & 2033
- Figure 32: Middle East and Africa PAH Industry Volume (K Unit), by Country 2025 & 2033
- Figure 33: Middle East and Africa PAH Industry Revenue Share (%), by Country 2025 & 2033
- Figure 34: Middle East and Africa PAH Industry Volume Share (%), by Country 2025 & 2033
- Figure 35: South America PAH Industry Revenue (billion), by Drug Class 2025 & 2033
- Figure 36: South America PAH Industry Volume (K Unit), by Drug Class 2025 & 2033
- Figure 37: South America PAH Industry Revenue Share (%), by Drug Class 2025 & 2033
- Figure 38: South America PAH Industry Volume Share (%), by Drug Class 2025 & 2033
- Figure 39: South America PAH Industry Revenue (billion), by Country 2025 & 2033
- Figure 40: South America PAH Industry Volume (K Unit), by Country 2025 & 2033
- Figure 41: South America PAH Industry Revenue Share (%), by Country 2025 & 2033
- Figure 42: South America PAH Industry Volume Share (%), by Country 2025 & 2033
List of Tables
- Table 1: Global PAH Industry Revenue billion Forecast, by Drug Class 2020 & 2033
- Table 2: Global PAH Industry Volume K Unit Forecast, by Drug Class 2020 & 2033
- Table 3: Global PAH Industry Revenue billion Forecast, by Region 2020 & 2033
- Table 4: Global PAH Industry Volume K Unit Forecast, by Region 2020 & 2033
- Table 5: Global PAH Industry Revenue billion Forecast, by Drug Class 2020 & 2033
- Table 6: Global PAH Industry Volume K Unit Forecast, by Drug Class 2020 & 2033
- Table 7: Global PAH Industry Revenue billion Forecast, by Country 2020 & 2033
- Table 8: Global PAH Industry Volume K Unit Forecast, by Country 2020 & 2033
- Table 9: United States PAH Industry Revenue (billion) Forecast, by Application 2020 & 2033
- Table 10: United States PAH Industry Volume (K Unit) Forecast, by Application 2020 & 2033
- Table 11: Canada PAH Industry Revenue (billion) Forecast, by Application 2020 & 2033
- Table 12: Canada PAH Industry Volume (K Unit) Forecast, by Application 2020 & 2033
- Table 13: Mexico PAH Industry Revenue (billion) Forecast, by Application 2020 & 2033
- Table 14: Mexico PAH Industry Volume (K Unit) Forecast, by Application 2020 & 2033
- Table 15: Global PAH Industry Revenue billion Forecast, by Drug Class 2020 & 2033
- Table 16: Global PAH Industry Volume K Unit Forecast, by Drug Class 2020 & 2033
- Table 17: Global PAH Industry Revenue billion Forecast, by Country 2020 & 2033
- Table 18: Global PAH Industry Volume K Unit Forecast, by Country 2020 & 2033
- Table 19: Germany PAH Industry Revenue (billion) Forecast, by Application 2020 & 2033
- Table 20: Germany PAH Industry Volume (K Unit) Forecast, by Application 2020 & 2033
- Table 21: United Kingdom PAH Industry Revenue (billion) Forecast, by Application 2020 & 2033
- Table 22: United Kingdom PAH Industry Volume (K Unit) Forecast, by Application 2020 & 2033
- Table 23: France PAH Industry Revenue (billion) Forecast, by Application 2020 & 2033
- Table 24: France PAH Industry Volume (K Unit) Forecast, by Application 2020 & 2033
- Table 25: Italy PAH Industry Revenue (billion) Forecast, by Application 2020 & 2033
- Table 26: Italy PAH Industry Volume (K Unit) Forecast, by Application 2020 & 2033
- Table 27: Spain PAH Industry Revenue (billion) Forecast, by Application 2020 & 2033
- Table 28: Spain PAH Industry Volume (K Unit) Forecast, by Application 2020 & 2033
- Table 29: Rest of Europe PAH Industry Revenue (billion) Forecast, by Application 2020 & 2033
- Table 30: Rest of Europe PAH Industry Volume (K Unit) Forecast, by Application 2020 & 2033
- Table 31: Global PAH Industry Revenue billion Forecast, by Drug Class 2020 & 2033
- Table 32: Global PAH Industry Volume K Unit Forecast, by Drug Class 2020 & 2033
- Table 33: Global PAH Industry Revenue billion Forecast, by Country 2020 & 2033
- Table 34: Global PAH Industry Volume K Unit Forecast, by Country 2020 & 2033
- Table 35: China PAH Industry Revenue (billion) Forecast, by Application 2020 & 2033
- Table 36: China PAH Industry Volume (K Unit) Forecast, by Application 2020 & 2033
- Table 37: Japan PAH Industry Revenue (billion) Forecast, by Application 2020 & 2033
- Table 38: Japan PAH Industry Volume (K Unit) Forecast, by Application 2020 & 2033
- Table 39: India PAH Industry Revenue (billion) Forecast, by Application 2020 & 2033
- Table 40: India PAH Industry Volume (K Unit) Forecast, by Application 2020 & 2033
- Table 41: Australia PAH Industry Revenue (billion) Forecast, by Application 2020 & 2033
- Table 42: Australia PAH Industry Volume (K Unit) Forecast, by Application 2020 & 2033
- Table 43: South Korea PAH Industry Revenue (billion) Forecast, by Application 2020 & 2033
- Table 44: South Korea PAH Industry Volume (K Unit) Forecast, by Application 2020 & 2033
- Table 45: Rest of Asia Pacific PAH Industry Revenue (billion) Forecast, by Application 2020 & 2033
- Table 46: Rest of Asia Pacific PAH Industry Volume (K Unit) Forecast, by Application 2020 & 2033
- Table 47: Global PAH Industry Revenue billion Forecast, by Drug Class 2020 & 2033
- Table 48: Global PAH Industry Volume K Unit Forecast, by Drug Class 2020 & 2033
- Table 49: Global PAH Industry Revenue billion Forecast, by Country 2020 & 2033
- Table 50: Global PAH Industry Volume K Unit Forecast, by Country 2020 & 2033
- Table 51: GCC PAH Industry Revenue (billion) Forecast, by Application 2020 & 2033
- Table 52: GCC PAH Industry Volume (K Unit) Forecast, by Application 2020 & 2033
- Table 53: South Africa PAH Industry Revenue (billion) Forecast, by Application 2020 & 2033
- Table 54: South Africa PAH Industry Volume (K Unit) Forecast, by Application 2020 & 2033
- Table 55: Rest of Middle East and Africa PAH Industry Revenue (billion) Forecast, by Application 2020 & 2033
- Table 56: Rest of Middle East and Africa PAH Industry Volume (K Unit) Forecast, by Application 2020 & 2033
- Table 57: Global PAH Industry Revenue billion Forecast, by Drug Class 2020 & 2033
- Table 58: Global PAH Industry Volume K Unit Forecast, by Drug Class 2020 & 2033
- Table 59: Global PAH Industry Revenue billion Forecast, by Country 2020 & 2033
- Table 60: Global PAH Industry Volume K Unit Forecast, by Country 2020 & 2033
- Table 61: Brazil PAH Industry Revenue (billion) Forecast, by Application 2020 & 2033
- Table 62: Brazil PAH Industry Volume (K Unit) Forecast, by Application 2020 & 2033
- Table 63: Argentina PAH Industry Revenue (billion) Forecast, by Application 2020 & 2033
- Table 64: Argentina PAH Industry Volume (K Unit) Forecast, by Application 2020 & 2033
- Table 65: Rest of South America PAH Industry Revenue (billion) Forecast, by Application 2020 & 2033
- Table 66: Rest of South America PAH Industry Volume (K Unit) Forecast, by Application 2020 & 2033
Frequently Asked Questions
1. What is the projected Compound Annual Growth Rate (CAGR) of the PAH Industry?
The projected CAGR is approximately 5.4%.
2. Which companies are prominent players in the PAH Industry?
Key companies in the market include Bayer AG, Novartis International AG, Merck & Co Inc, GlaxoSmithKline Plc, Arena Pharmaceuticals, Johnson & Johnson (Actelion Pharmaceuticals Ltd ), Gilead Sciences Inc, Bristol-Myers Squibb Company, United Therapeutics Corporation, Pfizer Inc.
3. What are the main segments of the PAH Industry?
The market segments include Drug Class.
4. Can you provide details about the market size?
The market size is estimated to be USD 8.7 billion as of 2022.
5. What are some drivers contributing to market growth?
Growing Burden of Pulmonary Arterial Hypertension; Government and Private Support for the Development of Orphan Drugs.
6. What are the notable trends driving market growth?
Prostacyclin and Prostacyclin Analogs Segment is Expected to Observe Better Growth Over the Forecast Period.
7. Are there any restraints impacting market growth?
Patent Expiration of Drug Molecule; Side Effects Associated with the Drugs.
8. Can you provide examples of recent developments in the market?
In July 2022, Cereno Scientific announced that the first patient had been enrolled in the Phase II study in pulmonary arterial hypertension (PAH) with drug candidate CS1.
9. What pricing options are available for accessing the report?
Pricing options include single-user, multi-user, and enterprise licenses priced at USD 4750, USD 5250, and USD 8750 respectively.
10. Is the market size provided in terms of value or volume?
The market size is provided in terms of value, measured in billion and volume, measured in K Unit.
11. Are there any specific market keywords associated with the report?
Yes, the market keyword associated with the report is "PAH Industry," which aids in identifying and referencing the specific market segment covered.
12. How do I determine which pricing option suits my needs best?
The pricing options vary based on user requirements and access needs. Individual users may opt for single-user licenses, while businesses requiring broader access may choose multi-user or enterprise licenses for cost-effective access to the report.
13. Are there any additional resources or data provided in the PAH Industry report?
While the report offers comprehensive insights, it's advisable to review the specific contents or supplementary materials provided to ascertain if additional resources or data are available.
14. How can I stay updated on further developments or reports in the PAH Industry?
To stay informed about further developments, trends, and reports in the PAH Industry, consider subscribing to industry newsletters, following relevant companies and organizations, or regularly checking reputable industry news sources and publications.
Methodology
Step 1 - Identification of Relevant Samples Size from Population Database


Step 2 - Approaches for Defining Global Market Size (Value, Volume* & Price*)

Note*: In applicable scenarios
Step 3 - Data Sources
Primary Research
- Web Analytics
- Survey Reports
- Research Institute
- Latest Research Reports
- Opinion Leaders
Secondary Research
- Annual Reports
- White Paper
- Latest Press Release
- Industry Association
- Paid Database
- Investor Presentations

Step 4 - Data Triangulation
Involves using different sources of information in order to increase the validity of a study
These sources are likely to be stakeholders in a program - participants, other researchers, program staff, other community members, and so on.
Then we put all data in single framework & apply various statistical tools to find out the dynamic on the market.
During the analysis stage, feedback from the stakeholder groups would be compared to determine areas of agreement as well as areas of divergence