

Key Insights
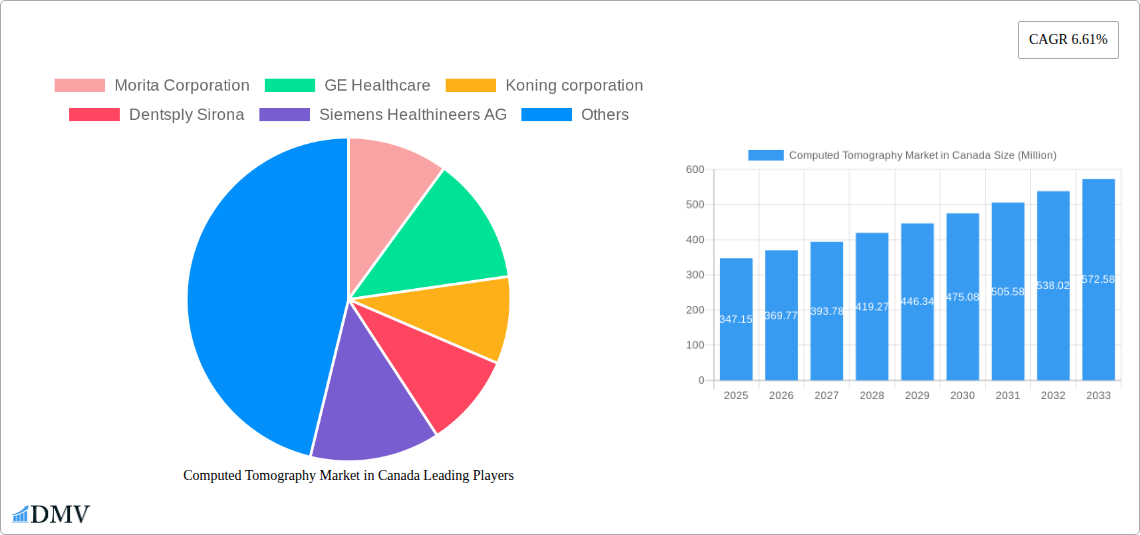
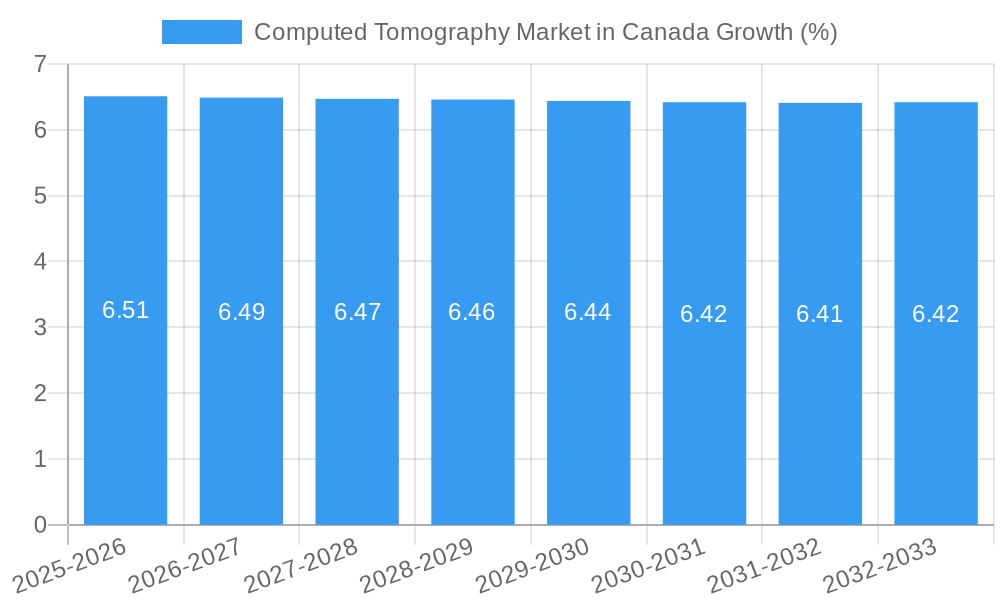
The Canadian Computed Tomography (CT) market is poised for robust growth, driven by an increasing prevalence of chronic diseases and an aging population that necessitates advanced diagnostic imaging. With a current market size estimated at $330.24 million, the sector is projected to expand at a Compound Annual Growth Rate (CAGR) of 6.61% through 2033. This sustained growth is primarily fueled by the rising demand for faster, more accurate diagnostic tools, particularly in key applications such as oncology, neurology, and cardiovascular imaging. Technological advancements, including the development of lower-radiation dose CT scanners (Low Slice), are also playing a crucial role, addressing growing concerns about patient safety and making CT scans more accessible for routine screening and follow-up examinations. The increasing adoption of multi-slice and high-slice CT scanners further enhances diagnostic capabilities, offering higher resolution and faster scan times, which are critical for timely and effective patient management.
The competitive landscape in Canada's CT market is characterized by the presence of major global players like Siemens Healthineers AG, GE Healthcare, and Koninklijke Philips NV, alongside emerging innovators such as Koning Corporation. These companies are actively investing in research and development to introduce next-generation CT technology that offers improved image quality, reduced scan times, and enhanced patient comfort. The market's expansion is further supported by strategic collaborations between technology providers and healthcare institutions, facilitating the integration of advanced CT systems into hospitals and diagnostic centers. While the demand for CT imaging in Canada is strong, potential restraints could include the high initial capital investment required for advanced CT systems and the ongoing need for skilled radiographers and technicians to operate and interpret the complex data generated. However, the clear benefits in early disease detection and personalized treatment planning are expected to outweigh these challenges, ensuring continued market penetration and value creation.
Dive deep into the burgeoning Computed Tomography (CT) market in Canada with this incisive report. Covering the study period of 2019 to 2033, with a base year of 2025 and a forecast period of 2025–2033, this analysis provides unparalleled insights for stakeholders, investors, and industry leaders. Discover the drivers, challenges, and future trajectory of CT scan adoption across Canada, from low slice CT to high slice CT systems, and their critical applications in oncology, neurology, cardiovascular, musculoskeletal, and more.
Computed Tomography Market in Canada Market Composition & Trends
The Canadian CT scanner market exhibits a dynamic composition shaped by technological innovation and evolving healthcare demands. Market concentration is influenced by a few key global players offering advanced CT imaging systems, with significant market share held by companies like GE Healthcare, Siemens Healthineers AG, and Koninklijke Philips NV. However, the rise of specialized players and domestic service providers is fostering a more competitive landscape. Innovation catalysts include the increasing demand for early disease detection, minimally invasive procedures, and personalized medicine, driving advancements in areas like AI-powered CT interpretation and low-dose CT technology. The regulatory environment, while stringent, supports the adoption of advanced diagnostic tools through clear approval pathways. Substitute products, primarily MRI and Ultrasound, offer complementary diagnostic capabilities but do not fully replace the unique anatomical visualization provided by CT. End-user profiles range from large hospital networks to independent diagnostic centers, each with distinct purchasing criteria and investment capacities. Mergers and acquisitions (M&A) activities are also shaping the market, with strategic investments aimed at expanding market reach and enhancing technological portfolios. For instance, the acquisition of Varian by Siemens Healthineers signals a significant consolidation trend, aiming to leverage synergies in radiology and oncology imaging. Market share distribution remains competitive, with an estimated XXX representing the market size in 2025. M&A deal values are projected to grow, reflecting the strategic importance of this sector.
Computed Tomography Market in Canada Industry Evolution
The Canadian computed tomography market has undergone significant evolution, driven by a relentless pursuit of diagnostic accuracy and improved patient outcomes. Over the historical period of 2019–2024 and extending through the forecast period of 2025–2033, the market has witnessed robust growth trajectories fueled by increasing healthcare expenditures, an aging population, and a rising prevalence of chronic diseases such as cancer, cardiovascular disorders, and neurological conditions. Technological advancements have been a cornerstone of this evolution. The transition from low slice CT to medium slice CT and subsequently to high-end high slice CT scanners has dramatically enhanced image resolution, reduced scan times, and lowered radiation doses, making CT a preferred diagnostic modality for a wider range of conditions. The adoption of dual-energy CT and photon-counting CT technologies further expands diagnostic capabilities, allowing for improved tissue characterization and quantitative analysis.
Shifting consumer demands, influenced by greater health awareness and the accessibility of advanced medical information, are also playing a crucial role. Patients and healthcare providers alike are increasingly seeking faster, more accurate, and less invasive diagnostic methods. This demand has spurred the development and adoption of advanced CT applications in fields such as oncology imaging for precise tumor staging and treatment monitoring, neurology for the rapid diagnosis of stroke and neurodegenerative diseases, and cardiovascular imaging for assessing coronary artery disease and structural heart abnormalities. The integration of artificial intelligence (AI) in CT imaging is a transformative development, promising to automate image analysis, enhance workflow efficiency, and improve diagnostic accuracy, thereby accelerating the adoption of new CT technologies. The Canadian government's continued investment in healthcare infrastructure and a supportive regulatory framework for medical devices have further facilitated market expansion. The overall CAGR of the Canadian CT market is projected to be XX% from 2025 to 2033, underscoring its significant growth potential. The estimated market size in 2025 stands at XXX Million, projected to reach XXX Million by 2033.
Leading Regions, Countries, or Segments in Computed Tomography Market in Canada
Within the Canadian computed tomography market, several key segments and regions demonstrate remarkable dominance and growth potential.
Dominant Segments by Application:
- Oncology: This application segment leads the market due to the high incidence of cancer in Canada and the crucial role of CT in early detection, staging, treatment planning, and follow-up. The demand for advanced CT technologies that offer superior soft-tissue contrast and volumetric imaging for precise tumor characterization is a significant driver.
- Neurology: With an aging population and a rising concern for neurological disorders like stroke, Alzheimer's, and Parkinson's, the neurology segment exhibits substantial growth. CT's ability to quickly identify bleeds and blockages in the brain makes it indispensable for emergency neurological care.
- Cardiovascular: The increasing prevalence of cardiovascular diseases in Canada fuels the demand for CT angiography and cardiac CT for the assessment of coronary artery disease and other heart conditions. The development of faster CT scanners with reduced radiation doses is enhancing its utility in this segment.
Dominant Segments by End User:
- Hospitals: As the primary providers of comprehensive healthcare services, hospitals represent the largest end-user segment. Their continuous need for advanced diagnostic imaging equipment to cater to a broad spectrum of patient needs, coupled with significant capital budgets, drives adoption.
- Diagnostic Centers: The growing trend of outsourcing diagnostic services and the increasing focus on specialized imaging centers contribute to the robust growth of this segment. These centers often invest in the latest CT technology to attract a larger patient pool and offer competitive services.
Dominant Segments by Type:
- High Slice CT: While initially expensive, high slice CT scanners are increasingly becoming the standard due to their superior resolution, faster scan times, and ability to perform complex imaging protocols, particularly in oncology and cardiovascular applications.
- Medium Slice CT: These systems offer a good balance of performance and cost-effectiveness, making them a popular choice for diagnostic centers and smaller hospitals that cater to a wide range of general diagnostic needs.
Regional Dominance:
- Ontario and Quebec: These provinces, with their larger populations and well-established healthcare infrastructures, tend to lead in the adoption of advanced CT technologies and the overall market size for CT scanners in Canada. Their significant investment in healthcare and the presence of major medical research institutions further bolster CT market growth.
Key drivers for segment dominance include substantial investment trends in advanced medical technology, supportive government policies aimed at improving diagnostic capabilities, and the increasing burden of chronic diseases requiring sophisticated imaging solutions. Regulatory support for the approval and adoption of new CT devices plays a vital role in segment expansion. The market size for oncology CT scans is estimated to be XXX Million in 2025, while the neurology CT market is projected at XXX Million for the same year.
Computed Tomography Market in Canada Product Innovations
Product innovations in the Canadian CT market are continuously enhancing diagnostic precision and patient care. Recent advancements include the development of ultra-low dose CT scanners that significantly reduce radiation exposure while maintaining diagnostic image quality, crucial for pediatric and frequent screening applications. AI-powered CT interpretation tools are emerging, capable of automating anomaly detection, streamlining workflow, and improving the accuracy of diagnoses in areas like lung nodule detection and stroke identification. Furthermore, the integration of spectral or dual-energy CT technology allows for improved material differentiation, enabling better characterization of tissues and pathologies, thereby expanding the diagnostic utility beyond conventional imaging. These innovations, coupled with faster gantry rotation speeds and wider detector coverage, lead to reduced scan times, improving patient comfort and throughput.
Propelling Factors for Computed Tomography Market in Canada Growth
Several key factors are propelling the growth of the Canadian computed tomography market. The rising prevalence of chronic diseases, including cancer, cardiovascular disorders, and neurological conditions, creates a persistent demand for accurate and early diagnostic tools like CT scans. Technological advancements, such as AI integration for image analysis, dual-energy CT for enhanced tissue characterization, and iterative reconstruction techniques for dose reduction, are driving the adoption of newer, more capable CT systems. Furthermore, government initiatives focused on modernizing healthcare infrastructure and improving access to advanced diagnostic services across Canada are significant growth catalysts. An aging population, inherently more susceptible to age-related ailments, further amplifies the need for diagnostic imaging, including CT.
Obstacles in the Computed Tomography Market in Canada Market
Despite robust growth, the Canadian CT scanner market faces several obstacles. High acquisition costs for advanced CT equipment, particularly high slice CT systems, can be a significant barrier for smaller healthcare facilities and diagnostic centers. Stringent regulatory approval processes, although essential for safety, can sometimes delay the market entry of innovative technologies. The increasing demand for advanced imaging is also accompanied by concerns regarding radiation exposure, necessitating continuous efforts in dose reduction technologies and stricter protocols. Furthermore, a shortage of trained radiology professionals and CT technicians across Canada can impact the efficient utilization of existing and new CT equipment, thereby limiting market expansion. Supply chain disruptions for critical components and spare parts can also lead to extended downtime for installed CT scanners.
Future Opportunities in Computed Tomography Market in Canada
Emerging opportunities in the Canadian CT market are abundant. The increasing focus on preventative healthcare and early disease detection presents a significant opportunity for the wider adoption of CT screening programs, especially for conditions like lung cancer. The expansion of AI in medical imaging offers immense potential for developing advanced diagnostic and analytical tools that can revolutionize CT interpretation and workflow efficiency. The growing demand for minimally invasive procedures in cardiology and oncology will further drive the need for high-resolution CT imaging. Furthermore, the development of portable and point-of-care CT solutions could open up new markets in remote areas and specialized clinical settings.
Major Players in the Computed Tomography Market in Canada Ecosystem
- Morita Corporation
- GE Healthcare
- Koning Corporation
- Dentsply Sirona
- Siemens Healthineers AG
- Canon Medical Systems Corporation (Toshiba Corporation)
- Neusoft Medical Systems Co Ltd
- Carestream Health
- Koninklijke Philips NV
- Planmeca Group (Planmed OY)
- Samsung Electronics Co Ltd (Samsung Medison)
Key Developments in Computed Tomography Market in Canada Industry
- July 2021: Canada Diagnostic Centers (CDC), an Alberta-based provider of medical imaging services, received investment from Novacap, one of the country's top private equity firms, indicating strong investor confidence in the Canadian diagnostic imaging sector and potential for expansion.
- April 2021: Siemens Healthineers acquired Varian, a move aimed at strengthening its market position and concentrating on the imaging segment to expand its product portfolio and bring innovation to the Canadian market, particularly in integrated cancer care solutions.
Strategic Computed Tomography Market in Canada Market Forecast
The Canadian computed tomography market is poised for substantial growth, driven by a confluence of increasing healthcare needs and technological advancements. The ongoing rise in chronic diseases, particularly cancer and cardiovascular conditions, will continue to fuel demand for CT diagnostics. Innovations in AI-powered imaging analysis and dose reduction technologies are expected to make CT scans safer, more efficient, and more accessible. The strategic investments and acquisitions observed in recent years, such as Siemens Healthineers' acquisition of Varian, signal a market trend towards consolidation and integrated solutions, promising enhanced product offerings and greater market penetration. The Canadian government's commitment to improving healthcare infrastructure will further support the adoption of advanced CT equipment. Consequently, the market is projected to witness a healthy CAGR of XX% during the forecast period, making it a dynamic and rewarding sector for stakeholders.
Computed Tomography Market in Canada Segmentation
-
1. Type
- 1.1. Low Slice
- 1.2. Medium Slice
- 1.3. High Slice
-
2. Application
- 2.1. Oncology
- 2.2. Neurology
- 2.3. Cardiovascular
- 2.4. Musculoskeletal
- 2.5. Other Applications
-
3. End User
- 3.1. Hospitals
- 3.2. Diagnostic Centers
- 3.3. Other End Users
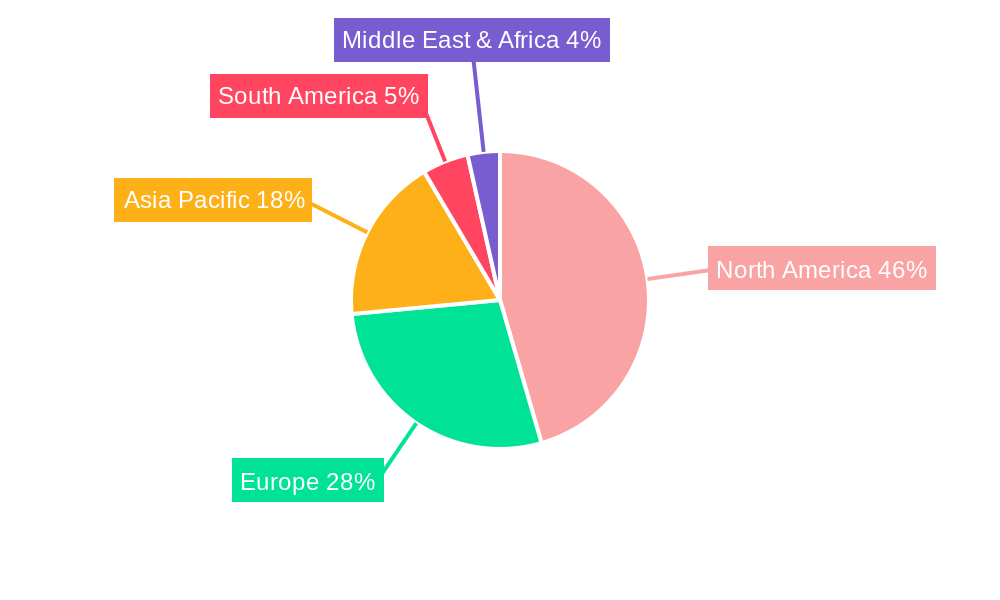
Computed Tomography Market in Canada Segmentation By Geography
-
1. North America
- 1.1. United States
- 1.2. Canada
- 1.3. Mexico
-
2. South America
- 2.1. Brazil
- 2.2. Argentina
- 2.3. Rest of South America
-
3. Europe
- 3.1. United Kingdom
- 3.2. Germany
- 3.3. France
- 3.4. Italy
- 3.5. Spain
- 3.6. Russia
- 3.7. Benelux
- 3.8. Nordics
- 3.9. Rest of Europe
-
4. Middle East & Africa
- 4.1. Turkey
- 4.2. Israel
- 4.3. GCC
- 4.4. North Africa
- 4.5. South Africa
- 4.6. Rest of Middle East & Africa
-
5. Asia Pacific
- 5.1. China
- 5.2. India
- 5.3. Japan
- 5.4. South Korea
- 5.5. ASEAN
- 5.6. Oceania
- 5.7. Rest of Asia Pacific
Computed Tomography Market in Canada REPORT HIGHLIGHTS
| Aspects | Details |
|---|---|
| Study Period | 2019-2033 |
| Base Year | 2024 |
| Estimated Year | 2025 |
| Forecast Period | 2025-2033 |
| Historical Period | 2019-2024 |
| Growth Rate | CAGR of 6.61% from 2019-2033 |
| Segmentation |
|
Table of Contents
- 1. Introduction
- 1.1. Research Scope
- 1.2. Market Segmentation
- 1.3. Research Methodology
- 1.4. Definitions and Assumptions
- 2. Executive Summary
- 2.1. Introduction
- 3. Market Dynamics
- 3.1. Introduction
- 3.2. Market Drivers
- 3.2.1. Increasing Prevalence of Chronic Diseases; Rising Geriatric Population; Increasing Technological Advancements
- 3.3. Market Restrains
- 3.3.1. Lack Of Proper Reimbursement And Stringent Regulatory Approval Procedures; High Cost of Equipment
- 3.4. Market Trends
- 3.4.1. High Slice Segment is Expected to Hold a Significant Market Share Over the Forecast Period
- 4. Market Factor Analysis
- 4.1. Porters Five Forces
- 4.2. Supply/Value Chain
- 4.3. PESTEL analysis
- 4.4. Market Entropy
- 4.5. Patent/Trademark Analysis
- 5. Global Computed Tomography Market in Canada Analysis, Insights and Forecast, 2019-2031
- 5.1. Market Analysis, Insights and Forecast - by Type
- 5.1.1. Low Slice
- 5.1.2. Medium Slice
- 5.1.3. High Slice
- 5.2. Market Analysis, Insights and Forecast - by Application
- 5.2.1. Oncology
- 5.2.2. Neurology
- 5.2.3. Cardiovascular
- 5.2.4. Musculoskeletal
- 5.2.5. Other Applications
- 5.3. Market Analysis, Insights and Forecast - by End User
- 5.3.1. Hospitals
- 5.3.2. Diagnostic Centers
- 5.3.3. Other End Users
- 5.4. Market Analysis, Insights and Forecast - by Region
- 5.4.1. North America
- 5.4.2. South America
- 5.4.3. Europe
- 5.4.4. Middle East & Africa
- 5.4.5. Asia Pacific
- 5.1. Market Analysis, Insights and Forecast - by Type
- 6. North America Computed Tomography Market in Canada Analysis, Insights and Forecast, 2019-2031
- 6.1. Market Analysis, Insights and Forecast - by Type
- 6.1.1. Low Slice
- 6.1.2. Medium Slice
- 6.1.3. High Slice
- 6.2. Market Analysis, Insights and Forecast - by Application
- 6.2.1. Oncology
- 6.2.2. Neurology
- 6.2.3. Cardiovascular
- 6.2.4. Musculoskeletal
- 6.2.5. Other Applications
- 6.3. Market Analysis, Insights and Forecast - by End User
- 6.3.1. Hospitals
- 6.3.2. Diagnostic Centers
- 6.3.3. Other End Users
- 6.1. Market Analysis, Insights and Forecast - by Type
- 7. South America Computed Tomography Market in Canada Analysis, Insights and Forecast, 2019-2031
- 7.1. Market Analysis, Insights and Forecast - by Type
- 7.1.1. Low Slice
- 7.1.2. Medium Slice
- 7.1.3. High Slice
- 7.2. Market Analysis, Insights and Forecast - by Application
- 7.2.1. Oncology
- 7.2.2. Neurology
- 7.2.3. Cardiovascular
- 7.2.4. Musculoskeletal
- 7.2.5. Other Applications
- 7.3. Market Analysis, Insights and Forecast - by End User
- 7.3.1. Hospitals
- 7.3.2. Diagnostic Centers
- 7.3.3. Other End Users
- 7.1. Market Analysis, Insights and Forecast - by Type
- 8. Europe Computed Tomography Market in Canada Analysis, Insights and Forecast, 2019-2031
- 8.1. Market Analysis, Insights and Forecast - by Type
- 8.1.1. Low Slice
- 8.1.2. Medium Slice
- 8.1.3. High Slice
- 8.2. Market Analysis, Insights and Forecast - by Application
- 8.2.1. Oncology
- 8.2.2. Neurology
- 8.2.3. Cardiovascular
- 8.2.4. Musculoskeletal
- 8.2.5. Other Applications
- 8.3. Market Analysis, Insights and Forecast - by End User
- 8.3.1. Hospitals
- 8.3.2. Diagnostic Centers
- 8.3.3. Other End Users
- 8.1. Market Analysis, Insights and Forecast - by Type
- 9. Middle East & Africa Computed Tomography Market in Canada Analysis, Insights and Forecast, 2019-2031
- 9.1. Market Analysis, Insights and Forecast - by Type
- 9.1.1. Low Slice
- 9.1.2. Medium Slice
- 9.1.3. High Slice
- 9.2. Market Analysis, Insights and Forecast - by Application
- 9.2.1. Oncology
- 9.2.2. Neurology
- 9.2.3. Cardiovascular
- 9.2.4. Musculoskeletal
- 9.2.5. Other Applications
- 9.3. Market Analysis, Insights and Forecast - by End User
- 9.3.1. Hospitals
- 9.3.2. Diagnostic Centers
- 9.3.3. Other End Users
- 9.1. Market Analysis, Insights and Forecast - by Type
- 10. Asia Pacific Computed Tomography Market in Canada Analysis, Insights and Forecast, 2019-2031
- 10.1. Market Analysis, Insights and Forecast - by Type
- 10.1.1. Low Slice
- 10.1.2. Medium Slice
- 10.1.3. High Slice
- 10.2. Market Analysis, Insights and Forecast - by Application
- 10.2.1. Oncology
- 10.2.2. Neurology
- 10.2.3. Cardiovascular
- 10.2.4. Musculoskeletal
- 10.2.5. Other Applications
- 10.3. Market Analysis, Insights and Forecast - by End User
- 10.3.1. Hospitals
- 10.3.2. Diagnostic Centers
- 10.3.3. Other End Users
- 10.1. Market Analysis, Insights and Forecast - by Type
- 11. Eastern Canada Computed Tomography Market in Canada Analysis, Insights and Forecast, 2019-2031
- 12. Western Canada Computed Tomography Market in Canada Analysis, Insights and Forecast, 2019-2031
- 13. Central Canada Computed Tomography Market in Canada Analysis, Insights and Forecast, 2019-2031
- 14. Competitive Analysis
- 14.1. Global Market Share Analysis 2024
- 14.2. Company Profiles
- 14.2.1 Morita Corporation
- 14.2.1.1. Overview
- 14.2.1.2. Products
- 14.2.1.3. SWOT Analysis
- 14.2.1.4. Recent Developments
- 14.2.1.5. Financials (Based on Availability)
- 14.2.2 GE Healthcare
- 14.2.2.1. Overview
- 14.2.2.2. Products
- 14.2.2.3. SWOT Analysis
- 14.2.2.4. Recent Developments
- 14.2.2.5. Financials (Based on Availability)
- 14.2.3 Koning corporation
- 14.2.3.1. Overview
- 14.2.3.2. Products
- 14.2.3.3. SWOT Analysis
- 14.2.3.4. Recent Developments
- 14.2.3.5. Financials (Based on Availability)
- 14.2.4 Dentsply Sirona
- 14.2.4.1. Overview
- 14.2.4.2. Products
- 14.2.4.3. SWOT Analysis
- 14.2.4.4. Recent Developments
- 14.2.4.5. Financials (Based on Availability)
- 14.2.5 Siemens Healthineers AG
- 14.2.5.1. Overview
- 14.2.5.2. Products
- 14.2.5.3. SWOT Analysis
- 14.2.5.4. Recent Developments
- 14.2.5.5. Financials (Based on Availability)
- 14.2.6 Canon Medical Systems Corporation (Toshiba Corporation)
- 14.2.6.1. Overview
- 14.2.6.2. Products
- 14.2.6.3. SWOT Analysis
- 14.2.6.4. Recent Developments
- 14.2.6.5. Financials (Based on Availability)
- 14.2.7 Neusoft Medical Systems Co Ltd
- 14.2.7.1. Overview
- 14.2.7.2. Products
- 14.2.7.3. SWOT Analysis
- 14.2.7.4. Recent Developments
- 14.2.7.5. Financials (Based on Availability)
- 14.2.8 Carestream Health
- 14.2.8.1. Overview
- 14.2.8.2. Products
- 14.2.8.3. SWOT Analysis
- 14.2.8.4. Recent Developments
- 14.2.8.5. Financials (Based on Availability)
- 14.2.9 Koninklijke Philips NV
- 14.2.9.1. Overview
- 14.2.9.2. Products
- 14.2.9.3. SWOT Analysis
- 14.2.9.4. Recent Developments
- 14.2.9.5. Financials (Based on Availability)
- 14.2.10 Planmeca Group (Planmed OY)
- 14.2.10.1. Overview
- 14.2.10.2. Products
- 14.2.10.3. SWOT Analysis
- 14.2.10.4. Recent Developments
- 14.2.10.5. Financials (Based on Availability)
- 14.2.11 Samsung Electronics Co Ltd (Samsung Medison)
- 14.2.11.1. Overview
- 14.2.11.2. Products
- 14.2.11.3. SWOT Analysis
- 14.2.11.4. Recent Developments
- 14.2.11.5. Financials (Based on Availability)
- 14.2.1 Morita Corporation
List of Figures
- Figure 1: Global Computed Tomography Market in Canada Revenue Breakdown (Million, %) by Region 2024 & 2032
- Figure 2: Canada Computed Tomography Market in Canada Revenue (Million), by Country 2024 & 2032
- Figure 3: Canada Computed Tomography Market in Canada Revenue Share (%), by Country 2024 & 2032
- Figure 4: North America Computed Tomography Market in Canada Revenue (Million), by Type 2024 & 2032
- Figure 5: North America Computed Tomography Market in Canada Revenue Share (%), by Type 2024 & 2032
- Figure 6: North America Computed Tomography Market in Canada Revenue (Million), by Application 2024 & 2032
- Figure 7: North America Computed Tomography Market in Canada Revenue Share (%), by Application 2024 & 2032
- Figure 8: North America Computed Tomography Market in Canada Revenue (Million), by End User 2024 & 2032
- Figure 9: North America Computed Tomography Market in Canada Revenue Share (%), by End User 2024 & 2032
- Figure 10: North America Computed Tomography Market in Canada Revenue (Million), by Country 2024 & 2032
- Figure 11: North America Computed Tomography Market in Canada Revenue Share (%), by Country 2024 & 2032
- Figure 12: South America Computed Tomography Market in Canada Revenue (Million), by Type 2024 & 2032
- Figure 13: South America Computed Tomography Market in Canada Revenue Share (%), by Type 2024 & 2032
- Figure 14: South America Computed Tomography Market in Canada Revenue (Million), by Application 2024 & 2032
- Figure 15: South America Computed Tomography Market in Canada Revenue Share (%), by Application 2024 & 2032
- Figure 16: South America Computed Tomography Market in Canada Revenue (Million), by End User 2024 & 2032
- Figure 17: South America Computed Tomography Market in Canada Revenue Share (%), by End User 2024 & 2032
- Figure 18: South America Computed Tomography Market in Canada Revenue (Million), by Country 2024 & 2032
- Figure 19: South America Computed Tomography Market in Canada Revenue Share (%), by Country 2024 & 2032
- Figure 20: Europe Computed Tomography Market in Canada Revenue (Million), by Type 2024 & 2032
- Figure 21: Europe Computed Tomography Market in Canada Revenue Share (%), by Type 2024 & 2032
- Figure 22: Europe Computed Tomography Market in Canada Revenue (Million), by Application 2024 & 2032
- Figure 23: Europe Computed Tomography Market in Canada Revenue Share (%), by Application 2024 & 2032
- Figure 24: Europe Computed Tomography Market in Canada Revenue (Million), by End User 2024 & 2032
- Figure 25: Europe Computed Tomography Market in Canada Revenue Share (%), by End User 2024 & 2032
- Figure 26: Europe Computed Tomography Market in Canada Revenue (Million), by Country 2024 & 2032
- Figure 27: Europe Computed Tomography Market in Canada Revenue Share (%), by Country 2024 & 2032
- Figure 28: Middle East & Africa Computed Tomography Market in Canada Revenue (Million), by Type 2024 & 2032
- Figure 29: Middle East & Africa Computed Tomography Market in Canada Revenue Share (%), by Type 2024 & 2032
- Figure 30: Middle East & Africa Computed Tomography Market in Canada Revenue (Million), by Application 2024 & 2032
- Figure 31: Middle East & Africa Computed Tomography Market in Canada Revenue Share (%), by Application 2024 & 2032
- Figure 32: Middle East & Africa Computed Tomography Market in Canada Revenue (Million), by End User 2024 & 2032
- Figure 33: Middle East & Africa Computed Tomography Market in Canada Revenue Share (%), by End User 2024 & 2032
- Figure 34: Middle East & Africa Computed Tomography Market in Canada Revenue (Million), by Country 2024 & 2032
- Figure 35: Middle East & Africa Computed Tomography Market in Canada Revenue Share (%), by Country 2024 & 2032
- Figure 36: Asia Pacific Computed Tomography Market in Canada Revenue (Million), by Type 2024 & 2032
- Figure 37: Asia Pacific Computed Tomography Market in Canada Revenue Share (%), by Type 2024 & 2032
- Figure 38: Asia Pacific Computed Tomography Market in Canada Revenue (Million), by Application 2024 & 2032
- Figure 39: Asia Pacific Computed Tomography Market in Canada Revenue Share (%), by Application 2024 & 2032
- Figure 40: Asia Pacific Computed Tomography Market in Canada Revenue (Million), by End User 2024 & 2032
- Figure 41: Asia Pacific Computed Tomography Market in Canada Revenue Share (%), by End User 2024 & 2032
- Figure 42: Asia Pacific Computed Tomography Market in Canada Revenue (Million), by Country 2024 & 2032
- Figure 43: Asia Pacific Computed Tomography Market in Canada Revenue Share (%), by Country 2024 & 2032
List of Tables
- Table 1: Global Computed Tomography Market in Canada Revenue Million Forecast, by Region 2019 & 2032
- Table 2: Global Computed Tomography Market in Canada Revenue Million Forecast, by Type 2019 & 2032
- Table 3: Global Computed Tomography Market in Canada Revenue Million Forecast, by Application 2019 & 2032
- Table 4: Global Computed Tomography Market in Canada Revenue Million Forecast, by End User 2019 & 2032
- Table 5: Global Computed Tomography Market in Canada Revenue Million Forecast, by Region 2019 & 2032
- Table 6: Global Computed Tomography Market in Canada Revenue Million Forecast, by Country 2019 & 2032
- Table 7: Eastern Canada Computed Tomography Market in Canada Revenue (Million) Forecast, by Application 2019 & 2032
- Table 8: Western Canada Computed Tomography Market in Canada Revenue (Million) Forecast, by Application 2019 & 2032
- Table 9: Central Canada Computed Tomography Market in Canada Revenue (Million) Forecast, by Application 2019 & 2032
- Table 10: Global Computed Tomography Market in Canada Revenue Million Forecast, by Type 2019 & 2032
- Table 11: Global Computed Tomography Market in Canada Revenue Million Forecast, by Application 2019 & 2032
- Table 12: Global Computed Tomography Market in Canada Revenue Million Forecast, by End User 2019 & 2032
- Table 13: Global Computed Tomography Market in Canada Revenue Million Forecast, by Country 2019 & 2032
- Table 14: United States Computed Tomography Market in Canada Revenue (Million) Forecast, by Application 2019 & 2032
- Table 15: Canada Computed Tomography Market in Canada Revenue (Million) Forecast, by Application 2019 & 2032
- Table 16: Mexico Computed Tomography Market in Canada Revenue (Million) Forecast, by Application 2019 & 2032
- Table 17: Global Computed Tomography Market in Canada Revenue Million Forecast, by Type 2019 & 2032
- Table 18: Global Computed Tomography Market in Canada Revenue Million Forecast, by Application 2019 & 2032
- Table 19: Global Computed Tomography Market in Canada Revenue Million Forecast, by End User 2019 & 2032
- Table 20: Global Computed Tomography Market in Canada Revenue Million Forecast, by Country 2019 & 2032
- Table 21: Brazil Computed Tomography Market in Canada Revenue (Million) Forecast, by Application 2019 & 2032
- Table 22: Argentina Computed Tomography Market in Canada Revenue (Million) Forecast, by Application 2019 & 2032
- Table 23: Rest of South America Computed Tomography Market in Canada Revenue (Million) Forecast, by Application 2019 & 2032
- Table 24: Global Computed Tomography Market in Canada Revenue Million Forecast, by Type 2019 & 2032
- Table 25: Global Computed Tomography Market in Canada Revenue Million Forecast, by Application 2019 & 2032
- Table 26: Global Computed Tomography Market in Canada Revenue Million Forecast, by End User 2019 & 2032
- Table 27: Global Computed Tomography Market in Canada Revenue Million Forecast, by Country 2019 & 2032
- Table 28: United Kingdom Computed Tomography Market in Canada Revenue (Million) Forecast, by Application 2019 & 2032
- Table 29: Germany Computed Tomography Market in Canada Revenue (Million) Forecast, by Application 2019 & 2032
- Table 30: France Computed Tomography Market in Canada Revenue (Million) Forecast, by Application 2019 & 2032
- Table 31: Italy Computed Tomography Market in Canada Revenue (Million) Forecast, by Application 2019 & 2032
- Table 32: Spain Computed Tomography Market in Canada Revenue (Million) Forecast, by Application 2019 & 2032
- Table 33: Russia Computed Tomography Market in Canada Revenue (Million) Forecast, by Application 2019 & 2032
- Table 34: Benelux Computed Tomography Market in Canada Revenue (Million) Forecast, by Application 2019 & 2032
- Table 35: Nordics Computed Tomography Market in Canada Revenue (Million) Forecast, by Application 2019 & 2032
- Table 36: Rest of Europe Computed Tomography Market in Canada Revenue (Million) Forecast, by Application 2019 & 2032
- Table 37: Global Computed Tomography Market in Canada Revenue Million Forecast, by Type 2019 & 2032
- Table 38: Global Computed Tomography Market in Canada Revenue Million Forecast, by Application 2019 & 2032
- Table 39: Global Computed Tomography Market in Canada Revenue Million Forecast, by End User 2019 & 2032
- Table 40: Global Computed Tomography Market in Canada Revenue Million Forecast, by Country 2019 & 2032
- Table 41: Turkey Computed Tomography Market in Canada Revenue (Million) Forecast, by Application 2019 & 2032
- Table 42: Israel Computed Tomography Market in Canada Revenue (Million) Forecast, by Application 2019 & 2032
- Table 43: GCC Computed Tomography Market in Canada Revenue (Million) Forecast, by Application 2019 & 2032
- Table 44: North Africa Computed Tomography Market in Canada Revenue (Million) Forecast, by Application 2019 & 2032
- Table 45: South Africa Computed Tomography Market in Canada Revenue (Million) Forecast, by Application 2019 & 2032
- Table 46: Rest of Middle East & Africa Computed Tomography Market in Canada Revenue (Million) Forecast, by Application 2019 & 2032
- Table 47: Global Computed Tomography Market in Canada Revenue Million Forecast, by Type 2019 & 2032
- Table 48: Global Computed Tomography Market in Canada Revenue Million Forecast, by Application 2019 & 2032
- Table 49: Global Computed Tomography Market in Canada Revenue Million Forecast, by End User 2019 & 2032
- Table 50: Global Computed Tomography Market in Canada Revenue Million Forecast, by Country 2019 & 2032
- Table 51: China Computed Tomography Market in Canada Revenue (Million) Forecast, by Application 2019 & 2032
- Table 52: India Computed Tomography Market in Canada Revenue (Million) Forecast, by Application 2019 & 2032
- Table 53: Japan Computed Tomography Market in Canada Revenue (Million) Forecast, by Application 2019 & 2032
- Table 54: South Korea Computed Tomography Market in Canada Revenue (Million) Forecast, by Application 2019 & 2032
- Table 55: ASEAN Computed Tomography Market in Canada Revenue (Million) Forecast, by Application 2019 & 2032
- Table 56: Oceania Computed Tomography Market in Canada Revenue (Million) Forecast, by Application 2019 & 2032
- Table 57: Rest of Asia Pacific Computed Tomography Market in Canada Revenue (Million) Forecast, by Application 2019 & 2032
Frequently Asked Questions
1. What is the projected Compound Annual Growth Rate (CAGR) of the Computed Tomography Market in Canada?
The projected CAGR is approximately 6.61%.
2. Which companies are prominent players in the Computed Tomography Market in Canada?
Key companies in the market include Morita Corporation, GE Healthcare, Koning corporation, Dentsply Sirona, Siemens Healthineers AG, Canon Medical Systems Corporation (Toshiba Corporation), Neusoft Medical Systems Co Ltd, Carestream Health, Koninklijke Philips NV, Planmeca Group (Planmed OY), Samsung Electronics Co Ltd (Samsung Medison).
3. What are the main segments of the Computed Tomography Market in Canada?
The market segments include Type, Application, End User.
4. Can you provide details about the market size?
The market size is estimated to be USD 330.24 Million as of 2022.
5. What are some drivers contributing to market growth?
Increasing Prevalence of Chronic Diseases; Rising Geriatric Population; Increasing Technological Advancements.
6. What are the notable trends driving market growth?
High Slice Segment is Expected to Hold a Significant Market Share Over the Forecast Period.
7. Are there any restraints impacting market growth?
Lack Of Proper Reimbursement And Stringent Regulatory Approval Procedures; High Cost of Equipment.
8. Can you provide examples of recent developments in the market?
In July 2021, Canada Diagnostic Centers (CDC), an Alberta-based provider of medical imaging services and one of Canada's most well-known businesses of its sort, received investment from Novacap, one of the country's top private equity firms.
9. What pricing options are available for accessing the report?
Pricing options include single-user, multi-user, and enterprise licenses priced at USD 3800, USD 4500, and USD 5800 respectively.
10. Is the market size provided in terms of value or volume?
The market size is provided in terms of value, measured in Million.
11. Are there any specific market keywords associated with the report?
Yes, the market keyword associated with the report is "Computed Tomography Market in Canada," which aids in identifying and referencing the specific market segment covered.
12. How do I determine which pricing option suits my needs best?
The pricing options vary based on user requirements and access needs. Individual users may opt for single-user licenses, while businesses requiring broader access may choose multi-user or enterprise licenses for cost-effective access to the report.
13. Are there any additional resources or data provided in the Computed Tomography Market in Canada report?
While the report offers comprehensive insights, it's advisable to review the specific contents or supplementary materials provided to ascertain if additional resources or data are available.
14. How can I stay updated on further developments or reports in the Computed Tomography Market in Canada?
To stay informed about further developments, trends, and reports in the Computed Tomography Market in Canada, consider subscribing to industry newsletters, following relevant companies and organizations, or regularly checking reputable industry news sources and publications.
Methodology
Step 1 - Identification of Relevant Samples Size from Population Database


Step 2 - Approaches for Defining Global Market Size (Value, Volume* & Price*)

Note*: In applicable scenarios
Step 3 - Data Sources
Primary Research
- Web Analytics
- Survey Reports
- Research Institute
- Latest Research Reports
- Opinion Leaders
Secondary Research
- Annual Reports
- White Paper
- Latest Press Release
- Industry Association
- Paid Database
- Investor Presentations

Step 4 - Data Triangulation
Involves using different sources of information in order to increase the validity of a study
These sources are likely to be stakeholders in a program - participants, other researchers, program staff, other community members, and so on.
Then we put all data in single framework & apply various statistical tools to find out the dynamic on the market.
During the analysis stage, feedback from the stakeholder groups would be compared to determine areas of agreement as well as areas of divergence
