

Key Insights
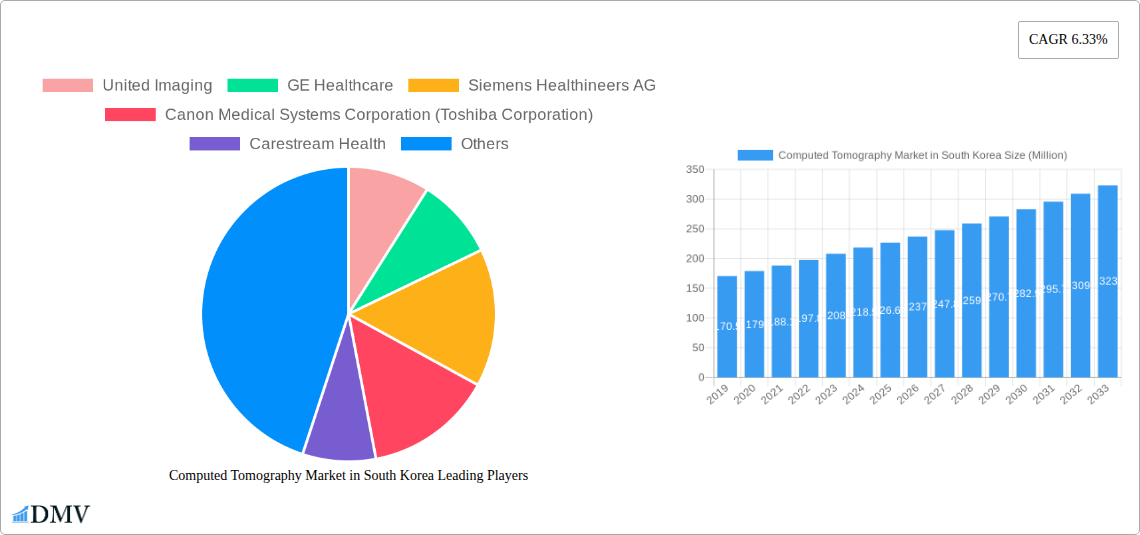
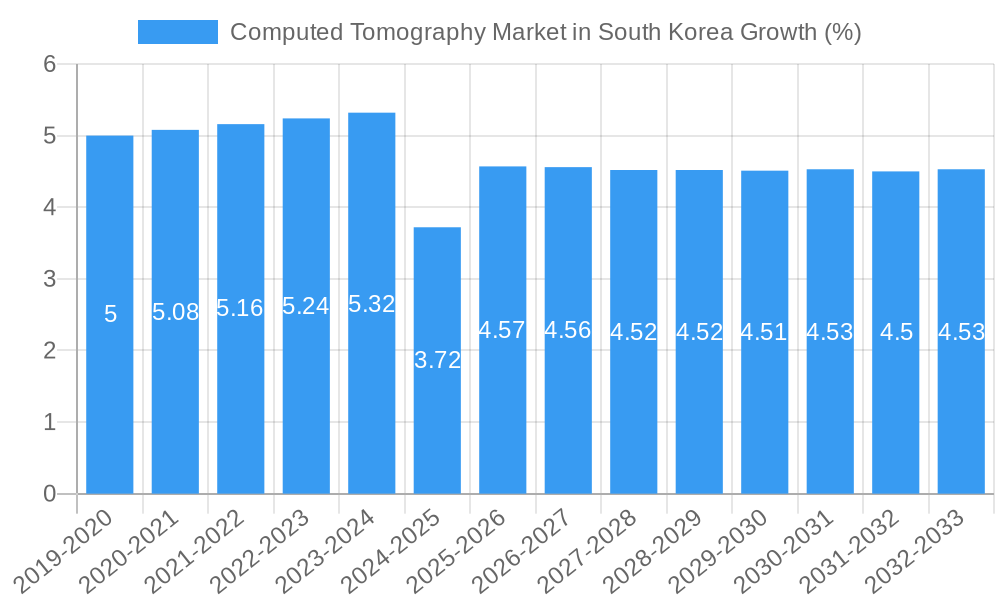
The Computed Tomography (CT) market in South Korea is poised for robust growth, projected to reach approximately USD 226.64 million by 2025, expanding at a Compound Annual Growth Rate (CAGR) of 6.33% through 2033. This expansion is primarily driven by the increasing prevalence of chronic diseases such as cardiovascular conditions and cancer, which necessitate advanced diagnostic imaging solutions. Furthermore, South Korea's commitment to healthcare infrastructure development, coupled with a rapidly aging population, fuels the demand for sophisticated CT scanners capable of providing detailed anatomical insights. The market is experiencing a notable shift towards low-slice CT systems for routine diagnostics due to their cost-effectiveness and reduced radiation exposure, while high-slice CT scanners are gaining traction for complex oncological and neurological imaging, offering superior resolution and faster scan times. Technological advancements, including the integration of artificial intelligence for image analysis and interpretation, and the development of photon-counting CT technology, are further propelling market adoption and enhancing diagnostic accuracy.
The competitive landscape in the South Korean CT market is characterized by the presence of leading global players such as Siemens Healthineers AG, GE Healthcare, and Koninklijke Philips NV, alongside emerging domestic manufacturers. These companies are actively investing in research and development to introduce innovative CT solutions tailored to the specific needs of South Korean healthcare providers. Diagnostic centers and hospitals remain the primary end-users, with hospitals accounting for the largest share due to their comprehensive diagnostic and treatment capabilities. The increasing demand for early disease detection and the growing awareness among the populace regarding the benefits of advanced medical imaging are significant growth enablers. While the market benefits from strong government support for healthcare innovation, potential challenges include the high initial investment costs associated with advanced CT systems and the stringent regulatory approvals required for new medical devices. However, the overall outlook for the South Korean CT market remains highly positive, with significant opportunities for further expansion driven by continuous technological advancements and evolving healthcare demands.
Computed Tomography Market in South Korea Market Composition & Trends
The South Korean Computed Tomography (CT) market is characterized by a dynamic interplay of established global players and emerging domestic innovations, driven by a robust healthcare infrastructure and a growing demand for advanced diagnostic imaging. Market concentration is moderately high, with key companies like GE Healthcare, Siemens Healthineers AG, and Koninklijke Philips NV holding significant shares. However, the landscape is continuously shaped by the introduction of new technologies and competitive pricing strategies. Innovation catalysts include the increasing prevalence of chronic diseases, the government's focus on improving healthcare accessibility, and the rapid adoption of artificial intelligence (AI) in medical imaging. Regulatory frameworks, while ensuring patient safety and efficacy, can also influence market entry and product development timelines. Substitute products, such as MRI and Ultrasound, offer alternative diagnostic pathways but often lack the speed and multi-planar imaging capabilities of CT. End-user profiles are diverse, with hospitals forming the largest segment, followed by specialized diagnostic centers. Merger and acquisition (M&A) activities, though less frequent than in some other mature markets, play a role in consolidating market presence and expanding product portfolios. M&A deal values are projected to remain a significant factor in market evolution, with strategic acquisitions aiming to enhance technological capabilities and market reach.
- Market Concentration: Moderate, with a few dominant global players and increasing competition from regional innovators.
- Innovation Catalysts: Aging population, rising chronic disease burden, government initiatives for healthcare modernization, AI integration in diagnostics.
- Regulatory Landscape: Stringent but supportive of technological advancements, ensuring safety and efficacy standards.
- Substitute Products: MRI, Ultrasound, X-ray imaging offering alternative diagnostic modalities.
- End-User Profiles: Primarily Hospitals, followed by Diagnostic Centers and specialized medical facilities.
- M&A Activities: Strategic acquisitions and partnerships focused on technology acquisition and market expansion.
Computed Tomography Market in South Korea Industry Evolution
The Computed Tomography market in South Korea has witnessed a significant evolution, transforming from a nascent sector to a sophisticated landscape driven by technological prowess and an unwavering commitment to public health. The historical period between 2019 and 2024 saw steady growth, fueled by an aging demographic and an increasing awareness of the importance of early disease detection. During this period, the adoption of CT scanners, especially those with improved resolution and faster scanning times, became more widespread across various healthcare settings. The base year, 2025, represents a pivotal point where the market is expected to further accelerate its growth trajectory, influenced by ongoing advancements in detector technology, radiation dose reduction techniques, and the integration of artificial intelligence.
Technological advancements have been the bedrock of this evolution. From conventional CT scanners, the market has progressively moved towards dual-energy CT, spectral CT, and photon-counting CT, offering unprecedented levels of detail and diagnostic capabilities. These innovations are not merely incremental; they represent a paradigm shift in how diseases are diagnosed and managed. For instance, spectral CT enables material decomposition, differentiating between various tissues and contrast agents with remarkable precision, aiding in the diagnosis of complex conditions like cardiovascular diseases and neurological disorders. AI integration is another transformative force, enhancing image reconstruction, automating workflow, and providing decision support for radiologists. This not only improves diagnostic accuracy but also significantly reduces scan times and radiation exposure, addressing key concerns for both clinicians and patients.
Shifting consumer demands, primarily driven by a heightened focus on personalized medicine and minimally invasive procedures, have also played a crucial role. Patients and healthcare providers alike are seeking imaging solutions that offer superior diagnostic information with minimal patient discomfort and risk. This has spurred the demand for CT systems that can accurately visualize intricate anatomical structures and pathological findings, enabling more precise treatment planning. The increasing prevalence of chronic diseases such as cancer, cardiovascular ailments, and neurodegenerative disorders further propels the demand for advanced CT diagnostics. For example, the oncology segment relies heavily on CT for staging, treatment monitoring, and follow-up imaging, making it a critical application area. Similarly, neurology and cardiovascular applications are witnessing substantial growth due to the increasing incidence of strokes, heart conditions, and other central nervous system disorders. The projected growth rate for the CT market in South Korea is expected to remain robust throughout the forecast period of 2025–2033, bolstered by continuous technological innovation, supportive government policies, and a persistent need for advanced diagnostic tools in a healthcare system committed to excellence. The adoption metrics for advanced CT technologies are set to rise, indicating a market that is not only expanding in volume but also in the sophistication of its imaging capabilities.
Leading Regions, Countries, or Segments in Computed Tomography Market in South Korea
The South Korean Computed Tomography market exhibits a strong concentration of activity and demand within its major urban centers, with Seoul and its surrounding metropolitan areas acting as the primary hubs for advanced diagnostic imaging. This dominance is attributed to several converging factors, including the highest density of leading hospitals and diagnostic centers, a concentration of skilled medical professionals, and greater accessibility to cutting-edge medical technologies. The Seoul Metropolitan Area, in particular, accounts for a significant portion of CT scanner installations and utilization, driven by a population that is both larger and more inclined towards seeking advanced medical care.
Within the Type segmentation, the High Slice CT scanners are experiencing the most significant growth and dominance. This trend is propelled by their superior resolution, faster scanning speeds, and enhanced multi-planar reconstruction capabilities, which are crucial for detailed examinations in oncology, neurology, and cardiovascular applications. While Low Slice and Medium Slice CT scanners continue to be relevant for general radiography and certain routine examinations, the demand for high-end diagnostic performance increasingly favors High Slice systems. The ability of these scanners to generate detailed 3D images and reduce scanning time is a critical factor in their widespread adoption in advanced clinical settings.
In terms of Application, Oncology stands out as the leading segment. The persistent and growing burden of cancer in South Korea, coupled with advancements in cancer treatment and the need for accurate staging and monitoring, fuels a substantial demand for CT imaging. Oncologists rely heavily on CT for tumor detection, characterization, and assessment of treatment response. Following closely is Neurology, driven by the increasing incidence of stroke, Alzheimer's disease, and other neurological disorders, especially in an aging population. CT's ability to quickly identify acute conditions like hemorrhages and ischemic strokes makes it an indispensable tool in emergency neurological care. Cardiovascular applications are also a significant driver, with CT playing a vital role in the diagnosis of coronary artery disease, peripheral artery disease, and congenital heart defects.
The End User segment is clearly dominated by Hospitals. As the primary providers of comprehensive healthcare services, hospitals invest heavily in advanced diagnostic imaging equipment to cater to a wide range of patient needs, from emergency care to complex surgical interventions. The continuous need for diagnostic accuracy and efficiency in acute and chronic care settings solidifies the hospital segment's leading position. Diagnostic Centers, while important, often complement hospital services or cater to specific outpatient needs.
- Dominant Geographical Area: Seoul Metropolitan Area, due to its concentration of advanced healthcare facilities and population density.
- Leading Segment by Type: High Slice CT scanners, driven by demand for superior resolution and speed in complex diagnostics.
- Key Drivers: Need for detailed imaging in oncology and neurology, advancements in detector technology.
- Leading Segment by Application: Oncology, due to high cancer prevalence and the critical role of CT in diagnosis and treatment monitoring.
- Key Drivers: Early disease detection initiatives, advancements in cancer therapy requiring precise imaging.
- Leading Segment by End User: Hospitals, owing to their comprehensive service offerings and substantial investment in advanced medical equipment.
- Key Drivers: In-patient care requirements, emergency services, complex surgical support.
Computed Tomography Market in South Korea Product Innovations
The South Korean Computed Tomography market is a hotbed of product innovation, with manufacturers consistently pushing the boundaries of imaging technology. Recent advancements focus on enhanced image quality with reduced radiation dose, faster scanning times, and the integration of artificial intelligence for improved workflow and diagnostic accuracy. Innovations like spectral imaging capabilities, which allow for material differentiation, are revolutionizing the detection and characterization of diseases in oncology and cardiovascular imaging. Furthermore, advancements in detector technology and reconstruction algorithms are leading to ultra-high resolution CT scans, enabling clinicians to visualize finer details of anatomy and pathology, thereby improving diagnostic confidence and enabling more precise treatment planning. The trend towards miniaturization and improved patient comfort is also evident in the design of newer CT systems.
Propelling Factors for Computed Tomography Market in South Korea Growth
Several key factors are propelling the growth of the Computed Tomography market in South Korea. Firstly, the nation's rapidly aging population significantly increases the demand for diagnostic imaging due to a higher prevalence of age-related diseases like cancer, cardiovascular conditions, and neurological disorders. Secondly, the South Korean government's commitment to advancing its healthcare sector through increased investment in medical infrastructure and the adoption of cutting-edge technologies acts as a strong catalyst. Thirdly, continuous technological innovations, including the development of low-dose CT scanners, AI-powered image analysis, and spectral imaging, are enhancing diagnostic accuracy and efficiency, making CT a more attractive and indispensable tool. Finally, a growing emphasis on early disease detection and preventive healthcare measures further fuels the demand for advanced diagnostic modalities like CT.
Obstacles in the Computed Tomography Market in South Korea Market
Despite robust growth, the South Korean Computed Tomography market faces certain obstacles. The high cost of advanced CT systems and their associated maintenance can be a significant barrier, particularly for smaller healthcare facilities or those in less affluent regions. Stringent regulatory approvals for new technologies, while crucial for patient safety, can sometimes slow down the pace of market penetration for innovative products. Additionally, the limited availability of highly skilled radiographers and technicians trained to operate and interpret sophisticated CT scans can pose a challenge in certain areas. Furthermore, the competitive landscape, marked by the presence of major global players and evolving domestic manufacturers, leads to pricing pressures, impacting profit margins for some companies.
Future Opportunities in Computed Tomography Market in South Korea
The future of the Computed Tomography market in South Korea is brimming with opportunities. The continued integration of artificial intelligence into CT workflows presents a significant avenue for growth, promising enhanced image analysis, automated diagnostics, and improved operational efficiency. The development of more portable and cost-effective CT solutions could expand access to advanced imaging in underserved areas and smaller clinics. The growing trend towards personalized medicine will drive demand for advanced CT technologies capable of providing precise anatomical and functional information for tailored treatment plans. Furthermore, the expanding applications of CT in areas like interventional radiology and image-guided surgery offer substantial growth potential as these fields continue to mature in the South Korean healthcare landscape.
Major Players in the Computed Tomography Market in South Korea Ecosystem
- United Imaging
- GE Healthcare
- Siemens Healthineers AG
- Canon Medical Systems Corporation
- Carestream Health
- Koninklijke Philips NV
- Planmeca Group
Key Developments in Computed Tomography Market in South Korea Industry
- March 2022: Philips Korea unveiled Greeting CT Premium at the 37th Korea International Medical & Hospital Equipment Show (KIMES2022) held at Samsung-dong COEX in Seoul, highlighting advancements in patient care and imaging technology.
- January 2022: Bayer AG's MEDRAD Centargo, a computed tomography device, received approval from South Korea's Ministry of Food and Drug Safety, signaling market entry for new imaging solutions.
Strategic Computed Tomography Market in South Korea Market Forecast
The strategic outlook for the South Korean Computed Tomography market forecast for 2025–2033 is highly positive, with a projected Compound Annual Growth Rate (CAGR) of XX%. This growth will be primarily driven by the increasing adoption of high-slice and advanced spectral CT technologies, fueled by a rising incidence of chronic diseases, particularly cancer and cardiovascular ailments, and an aging population. The consistent integration of AI in CT systems will further enhance diagnostic accuracy and operational efficiency, making these advanced modalities indispensable for healthcare providers. Government initiatives aimed at modernizing healthcare infrastructure and promoting early disease detection will also contribute significantly. The market is poised for expansion as manufacturers continue to invest in research and development, introducing innovative solutions that address the evolving needs of the healthcare industry and patient population in South Korea.
Computed Tomography Market in South Korea Segmentation
-
1. Type
- 1.1. Low Slice
- 1.2. Medium Slice
- 1.3. High Slice
-
2. Application
- 2.1. Oncology
- 2.2. Neurology
- 2.3. Cardiovascular
- 2.4. Musculoskeletal
- 2.5. Other Applications
-
3. End User
- 3.1. Hospitals
- 3.2. Diagnostic Centers
- 3.3. Other End Users
Computed Tomography Market in South Korea Segmentation By Geography
-
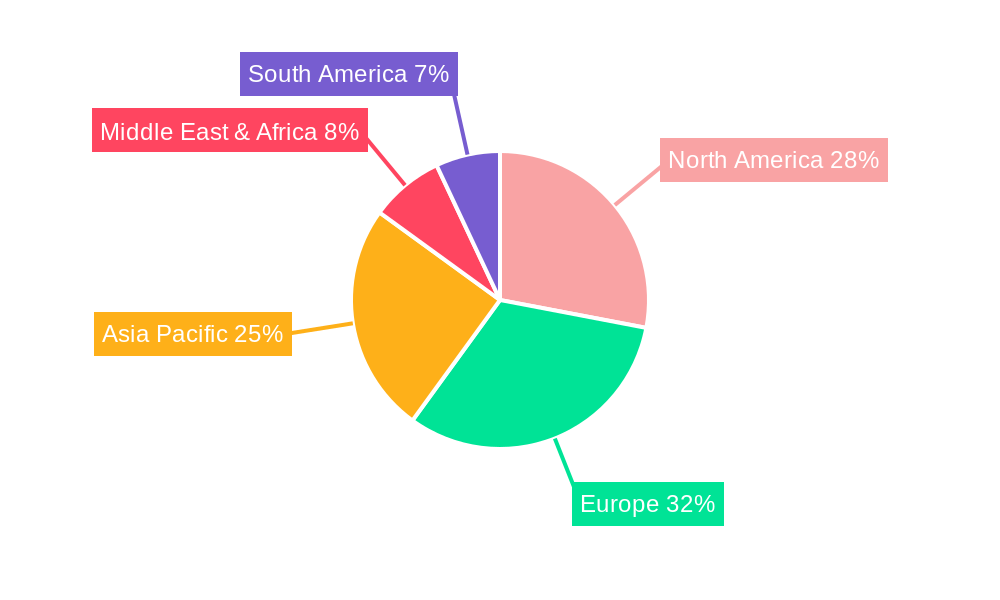
1. North America
- 1.1. United States
- 1.2. Canada
- 1.3. Mexico
-
2. South America
- 2.1. Brazil
- 2.2. Argentina
- 2.3. Rest of South America
-
3. Europe
- 3.1. United Kingdom
- 3.2. Germany
- 3.3. France
- 3.4. Italy
- 3.5. Spain
- 3.6. Russia
- 3.7. Benelux
- 3.8. Nordics
- 3.9. Rest of Europe
-
4. Middle East & Africa
- 4.1. Turkey
- 4.2. Israel
- 4.3. GCC
- 4.4. North Africa
- 4.5. South Africa
- 4.6. Rest of Middle East & Africa
-
5. Asia Pacific
- 5.1. China
- 5.2. India
- 5.3. Japan
- 5.4. South Korea
- 5.5. ASEAN
- 5.6. Oceania
- 5.7. Rest of Asia Pacific
Computed Tomography Market in South Korea REPORT HIGHLIGHTS
| Aspects | Details |
|---|---|
| Study Period | 2019-2033 |
| Base Year | 2024 |
| Estimated Year | 2025 |
| Forecast Period | 2025-2033 |
| Historical Period | 2019-2024 |
| Growth Rate | CAGR of 6.33% from 2019-2033 |
| Segmentation |
|
Table of Contents
- 1. Introduction
- 1.1. Research Scope
- 1.2. Market Segmentation
- 1.3. Research Methodology
- 1.4. Definitions and Assumptions
- 2. Executive Summary
- 2.1. Introduction
- 3. Market Dynamics
- 3.1. Introduction
- 3.2. Market Drivers
- 3.2.1. Increasing Prevalence of Chronic Diseases; Rising Geriatric Population; Increasing Technological Advancements
- 3.3. Market Restrains
- 3.3.1. Lack Of Proper Reimbursement And Stringent Regulatory Approval Procedures; High Cost of Equipment
- 3.4. Market Trends
- 3.4.1. Oncology Segment is Expected to Hold a Significant Market Share Over the Forecast Period
- 4. Market Factor Analysis
- 4.1. Porters Five Forces
- 4.2. Supply/Value Chain
- 4.3. PESTEL analysis
- 4.4. Market Entropy
- 4.5. Patent/Trademark Analysis
- 5. Global Computed Tomography Market in South Korea Analysis, Insights and Forecast, 2019-2031
- 5.1. Market Analysis, Insights and Forecast - by Type
- 5.1.1. Low Slice
- 5.1.2. Medium Slice
- 5.1.3. High Slice
- 5.2. Market Analysis, Insights and Forecast - by Application
- 5.2.1. Oncology
- 5.2.2. Neurology
- 5.2.3. Cardiovascular
- 5.2.4. Musculoskeletal
- 5.2.5. Other Applications
- 5.3. Market Analysis, Insights and Forecast - by End User
- 5.3.1. Hospitals
- 5.3.2. Diagnostic Centers
- 5.3.3. Other End Users
- 5.4. Market Analysis, Insights and Forecast - by Region
- 5.4.1. North America
- 5.4.2. South America
- 5.4.3. Europe
- 5.4.4. Middle East & Africa
- 5.4.5. Asia Pacific
- 5.1. Market Analysis, Insights and Forecast - by Type
- 6. North America Computed Tomography Market in South Korea Analysis, Insights and Forecast, 2019-2031
- 6.1. Market Analysis, Insights and Forecast - by Type
- 6.1.1. Low Slice
- 6.1.2. Medium Slice
- 6.1.3. High Slice
- 6.2. Market Analysis, Insights and Forecast - by Application
- 6.2.1. Oncology
- 6.2.2. Neurology
- 6.2.3. Cardiovascular
- 6.2.4. Musculoskeletal
- 6.2.5. Other Applications
- 6.3. Market Analysis, Insights and Forecast - by End User
- 6.3.1. Hospitals
- 6.3.2. Diagnostic Centers
- 6.3.3. Other End Users
- 6.1. Market Analysis, Insights and Forecast - by Type
- 7. South America Computed Tomography Market in South Korea Analysis, Insights and Forecast, 2019-2031
- 7.1. Market Analysis, Insights and Forecast - by Type
- 7.1.1. Low Slice
- 7.1.2. Medium Slice
- 7.1.3. High Slice
- 7.2. Market Analysis, Insights and Forecast - by Application
- 7.2.1. Oncology
- 7.2.2. Neurology
- 7.2.3. Cardiovascular
- 7.2.4. Musculoskeletal
- 7.2.5. Other Applications
- 7.3. Market Analysis, Insights and Forecast - by End User
- 7.3.1. Hospitals
- 7.3.2. Diagnostic Centers
- 7.3.3. Other End Users
- 7.1. Market Analysis, Insights and Forecast - by Type
- 8. Europe Computed Tomography Market in South Korea Analysis, Insights and Forecast, 2019-2031
- 8.1. Market Analysis, Insights and Forecast - by Type
- 8.1.1. Low Slice
- 8.1.2. Medium Slice
- 8.1.3. High Slice
- 8.2. Market Analysis, Insights and Forecast - by Application
- 8.2.1. Oncology
- 8.2.2. Neurology
- 8.2.3. Cardiovascular
- 8.2.4. Musculoskeletal
- 8.2.5. Other Applications
- 8.3. Market Analysis, Insights and Forecast - by End User
- 8.3.1. Hospitals
- 8.3.2. Diagnostic Centers
- 8.3.3. Other End Users
- 8.1. Market Analysis, Insights and Forecast - by Type
- 9. Middle East & Africa Computed Tomography Market in South Korea Analysis, Insights and Forecast, 2019-2031
- 9.1. Market Analysis, Insights and Forecast - by Type
- 9.1.1. Low Slice
- 9.1.2. Medium Slice
- 9.1.3. High Slice
- 9.2. Market Analysis, Insights and Forecast - by Application
- 9.2.1. Oncology
- 9.2.2. Neurology
- 9.2.3. Cardiovascular
- 9.2.4. Musculoskeletal
- 9.2.5. Other Applications
- 9.3. Market Analysis, Insights and Forecast - by End User
- 9.3.1. Hospitals
- 9.3.2. Diagnostic Centers
- 9.3.3. Other End Users
- 9.1. Market Analysis, Insights and Forecast - by Type
- 10. Asia Pacific Computed Tomography Market in South Korea Analysis, Insights and Forecast, 2019-2031
- 10.1. Market Analysis, Insights and Forecast - by Type
- 10.1.1. Low Slice
- 10.1.2. Medium Slice
- 10.1.3. High Slice
- 10.2. Market Analysis, Insights and Forecast - by Application
- 10.2.1. Oncology
- 10.2.2. Neurology
- 10.2.3. Cardiovascular
- 10.2.4. Musculoskeletal
- 10.2.5. Other Applications
- 10.3. Market Analysis, Insights and Forecast - by End User
- 10.3.1. Hospitals
- 10.3.2. Diagnostic Centers
- 10.3.3. Other End Users
- 10.1. Market Analysis, Insights and Forecast - by Type
- 11. Competitive Analysis
- 11.1. Global Market Share Analysis 2024
- 11.2. Company Profiles
- 11.2.1 United Imaging
- 11.2.1.1. Overview
- 11.2.1.2. Products
- 11.2.1.3. SWOT Analysis
- 11.2.1.4. Recent Developments
- 11.2.1.5. Financials (Based on Availability)
- 11.2.2 GE Healthcare
- 11.2.2.1. Overview
- 11.2.2.2. Products
- 11.2.2.3. SWOT Analysis
- 11.2.2.4. Recent Developments
- 11.2.2.5. Financials (Based on Availability)
- 11.2.3 Siemens Healthineers AG
- 11.2.3.1. Overview
- 11.2.3.2. Products
- 11.2.3.3. SWOT Analysis
- 11.2.3.4. Recent Developments
- 11.2.3.5. Financials (Based on Availability)
- 11.2.4 Canon Medical Systems Corporation (Toshiba Corporation)
- 11.2.4.1. Overview
- 11.2.4.2. Products
- 11.2.4.3. SWOT Analysis
- 11.2.4.4. Recent Developments
- 11.2.4.5. Financials (Based on Availability)
- 11.2.5 Carestream Health
- 11.2.5.1. Overview
- 11.2.5.2. Products
- 11.2.5.3. SWOT Analysis
- 11.2.5.4. Recent Developments
- 11.2.5.5. Financials (Based on Availability)
- 11.2.6 Koninklijke Philips NV
- 11.2.6.1. Overview
- 11.2.6.2. Products
- 11.2.6.3. SWOT Analysis
- 11.2.6.4. Recent Developments
- 11.2.6.5. Financials (Based on Availability)
- 11.2.7 Planmeca Group (Planmed OY)
- 11.2.7.1. Overview
- 11.2.7.2. Products
- 11.2.7.3. SWOT Analysis
- 11.2.7.4. Recent Developments
- 11.2.7.5. Financials (Based on Availability)
- 11.2.1 United Imaging
List of Figures
- Figure 1: Global Computed Tomography Market in South Korea Revenue Breakdown (Million, %) by Region 2024 & 2032
- Figure 2: South Korea Computed Tomography Market in South Korea Revenue (Million), by Country 2024 & 2032
- Figure 3: South Korea Computed Tomography Market in South Korea Revenue Share (%), by Country 2024 & 2032
- Figure 4: North America Computed Tomography Market in South Korea Revenue (Million), by Type 2024 & 2032
- Figure 5: North America Computed Tomography Market in South Korea Revenue Share (%), by Type 2024 & 2032
- Figure 6: North America Computed Tomography Market in South Korea Revenue (Million), by Application 2024 & 2032
- Figure 7: North America Computed Tomography Market in South Korea Revenue Share (%), by Application 2024 & 2032
- Figure 8: North America Computed Tomography Market in South Korea Revenue (Million), by End User 2024 & 2032
- Figure 9: North America Computed Tomography Market in South Korea Revenue Share (%), by End User 2024 & 2032
- Figure 10: North America Computed Tomography Market in South Korea Revenue (Million), by Country 2024 & 2032
- Figure 11: North America Computed Tomography Market in South Korea Revenue Share (%), by Country 2024 & 2032
- Figure 12: South America Computed Tomography Market in South Korea Revenue (Million), by Type 2024 & 2032
- Figure 13: South America Computed Tomography Market in South Korea Revenue Share (%), by Type 2024 & 2032
- Figure 14: South America Computed Tomography Market in South Korea Revenue (Million), by Application 2024 & 2032
- Figure 15: South America Computed Tomography Market in South Korea Revenue Share (%), by Application 2024 & 2032
- Figure 16: South America Computed Tomography Market in South Korea Revenue (Million), by End User 2024 & 2032
- Figure 17: South America Computed Tomography Market in South Korea Revenue Share (%), by End User 2024 & 2032
- Figure 18: South America Computed Tomography Market in South Korea Revenue (Million), by Country 2024 & 2032
- Figure 19: South America Computed Tomography Market in South Korea Revenue Share (%), by Country 2024 & 2032
- Figure 20: Europe Computed Tomography Market in South Korea Revenue (Million), by Type 2024 & 2032
- Figure 21: Europe Computed Tomography Market in South Korea Revenue Share (%), by Type 2024 & 2032
- Figure 22: Europe Computed Tomography Market in South Korea Revenue (Million), by Application 2024 & 2032
- Figure 23: Europe Computed Tomography Market in South Korea Revenue Share (%), by Application 2024 & 2032
- Figure 24: Europe Computed Tomography Market in South Korea Revenue (Million), by End User 2024 & 2032
- Figure 25: Europe Computed Tomography Market in South Korea Revenue Share (%), by End User 2024 & 2032
- Figure 26: Europe Computed Tomography Market in South Korea Revenue (Million), by Country 2024 & 2032
- Figure 27: Europe Computed Tomography Market in South Korea Revenue Share (%), by Country 2024 & 2032
- Figure 28: Middle East & Africa Computed Tomography Market in South Korea Revenue (Million), by Type 2024 & 2032
- Figure 29: Middle East & Africa Computed Tomography Market in South Korea Revenue Share (%), by Type 2024 & 2032
- Figure 30: Middle East & Africa Computed Tomography Market in South Korea Revenue (Million), by Application 2024 & 2032
- Figure 31: Middle East & Africa Computed Tomography Market in South Korea Revenue Share (%), by Application 2024 & 2032
- Figure 32: Middle East & Africa Computed Tomography Market in South Korea Revenue (Million), by End User 2024 & 2032
- Figure 33: Middle East & Africa Computed Tomography Market in South Korea Revenue Share (%), by End User 2024 & 2032
- Figure 34: Middle East & Africa Computed Tomography Market in South Korea Revenue (Million), by Country 2024 & 2032
- Figure 35: Middle East & Africa Computed Tomography Market in South Korea Revenue Share (%), by Country 2024 & 2032
- Figure 36: Asia Pacific Computed Tomography Market in South Korea Revenue (Million), by Type 2024 & 2032
- Figure 37: Asia Pacific Computed Tomography Market in South Korea Revenue Share (%), by Type 2024 & 2032
- Figure 38: Asia Pacific Computed Tomography Market in South Korea Revenue (Million), by Application 2024 & 2032
- Figure 39: Asia Pacific Computed Tomography Market in South Korea Revenue Share (%), by Application 2024 & 2032
- Figure 40: Asia Pacific Computed Tomography Market in South Korea Revenue (Million), by End User 2024 & 2032
- Figure 41: Asia Pacific Computed Tomography Market in South Korea Revenue Share (%), by End User 2024 & 2032
- Figure 42: Asia Pacific Computed Tomography Market in South Korea Revenue (Million), by Country 2024 & 2032
- Figure 43: Asia Pacific Computed Tomography Market in South Korea Revenue Share (%), by Country 2024 & 2032
List of Tables
- Table 1: Global Computed Tomography Market in South Korea Revenue Million Forecast, by Region 2019 & 2032
- Table 2: Global Computed Tomography Market in South Korea Revenue Million Forecast, by Type 2019 & 2032
- Table 3: Global Computed Tomography Market in South Korea Revenue Million Forecast, by Application 2019 & 2032
- Table 4: Global Computed Tomography Market in South Korea Revenue Million Forecast, by End User 2019 & 2032
- Table 5: Global Computed Tomography Market in South Korea Revenue Million Forecast, by Region 2019 & 2032
- Table 6: Global Computed Tomography Market in South Korea Revenue Million Forecast, by Country 2019 & 2032
- Table 7: Global Computed Tomography Market in South Korea Revenue Million Forecast, by Type 2019 & 2032
- Table 8: Global Computed Tomography Market in South Korea Revenue Million Forecast, by Application 2019 & 2032
- Table 9: Global Computed Tomography Market in South Korea Revenue Million Forecast, by End User 2019 & 2032
- Table 10: Global Computed Tomography Market in South Korea Revenue Million Forecast, by Country 2019 & 2032
- Table 11: United States Computed Tomography Market in South Korea Revenue (Million) Forecast, by Application 2019 & 2032
- Table 12: Canada Computed Tomography Market in South Korea Revenue (Million) Forecast, by Application 2019 & 2032
- Table 13: Mexico Computed Tomography Market in South Korea Revenue (Million) Forecast, by Application 2019 & 2032
- Table 14: Global Computed Tomography Market in South Korea Revenue Million Forecast, by Type 2019 & 2032
- Table 15: Global Computed Tomography Market in South Korea Revenue Million Forecast, by Application 2019 & 2032
- Table 16: Global Computed Tomography Market in South Korea Revenue Million Forecast, by End User 2019 & 2032
- Table 17: Global Computed Tomography Market in South Korea Revenue Million Forecast, by Country 2019 & 2032
- Table 18: Brazil Computed Tomography Market in South Korea Revenue (Million) Forecast, by Application 2019 & 2032
- Table 19: Argentina Computed Tomography Market in South Korea Revenue (Million) Forecast, by Application 2019 & 2032
- Table 20: Rest of South America Computed Tomography Market in South Korea Revenue (Million) Forecast, by Application 2019 & 2032
- Table 21: Global Computed Tomography Market in South Korea Revenue Million Forecast, by Type 2019 & 2032
- Table 22: Global Computed Tomography Market in South Korea Revenue Million Forecast, by Application 2019 & 2032
- Table 23: Global Computed Tomography Market in South Korea Revenue Million Forecast, by End User 2019 & 2032
- Table 24: Global Computed Tomography Market in South Korea Revenue Million Forecast, by Country 2019 & 2032
- Table 25: United Kingdom Computed Tomography Market in South Korea Revenue (Million) Forecast, by Application 2019 & 2032
- Table 26: Germany Computed Tomography Market in South Korea Revenue (Million) Forecast, by Application 2019 & 2032
- Table 27: France Computed Tomography Market in South Korea Revenue (Million) Forecast, by Application 2019 & 2032
- Table 28: Italy Computed Tomography Market in South Korea Revenue (Million) Forecast, by Application 2019 & 2032
- Table 29: Spain Computed Tomography Market in South Korea Revenue (Million) Forecast, by Application 2019 & 2032
- Table 30: Russia Computed Tomography Market in South Korea Revenue (Million) Forecast, by Application 2019 & 2032
- Table 31: Benelux Computed Tomography Market in South Korea Revenue (Million) Forecast, by Application 2019 & 2032
- Table 32: Nordics Computed Tomography Market in South Korea Revenue (Million) Forecast, by Application 2019 & 2032
- Table 33: Rest of Europe Computed Tomography Market in South Korea Revenue (Million) Forecast, by Application 2019 & 2032
- Table 34: Global Computed Tomography Market in South Korea Revenue Million Forecast, by Type 2019 & 2032
- Table 35: Global Computed Tomography Market in South Korea Revenue Million Forecast, by Application 2019 & 2032
- Table 36: Global Computed Tomography Market in South Korea Revenue Million Forecast, by End User 2019 & 2032
- Table 37: Global Computed Tomography Market in South Korea Revenue Million Forecast, by Country 2019 & 2032
- Table 38: Turkey Computed Tomography Market in South Korea Revenue (Million) Forecast, by Application 2019 & 2032
- Table 39: Israel Computed Tomography Market in South Korea Revenue (Million) Forecast, by Application 2019 & 2032
- Table 40: GCC Computed Tomography Market in South Korea Revenue (Million) Forecast, by Application 2019 & 2032
- Table 41: North Africa Computed Tomography Market in South Korea Revenue (Million) Forecast, by Application 2019 & 2032
- Table 42: South Africa Computed Tomography Market in South Korea Revenue (Million) Forecast, by Application 2019 & 2032
- Table 43: Rest of Middle East & Africa Computed Tomography Market in South Korea Revenue (Million) Forecast, by Application 2019 & 2032
- Table 44: Global Computed Tomography Market in South Korea Revenue Million Forecast, by Type 2019 & 2032
- Table 45: Global Computed Tomography Market in South Korea Revenue Million Forecast, by Application 2019 & 2032
- Table 46: Global Computed Tomography Market in South Korea Revenue Million Forecast, by End User 2019 & 2032
- Table 47: Global Computed Tomography Market in South Korea Revenue Million Forecast, by Country 2019 & 2032
- Table 48: China Computed Tomography Market in South Korea Revenue (Million) Forecast, by Application 2019 & 2032
- Table 49: India Computed Tomography Market in South Korea Revenue (Million) Forecast, by Application 2019 & 2032
- Table 50: Japan Computed Tomography Market in South Korea Revenue (Million) Forecast, by Application 2019 & 2032
- Table 51: South Korea Computed Tomography Market in South Korea Revenue (Million) Forecast, by Application 2019 & 2032
- Table 52: ASEAN Computed Tomography Market in South Korea Revenue (Million) Forecast, by Application 2019 & 2032
- Table 53: Oceania Computed Tomography Market in South Korea Revenue (Million) Forecast, by Application 2019 & 2032
- Table 54: Rest of Asia Pacific Computed Tomography Market in South Korea Revenue (Million) Forecast, by Application 2019 & 2032
Frequently Asked Questions
1. What is the projected Compound Annual Growth Rate (CAGR) of the Computed Tomography Market in South Korea?
The projected CAGR is approximately 6.33%.
2. Which companies are prominent players in the Computed Tomography Market in South Korea?
Key companies in the market include United Imaging, GE Healthcare, Siemens Healthineers AG, Canon Medical Systems Corporation (Toshiba Corporation), Carestream Health, Koninklijke Philips NV, Planmeca Group (Planmed OY).
3. What are the main segments of the Computed Tomography Market in South Korea?
The market segments include Type, Application, End User.
4. Can you provide details about the market size?
The market size is estimated to be USD 226.64 Million as of 2022.
5. What are some drivers contributing to market growth?
Increasing Prevalence of Chronic Diseases; Rising Geriatric Population; Increasing Technological Advancements.
6. What are the notable trends driving market growth?
Oncology Segment is Expected to Hold a Significant Market Share Over the Forecast Period.
7. Are there any restraints impacting market growth?
Lack Of Proper Reimbursement And Stringent Regulatory Approval Procedures; High Cost of Equipment.
8. Can you provide examples of recent developments in the market?
In March 2022, Philips Korea unveiled Greeting CT Premium at 37th Korea International Medical & Hospital Equipment Show (KIMES2022) held at Samsung-dong COEX in Seoul.
9. What pricing options are available for accessing the report?
Pricing options include single-user, multi-user, and enterprise licenses priced at USD 3800, USD 4500, and USD 5800 respectively.
10. Is the market size provided in terms of value or volume?
The market size is provided in terms of value, measured in Million.
11. Are there any specific market keywords associated with the report?
Yes, the market keyword associated with the report is "Computed Tomography Market in South Korea," which aids in identifying and referencing the specific market segment covered.
12. How do I determine which pricing option suits my needs best?
The pricing options vary based on user requirements and access needs. Individual users may opt for single-user licenses, while businesses requiring broader access may choose multi-user or enterprise licenses for cost-effective access to the report.
13. Are there any additional resources or data provided in the Computed Tomography Market in South Korea report?
While the report offers comprehensive insights, it's advisable to review the specific contents or supplementary materials provided to ascertain if additional resources or data are available.
14. How can I stay updated on further developments or reports in the Computed Tomography Market in South Korea?
To stay informed about further developments, trends, and reports in the Computed Tomography Market in South Korea, consider subscribing to industry newsletters, following relevant companies and organizations, or regularly checking reputable industry news sources and publications.
Methodology
Step 1 - Identification of Relevant Samples Size from Population Database


Step 2 - Approaches for Defining Global Market Size (Value, Volume* & Price*)

Note*: In applicable scenarios
Step 3 - Data Sources
Primary Research
- Web Analytics
- Survey Reports
- Research Institute
- Latest Research Reports
- Opinion Leaders
Secondary Research
- Annual Reports
- White Paper
- Latest Press Release
- Industry Association
- Paid Database
- Investor Presentations

Step 4 - Data Triangulation
Involves using different sources of information in order to increase the validity of a study
These sources are likely to be stakeholders in a program - participants, other researchers, program staff, other community members, and so on.
Then we put all data in single framework & apply various statistical tools to find out the dynamic on the market.
During the analysis stage, feedback from the stakeholder groups would be compared to determine areas of agreement as well as areas of divergence
