

Key Insights
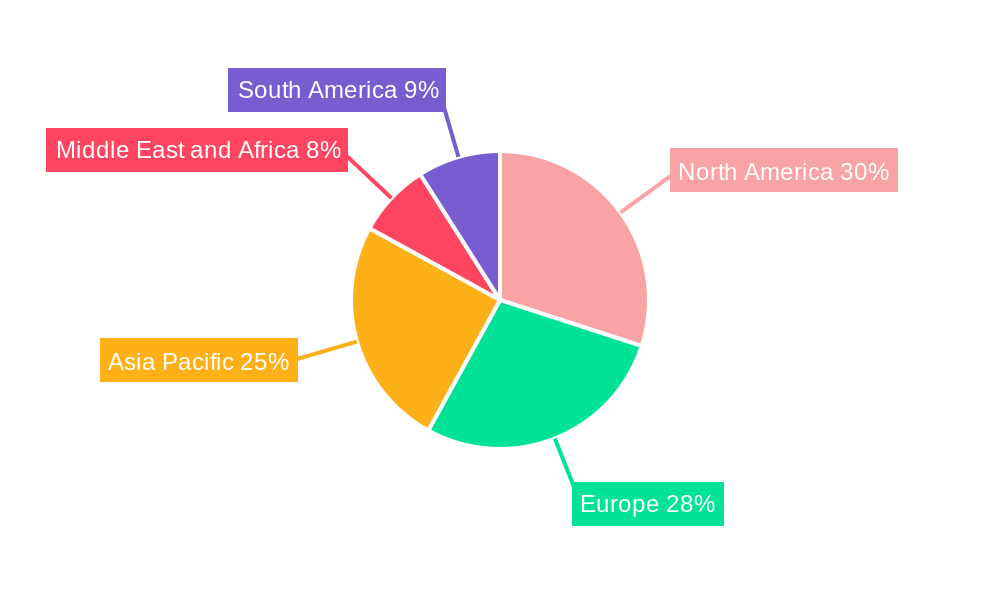
The global phototherapy market is projected to reach approximately 649.37 million by 2033, exhibiting a Compound Annual Growth Rate (CAGR) of 4.1% during the 2025-2033 forecast period. This expansion is driven by increased awareness of phototherapy's effectiveness in treating conditions like Seasonal Affective Disorder (SAD), depression, psoriasis, and eczema. Advancements in LED technology for targeted light delivery and growing demand for non-pharmacological treatments and home-use devices are key growth factors. The market value unit is million.
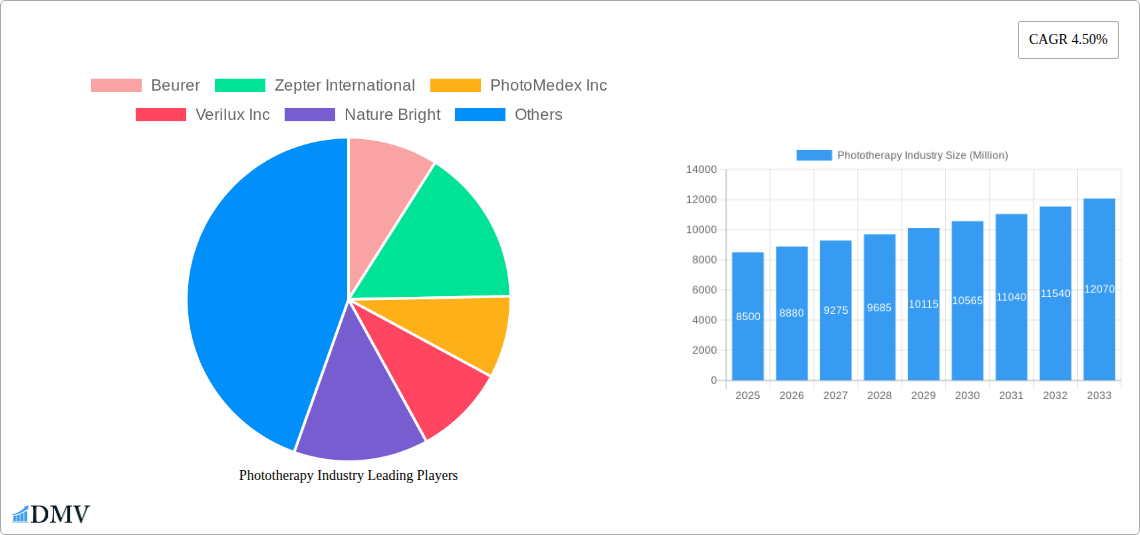
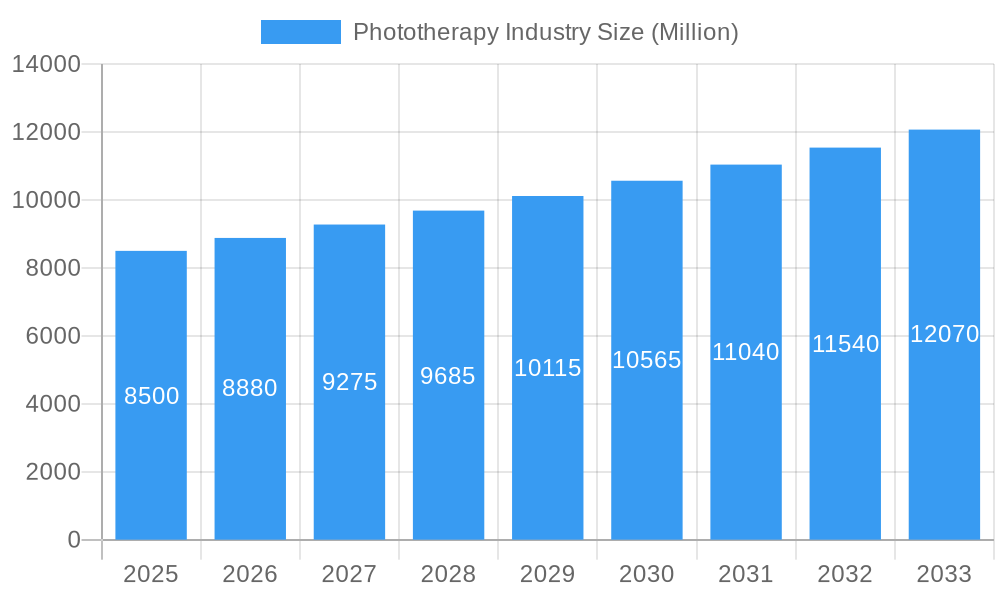
Phototherapy Industry Market Size (In Million)
The market is segmented by product type, including light boxes for mood regulation, floor and desk lamps, and specialized handheld devices. White light remains prevalent, while blue light is gaining traction for acne and sleep disorders, and red light is explored for wound healing and anti-aging. Phototherapy applications are expanding beyond neonatal jaundice and Vitamin D deficiency to mental health, skin disorders, and emerging areas. Leading companies like Koninklijke Philips N.V., Beurer, and Lumie are driving innovation through R&D, enhancing patient outcomes and market competitiveness.
Phototherapy Industry Company Market Share
Comprehensive Phototherapy Market Analysis 2024-2033: Trends, Innovations, and Forecasts
This in-depth report delves into the dynamic Phototherapy Industry, providing a detailed analysis of market size, growth drivers, challenges, and future opportunities. Covering the period from 2019 to 2033, with a base and estimated year of 2025, this report offers actionable insights for stakeholders seeking to capitalize on the burgeoning demand for light-based therapeutic solutions. Discover the competitive landscape, key player strategies, and emerging technological advancements shaping the future of phototherapy.
Phototherapy Industry Market Composition & Trends
The global Phototherapy Industry is characterized by a moderately concentrated market, driven by continuous innovation and an evolving regulatory landscape. Key players, including Beurer, Koninklijke Philips N.V., and Zepter International, are at the forefront of developing advanced light therapy devices. The market's expansion is further fueled by increasing awareness of phototherapy's efficacy in treating a wide range of conditions, from skin disorders to mental health issues and neonatal jaundice. Strategic mergers and acquisitions (M&A) are also shaping the industry, with deal values projected to increase significantly as companies seek to broaden their product portfolios and market reach. The demand for home care settings is rapidly growing, alongside continued reliance on dermatology clinics. Substitute products, while present, are increasingly being outperformed by the specialized and targeted benefits of modern phototherapy. The market share distribution is evolving, with companies focusing on specific light types like Blue Light and Red Light for targeted applications.
- Market Concentration: Moderately concentrated, with a few key players holding significant market share.
- Innovation Catalysts: Technological advancements, rising demand for non-invasive treatments, and increased research funding.
- Regulatory Landscapes: Evolving regulations for medical devices and therapeutic equipment, requiring strict adherence to safety and efficacy standards.
- Substitute Products: Limited efficacy compared to specialized phototherapy devices for specific conditions.
- End-User Profiles: Growing adoption in home care settings, alongside continued demand from dermatology clinics and other healthcare facilities.
- M&A Activities: Anticipated increase in strategic acquisitions and partnerships to consolidate market presence and acquire innovative technologies. M&A deal values are projected to exceed XX Million.
Phototherapy Industry Industry Evolution
The Phototherapy Industry has witnessed remarkable evolution over the historical period (2019–2024) and is projected for substantial growth through the forecast period (2025–2033). This trajectory is underpinned by a confluence of factors, including escalating research and development investments, a growing understanding of light's therapeutic potential, and an increasing prevalence of conditions treatable with phototherapy. Market growth rates are estimated to be robust, driven by technological breakthroughs in light delivery systems and device design. Consumer demand is shifting towards more accessible and user-friendly home-care solutions, evidenced by the rising popularity of dawn simulators and light therapy bulbs for mood enhancement and sleep regulation. Simultaneously, clinical applications are expanding, with advancements in targeted UVB therapy for skin disorders like psoriasis and vitiligo, as exemplified by the commercial launch of STRATA Skin Sciences, Inc.'s XTRAC Momentum 1.0 excimer laser system. The adoption of blue light therapy for neonatal jaundice is also a significant growth area, with innovations like Bilihome's smart, wearable device addressing critical healthcare needs. The overall market size is projected to reach XX Million by 2033, growing at a Compound Annual Growth Rate (CAGR) of approximately XX%. Key segments such as Light Boxes and Handheld Devices are expected to see significant expansion. The increasing integration of smart technologies and personalized treatment protocols will further accelerate market penetration and efficacy.
Leading Regions, Countries, or Segments in Phototherapy Industry
North America currently leads the global Phototherapy Industry, driven by a robust healthcare infrastructure, high disposable incomes, and a strong emphasis on technological innovation. The United States, in particular, is a dominant market, with a high adoption rate of advanced phototherapy devices across both clinical and home care settings. Factors contributing to this leadership include significant investment in R&D by key players like PhotoMedex Inc. and Verilux Inc., alongside favorable reimbursement policies for certain phototherapy treatments. The demand for light therapy for mental health disorders, such as Seasonal Affective Disorder (SAD), and skin disorders like psoriasis and eczema, is particularly high. Regulatory bodies like the U.S. Food and Drug Administration (FDA) play a crucial role in approving and overseeing these devices, ensuring their safety and efficacy.
- Product Type Dominance: Light Boxes are a leading product type due to their widespread use in treating various skin conditions and SAD. Their market share is estimated to be XX% of the total product segment. Dawn Simulators are also experiencing significant growth in the home care sector, with an estimated market share of XX%.
- Light Type Popularity: White Light remains a dominant light type for general well-being and SAD treatment, holding an estimated XX% market share. Blue Light is experiencing rapid growth, especially for neonatal jaundice and certain skin conditions, with an estimated XX% market share. Red Light therapy is gaining traction for its anti-inflammatory and skin rejuvenation properties, estimated at XX%.
- Application Drivers: Skin Disorders represent a significant application, contributing an estimated XX% to the market value, driven by conditions like psoriasis, eczema, and acne. Mental Health Disorders, particularly SAD, account for an estimated XX% of the market. Neonatal Jaundice is a critical application, with specialized devices seeing strong demand.
- End User Trends: Home Care Settings are emerging as a major growth segment, projected to account for XX% of the total end-user market by 2033, owing to the convenience and increasing affordability of devices. Dermatology Clinics remain a vital segment, contributing an estimated XX%.
- Investment Trends: Increased venture capital funding in phototherapy startups, focusing on wearable devices and AI-integrated treatment plans.
- Regulatory Support: Evolving FDA guidelines and European CE marking standards provide a framework for product development and market entry.
Phototherapy Industry Product Innovations
The Phototherapy Industry is witnessing a surge in product innovations focused on enhanced efficacy, user-friendliness, and targeted treatment. Companies are developing next-generation excimer laser systems, such as STRATA Skin Sciences' XTRAC Momentum 1.0, for precise UVB light delivery to treat inflammatory skin conditions like psoriasis and vitiligo in both adult and pediatric patients. Furthermore, there's a strong push towards smart, wearable devices for at-home care, exemplified by Bilihome's innovative solution for neonatal jaundice, which offers a more convenient and less intrusive treatment option. The integration of advanced LED technology, customizable treatment protocols, and connectivity features in devices like light boxes, hand-held devices, and light visors is transforming patient outcomes. These innovations aim to optimize light spectrum, intensity, and duration, leading to faster healing times and improved patient compliance, with a projected market impact of XX Million in innovative product sales.
Propelling Factors for Phototherapy Industry Growth
The Phototherapy Industry's growth is propelled by several key factors. Firstly, the increasing prevalence of skin disorders such as psoriasis, eczema, and acne, coupled with a growing demand for non-invasive and effective treatment options, fuels market expansion. Secondly, a heightened awareness of the benefits of light therapy for mental health disorders, particularly Seasonal Affective Disorder (SAD) and depression, is driving demand for dawn simulators and light boxes. Thirdly, technological advancements in LED technology and device miniaturization are leading to the development of more efficient, portable, and user-friendly phototherapy devices for home care settings. Finally, an aging global population and a rise in neonatal cases requiring jaundice treatment create sustained demand for specialized phototherapy solutions.
- Rising prevalence of skin and mental health disorders.
- Technological advancements in LED and device design.
- Growing consumer preference for home-based healthcare solutions.
- Increased clinical research validating phototherapy efficacy.
- Supportive regulatory environments for medical devices.
Obstacles in the Phototherapy Industry Market
Despite its promising growth, the Phototherapy Industry faces several obstacles. Stringent regulatory approval processes for medical devices can be time-consuming and costly, potentially delaying market entry for new products. High initial costs of some advanced phototherapy equipment can be a barrier for widespread adoption, particularly in resource-limited settings. Additionally, a lack of widespread public awareness regarding the full spectrum of phototherapy applications and benefits can hinder market penetration. The presence of counterfeit products and the inconsistent quality of non-regulated devices also pose a threat to legitimate market players. Supply chain disruptions and the availability of skilled personnel for device maintenance can also impact growth.
- Rigorous regulatory hurdles and approval times.
- High initial investment costs for advanced systems.
- Limited public awareness of diverse phototherapy applications.
- Competition from counterfeit and low-quality devices.
- Potential supply chain vulnerabilities and maintenance challenges.
Future Opportunities in Phototherapy Industry
The future of the Phototherapy Industry is ripe with opportunities. The burgeoning demand for personalized medicine is creating a niche for smart phototherapy devices that can tailor treatment protocols based on individual patient needs and responses. The expansion of home care settings, driven by convenience and cost-effectiveness, presents a significant avenue for growth. Emerging markets in Asia-Pacific and Latin America, with their growing healthcare expenditures and increasing adoption of medical technologies, offer substantial untapped potential. Furthermore, ongoing research into novel applications of phototherapy, such as wound healing, pain management, and even certain types of cancer treatment, could unlock entirely new market segments. The integration of artificial intelligence (AI) for treatment optimization and remote patient monitoring also represents a key future opportunity.
- Development of personalized and AI-driven phototherapy.
- Expansion of the home care segment and telehealth integration.
- Penetration into emerging markets with growing healthcare infrastructure.
- Exploration of novel therapeutic applications beyond current uses.
- Advancements in wearable and portable phototherapy devices.
Major Players in the Phototherapy Industry Ecosystem
Beurer Zepter International PhotoMedex Inc Verilux Inc Nature Bright Revian Inc Koninklijke Philips N V Northern Light Technologies Lumie BioPhotas Carex Lucimed SA
Key Developments in Phototherapy Industry Industry
- February 2022: STRATA Skin Sciences, Inc. announced the commercial launch of its next-generation excimer laser system, XTRAC Momentum 1.0. This system allows for the precise delivery of targeted UVB light therapy to specific treatment areas of the skin for both adult and pediatric patients suffering from inflammatory skin conditions such as psoriasis, atopic dermatitis, and vitiligo. This innovation is expected to significantly impact the treatment of chronic skin conditions.
- January 2022: Bilihome closed a new funding round led by Health Innovations and Oost NL. The funding is aimed at supporting the market launch of a smart, wearable light therapy device designed for jaundice, a condition that affects approximately 10% of all newborns, offering a more convenient and less intrusive treatment option.
Strategic Phototherapy Industry Market Forecast
The strategic forecast for the Phototherapy Industry anticipates continued robust growth, driven by an increasing global demand for effective, non-invasive therapeutic solutions. Key growth catalysts include ongoing technological advancements in light-emitting diode (LED) technology, leading to more efficient and targeted treatments, and the expanding adoption of home-use phototherapy devices, enhancing accessibility and patient convenience. The growing awareness and clinical validation of phototherapy for a wider range of applications, from skin disorders and mental health to neonatal care, will further fuel market expansion. Investment in research and development for novel applications and smart device integration will also play a crucial role, positioning the market for substantial gains in the coming years, with an estimated market size of XX Million by 2033.
Phototherapy Industry Segmentation
-
1. Product Type
- 1.1. Light Box
- 1.2. Floor and Desk Lamps
- 1.3. Light Visor
- 1.4. Dawn Simulator
- 1.5. Light Therapy Bulbs
- 1.6. Handheld Devices
-
2. Light Type
- 2.1. White Light
- 2.2. Blue Light
- 2.3. Red Light
- 2.4. Others (Green and Yellow Light)
-
3. Application
- 3.1. Vitamin D Deficiency
- 3.2. Mental Health Disorders
- 3.3. Skin Disorders
- 3.4. Neonatal Jaundice
-
4. End User
- 4.1. Dermatology Clinics
- 4.2. Home Care Settings
- 4.3. Others (Workplace, Salons, etc.)
Phototherapy Industry Segmentation By Geography
-
1. North America
- 1.1. United States
- 1.2. Canada
- 1.3. Mexico
-
2. Europe
- 2.1. Germany
- 2.2. United Kingdom
- 2.3. France
- 2.4. Italy
- 2.5. Spain
- 2.6. Rest of Europe
-
3. Asia Pacific
- 3.1. China
- 3.2. Japan
- 3.3. India
- 3.4. Australia
- 3.5. South Korea
- 3.6. Rest of Asia Pacific
-
4. Middle East and Africa
- 4.1. GCC
- 4.2. South Africa
- 4.3. Rest of Middle East and Africa
-
5. South America
- 5.1. Brazil
- 5.2. Argentina
- 5.3. Rest of South America
Phototherapy Industry Regional Market Share
Geographic Coverage of Phototherapy Industry
Phototherapy Industry REPORT HIGHLIGHTS
| Aspects | Details |
|---|---|
| Study Period | 2020-2034 |
| Base Year | 2025 |
| Estimated Year | 2026 |
| Forecast Period | 2026-2034 |
| Historical Period | 2020-2025 |
| Growth Rate | CAGR of 4.1% from 2020-2034 |
| Segmentation |
|
Table of Contents
- 1. Introduction
- 1.1. Research Scope
- 1.2. Market Segmentation
- 1.3. Research Objective
- 1.4. Definitions and Assumptions
- 2. Executive Summary
- 2.1. Market Snapshot
- 3. Market Dynamics
- 3.1. Market Drivers
- 3.2. Market Restrains
- 3.3. Market Trends
- 3.4. Market Opportunities
- 4. Market Factor Analysis
- 4.1. Porters Five Forces
- 4.1.1. Bargaining Power of Suppliers
- 4.1.2. Bargaining Power of Buyers
- 4.1.3. Threat of New Entrants
- 4.1.4. Threat of Substitutes
- 4.1.5. Competitive Rivalry
- 4.2. PESTEL analysis
- 4.3. BCG Analysis
- 4.3.1. Stars (High Growth, High Market Share)
- 4.3.2. Cash Cows (Low Growth, High Market Share)
- 4.3.3. Question Mark (High Growth, Low Market Share)
- 4.3.4. Dogs (Low Growth, Low Market Share)
- 4.4. Ansoff Matrix Analysis
- 4.5. Supply Chain Analysis
- 4.6. Regulatory Landscape
- 4.7. Current Market Potential and Opportunity Assessment (TAM–SAM–SOM Framework)
- 4.8. DMV Analyst Note
- 4.1. Porters Five Forces
- 5. Market Analysis, Insights and Forecast 2021-2033
- 5.1. Market Analysis, Insights and Forecast - by Product Type
- 5.1.1. Light Box
- 5.1.2. Floor and Desk Lamps
- 5.1.3. Light Visor
- 5.1.4. Dawn Simulator
- 5.1.5. Light Therapy Bulbs
- 5.1.6. Handheld Devices
- 5.2. Market Analysis, Insights and Forecast - by Light Type
- 5.2.1. White Light
- 5.2.2. Blue Light
- 5.2.3. Red Light
- 5.2.4. Others (Green and Yellow Light)
- 5.3. Market Analysis, Insights and Forecast - by Application
- 5.3.1. Vitamin D Deficiency
- 5.3.2. Mental Health Disorders
- 5.3.3. Skin Disorders
- 5.3.4. Neonatal Jaundice
- 5.4. Market Analysis, Insights and Forecast - by End User
- 5.4.1. Dermatology Clinics
- 5.4.2. Home Care Settings
- 5.4.3. Others (Workplace, Salons, etc.)
- 5.5. Market Analysis, Insights and Forecast - by Region
- 5.5.1. North America
- 5.5.2. Europe
- 5.5.3. Asia Pacific
- 5.5.4. Middle East and Africa
- 5.5.5. South America
- 5.1. Market Analysis, Insights and Forecast - by Product Type
- 6. Global Phototherapy Industry Analysis, Insights and Forecast, 2021-2033
- 6.1. Market Analysis, Insights and Forecast - by Product Type
- 6.1.1. Light Box
- 6.1.2. Floor and Desk Lamps
- 6.1.3. Light Visor
- 6.1.4. Dawn Simulator
- 6.1.5. Light Therapy Bulbs
- 6.1.6. Handheld Devices
- 6.2. Market Analysis, Insights and Forecast - by Light Type
- 6.2.1. White Light
- 6.2.2. Blue Light
- 6.2.3. Red Light
- 6.2.4. Others (Green and Yellow Light)
- 6.3. Market Analysis, Insights and Forecast - by Application
- 6.3.1. Vitamin D Deficiency
- 6.3.2. Mental Health Disorders
- 6.3.3. Skin Disorders
- 6.3.4. Neonatal Jaundice
- 6.4. Market Analysis, Insights and Forecast - by End User
- 6.4.1. Dermatology Clinics
- 6.4.2. Home Care Settings
- 6.4.3. Others (Workplace, Salons, etc.)
- 6.1. Market Analysis, Insights and Forecast - by Product Type
- 7. North America Phototherapy Industry Analysis, Insights and Forecast, 2020-2032
- 7.1. Market Analysis, Insights and Forecast - by Product Type
- 7.1.1. Light Box
- 7.1.2. Floor and Desk Lamps
- 7.1.3. Light Visor
- 7.1.4. Dawn Simulator
- 7.1.5. Light Therapy Bulbs
- 7.1.6. Handheld Devices
- 7.2. Market Analysis, Insights and Forecast - by Light Type
- 7.2.1. White Light
- 7.2.2. Blue Light
- 7.2.3. Red Light
- 7.2.4. Others (Green and Yellow Light)
- 7.3. Market Analysis, Insights and Forecast - by Application
- 7.3.1. Vitamin D Deficiency
- 7.3.2. Mental Health Disorders
- 7.3.3. Skin Disorders
- 7.3.4. Neonatal Jaundice
- 7.4. Market Analysis, Insights and Forecast - by End User
- 7.4.1. Dermatology Clinics
- 7.4.2. Home Care Settings
- 7.4.3. Others (Workplace, Salons, etc.)
- 7.1. Market Analysis, Insights and Forecast - by Product Type
- 8. Europe Phototherapy Industry Analysis, Insights and Forecast, 2020-2032
- 8.1. Market Analysis, Insights and Forecast - by Product Type
- 8.1.1. Light Box
- 8.1.2. Floor and Desk Lamps
- 8.1.3. Light Visor
- 8.1.4. Dawn Simulator
- 8.1.5. Light Therapy Bulbs
- 8.1.6. Handheld Devices
- 8.2. Market Analysis, Insights and Forecast - by Light Type
- 8.2.1. White Light
- 8.2.2. Blue Light
- 8.2.3. Red Light
- 8.2.4. Others (Green and Yellow Light)
- 8.3. Market Analysis, Insights and Forecast - by Application
- 8.3.1. Vitamin D Deficiency
- 8.3.2. Mental Health Disorders
- 8.3.3. Skin Disorders
- 8.3.4. Neonatal Jaundice
- 8.4. Market Analysis, Insights and Forecast - by End User
- 8.4.1. Dermatology Clinics
- 8.4.2. Home Care Settings
- 8.4.3. Others (Workplace, Salons, etc.)
- 8.1. Market Analysis, Insights and Forecast - by Product Type
- 9. Asia Pacific Phototherapy Industry Analysis, Insights and Forecast, 2020-2032
- 9.1. Market Analysis, Insights and Forecast - by Product Type
- 9.1.1. Light Box
- 9.1.2. Floor and Desk Lamps
- 9.1.3. Light Visor
- 9.1.4. Dawn Simulator
- 9.1.5. Light Therapy Bulbs
- 9.1.6. Handheld Devices
- 9.2. Market Analysis, Insights and Forecast - by Light Type
- 9.2.1. White Light
- 9.2.2. Blue Light
- 9.2.3. Red Light
- 9.2.4. Others (Green and Yellow Light)
- 9.3. Market Analysis, Insights and Forecast - by Application
- 9.3.1. Vitamin D Deficiency
- 9.3.2. Mental Health Disorders
- 9.3.3. Skin Disorders
- 9.3.4. Neonatal Jaundice
- 9.4. Market Analysis, Insights and Forecast - by End User
- 9.4.1. Dermatology Clinics
- 9.4.2. Home Care Settings
- 9.4.3. Others (Workplace, Salons, etc.)
- 9.1. Market Analysis, Insights and Forecast - by Product Type
- 10. Middle East and Africa Phototherapy Industry Analysis, Insights and Forecast, 2020-2032
- 10.1. Market Analysis, Insights and Forecast - by Product Type
- 10.1.1. Light Box
- 10.1.2. Floor and Desk Lamps
- 10.1.3. Light Visor
- 10.1.4. Dawn Simulator
- 10.1.5. Light Therapy Bulbs
- 10.1.6. Handheld Devices
- 10.2. Market Analysis, Insights and Forecast - by Light Type
- 10.2.1. White Light
- 10.2.2. Blue Light
- 10.2.3. Red Light
- 10.2.4. Others (Green and Yellow Light)
- 10.3. Market Analysis, Insights and Forecast - by Application
- 10.3.1. Vitamin D Deficiency
- 10.3.2. Mental Health Disorders
- 10.3.3. Skin Disorders
- 10.3.4. Neonatal Jaundice
- 10.4. Market Analysis, Insights and Forecast - by End User
- 10.4.1. Dermatology Clinics
- 10.4.2. Home Care Settings
- 10.4.3. Others (Workplace, Salons, etc.)
- 10.1. Market Analysis, Insights and Forecast - by Product Type
- 11. South America Phototherapy Industry Analysis, Insights and Forecast, 2020-2032
- 11.1. Market Analysis, Insights and Forecast - by Product Type
- 11.1.1. Light Box
- 11.1.2. Floor and Desk Lamps
- 11.1.3. Light Visor
- 11.1.4. Dawn Simulator
- 11.1.5. Light Therapy Bulbs
- 11.1.6. Handheld Devices
- 11.2. Market Analysis, Insights and Forecast - by Light Type
- 11.2.1. White Light
- 11.2.2. Blue Light
- 11.2.3. Red Light
- 11.2.4. Others (Green and Yellow Light)
- 11.3. Market Analysis, Insights and Forecast - by Application
- 11.3.1. Vitamin D Deficiency
- 11.3.2. Mental Health Disorders
- 11.3.3. Skin Disorders
- 11.3.4. Neonatal Jaundice
- 11.4. Market Analysis, Insights and Forecast - by End User
- 11.4.1. Dermatology Clinics
- 11.4.2. Home Care Settings
- 11.4.3. Others (Workplace, Salons, etc.)
- 11.1. Market Analysis, Insights and Forecast - by Product Type
- 12. Competitive Analysis
- 12.1. Company Profiles
- 12.1.1 Beurer
- 12.1.1.1. Company Overview
- 12.1.1.2. Products
- 12.1.1.3. Company Financials
- 12.1.1.4. SWOT Analysis
- 12.1.2 Zepter International
- 12.1.2.1. Company Overview
- 12.1.2.2. Products
- 12.1.2.3. Company Financials
- 12.1.2.4. SWOT Analysis
- 12.1.3 PhotoMedex Inc
- 12.1.3.1. Company Overview
- 12.1.3.2. Products
- 12.1.3.3. Company Financials
- 12.1.3.4. SWOT Analysis
- 12.1.4 Verilux Inc
- 12.1.4.1. Company Overview
- 12.1.4.2. Products
- 12.1.4.3. Company Financials
- 12.1.4.4. SWOT Analysis
- 12.1.5 Nature Bright
- 12.1.5.1. Company Overview
- 12.1.5.2. Products
- 12.1.5.3. Company Financials
- 12.1.5.4. SWOT Analysis
- 12.1.6 Revian Inc
- 12.1.6.1. Company Overview
- 12.1.6.2. Products
- 12.1.6.3. Company Financials
- 12.1.6.4. SWOT Analysis
- 12.1.7 Koninklijke Philips N V
- 12.1.7.1. Company Overview
- 12.1.7.2. Products
- 12.1.7.3. Company Financials
- 12.1.7.4. SWOT Analysis
- 12.1.8 Northern Light Technologies
- 12.1.8.1. Company Overview
- 12.1.8.2. Products
- 12.1.8.3. Company Financials
- 12.1.8.4. SWOT Analysis
- 12.1.9 Lumie
- 12.1.9.1. Company Overview
- 12.1.9.2. Products
- 12.1.9.3. Company Financials
- 12.1.9.4. SWOT Analysis
- 12.1.10 BioPhotas
- 12.1.10.1. Company Overview
- 12.1.10.2. Products
- 12.1.10.3. Company Financials
- 12.1.10.4. SWOT Analysis
- 12.1.11 Carex
- 12.1.11.1. Company Overview
- 12.1.11.2. Products
- 12.1.11.3. Company Financials
- 12.1.11.4. SWOT Analysis
- 12.1.12 Lucimed SA
- 12.1.12.1. Company Overview
- 12.1.12.2. Products
- 12.1.12.3. Company Financials
- 12.1.12.4. SWOT Analysis
- 12.1.1 Beurer
- 12.2. Market Entropy
- 12.2.1 Company's Key Areas Served
- 12.2.2 Recent Developments
- 12.3. Company Market Share Analysis 2025
- 12.3.1 Top 5 Companies Market Share Analysis
- 12.3.2 Top 3 Companies Market Share Analysis
- 12.4. List of Potential Customers
- 13. Research Methodology
List of Figures
- Figure 1: Global Phototherapy Industry Revenue Breakdown (million, %) by Region 2025 & 2033
- Figure 2: North America Phototherapy Industry Revenue (million), by Product Type 2025 & 2033
- Figure 3: North America Phototherapy Industry Revenue Share (%), by Product Type 2025 & 2033
- Figure 4: North America Phototherapy Industry Revenue (million), by Light Type 2025 & 2033
- Figure 5: North America Phototherapy Industry Revenue Share (%), by Light Type 2025 & 2033
- Figure 6: North America Phototherapy Industry Revenue (million), by Application 2025 & 2033
- Figure 7: North America Phototherapy Industry Revenue Share (%), by Application 2025 & 2033
- Figure 8: North America Phototherapy Industry Revenue (million), by End User 2025 & 2033
- Figure 9: North America Phototherapy Industry Revenue Share (%), by End User 2025 & 2033
- Figure 10: North America Phototherapy Industry Revenue (million), by Country 2025 & 2033
- Figure 11: North America Phototherapy Industry Revenue Share (%), by Country 2025 & 2033
- Figure 12: Europe Phototherapy Industry Revenue (million), by Product Type 2025 & 2033
- Figure 13: Europe Phototherapy Industry Revenue Share (%), by Product Type 2025 & 2033
- Figure 14: Europe Phototherapy Industry Revenue (million), by Light Type 2025 & 2033
- Figure 15: Europe Phototherapy Industry Revenue Share (%), by Light Type 2025 & 2033
- Figure 16: Europe Phototherapy Industry Revenue (million), by Application 2025 & 2033
- Figure 17: Europe Phototherapy Industry Revenue Share (%), by Application 2025 & 2033
- Figure 18: Europe Phototherapy Industry Revenue (million), by End User 2025 & 2033
- Figure 19: Europe Phototherapy Industry Revenue Share (%), by End User 2025 & 2033
- Figure 20: Europe Phototherapy Industry Revenue (million), by Country 2025 & 2033
- Figure 21: Europe Phototherapy Industry Revenue Share (%), by Country 2025 & 2033
- Figure 22: Asia Pacific Phototherapy Industry Revenue (million), by Product Type 2025 & 2033
- Figure 23: Asia Pacific Phototherapy Industry Revenue Share (%), by Product Type 2025 & 2033
- Figure 24: Asia Pacific Phototherapy Industry Revenue (million), by Light Type 2025 & 2033
- Figure 25: Asia Pacific Phototherapy Industry Revenue Share (%), by Light Type 2025 & 2033
- Figure 26: Asia Pacific Phototherapy Industry Revenue (million), by Application 2025 & 2033
- Figure 27: Asia Pacific Phototherapy Industry Revenue Share (%), by Application 2025 & 2033
- Figure 28: Asia Pacific Phototherapy Industry Revenue (million), by End User 2025 & 2033
- Figure 29: Asia Pacific Phototherapy Industry Revenue Share (%), by End User 2025 & 2033
- Figure 30: Asia Pacific Phototherapy Industry Revenue (million), by Country 2025 & 2033
- Figure 31: Asia Pacific Phototherapy Industry Revenue Share (%), by Country 2025 & 2033
- Figure 32: Middle East and Africa Phototherapy Industry Revenue (million), by Product Type 2025 & 2033
- Figure 33: Middle East and Africa Phototherapy Industry Revenue Share (%), by Product Type 2025 & 2033
- Figure 34: Middle East and Africa Phototherapy Industry Revenue (million), by Light Type 2025 & 2033
- Figure 35: Middle East and Africa Phototherapy Industry Revenue Share (%), by Light Type 2025 & 2033
- Figure 36: Middle East and Africa Phototherapy Industry Revenue (million), by Application 2025 & 2033
- Figure 37: Middle East and Africa Phototherapy Industry Revenue Share (%), by Application 2025 & 2033
- Figure 38: Middle East and Africa Phototherapy Industry Revenue (million), by End User 2025 & 2033
- Figure 39: Middle East and Africa Phototherapy Industry Revenue Share (%), by End User 2025 & 2033
- Figure 40: Middle East and Africa Phototherapy Industry Revenue (million), by Country 2025 & 2033
- Figure 41: Middle East and Africa Phototherapy Industry Revenue Share (%), by Country 2025 & 2033
- Figure 42: South America Phototherapy Industry Revenue (million), by Product Type 2025 & 2033
- Figure 43: South America Phototherapy Industry Revenue Share (%), by Product Type 2025 & 2033
- Figure 44: South America Phototherapy Industry Revenue (million), by Light Type 2025 & 2033
- Figure 45: South America Phototherapy Industry Revenue Share (%), by Light Type 2025 & 2033
- Figure 46: South America Phototherapy Industry Revenue (million), by Application 2025 & 2033
- Figure 47: South America Phototherapy Industry Revenue Share (%), by Application 2025 & 2033
- Figure 48: South America Phototherapy Industry Revenue (million), by End User 2025 & 2033
- Figure 49: South America Phototherapy Industry Revenue Share (%), by End User 2025 & 2033
- Figure 50: South America Phototherapy Industry Revenue (million), by Country 2025 & 2033
- Figure 51: South America Phototherapy Industry Revenue Share (%), by Country 2025 & 2033
List of Tables
- Table 1: Global Phototherapy Industry Revenue million Forecast, by Product Type 2020 & 2033
- Table 2: Global Phototherapy Industry Revenue million Forecast, by Light Type 2020 & 2033
- Table 3: Global Phototherapy Industry Revenue million Forecast, by Application 2020 & 2033
- Table 4: Global Phototherapy Industry Revenue million Forecast, by End User 2020 & 2033
- Table 5: Global Phototherapy Industry Revenue million Forecast, by Region 2020 & 2033
- Table 6: Global Phototherapy Industry Revenue million Forecast, by Product Type 2020 & 2033
- Table 7: Global Phototherapy Industry Revenue million Forecast, by Light Type 2020 & 2033
- Table 8: Global Phototherapy Industry Revenue million Forecast, by Application 2020 & 2033
- Table 9: Global Phototherapy Industry Revenue million Forecast, by End User 2020 & 2033
- Table 10: Global Phototherapy Industry Revenue million Forecast, by Country 2020 & 2033
- Table 11: United States Phototherapy Industry Revenue (million) Forecast, by Application 2020 & 2033
- Table 12: Canada Phototherapy Industry Revenue (million) Forecast, by Application 2020 & 2033
- Table 13: Mexico Phototherapy Industry Revenue (million) Forecast, by Application 2020 & 2033
- Table 14: Global Phototherapy Industry Revenue million Forecast, by Product Type 2020 & 2033
- Table 15: Global Phototherapy Industry Revenue million Forecast, by Light Type 2020 & 2033
- Table 16: Global Phototherapy Industry Revenue million Forecast, by Application 2020 & 2033
- Table 17: Global Phototherapy Industry Revenue million Forecast, by End User 2020 & 2033
- Table 18: Global Phototherapy Industry Revenue million Forecast, by Country 2020 & 2033
- Table 19: Germany Phototherapy Industry Revenue (million) Forecast, by Application 2020 & 2033
- Table 20: United Kingdom Phototherapy Industry Revenue (million) Forecast, by Application 2020 & 2033
- Table 21: France Phototherapy Industry Revenue (million) Forecast, by Application 2020 & 2033
- Table 22: Italy Phototherapy Industry Revenue (million) Forecast, by Application 2020 & 2033
- Table 23: Spain Phototherapy Industry Revenue (million) Forecast, by Application 2020 & 2033
- Table 24: Rest of Europe Phototherapy Industry Revenue (million) Forecast, by Application 2020 & 2033
- Table 25: Global Phototherapy Industry Revenue million Forecast, by Product Type 2020 & 2033
- Table 26: Global Phototherapy Industry Revenue million Forecast, by Light Type 2020 & 2033
- Table 27: Global Phototherapy Industry Revenue million Forecast, by Application 2020 & 2033
- Table 28: Global Phototherapy Industry Revenue million Forecast, by End User 2020 & 2033
- Table 29: Global Phototherapy Industry Revenue million Forecast, by Country 2020 & 2033
- Table 30: China Phototherapy Industry Revenue (million) Forecast, by Application 2020 & 2033
- Table 31: Japan Phototherapy Industry Revenue (million) Forecast, by Application 2020 & 2033
- Table 32: India Phototherapy Industry Revenue (million) Forecast, by Application 2020 & 2033
- Table 33: Australia Phototherapy Industry Revenue (million) Forecast, by Application 2020 & 2033
- Table 34: South Korea Phototherapy Industry Revenue (million) Forecast, by Application 2020 & 2033
- Table 35: Rest of Asia Pacific Phototherapy Industry Revenue (million) Forecast, by Application 2020 & 2033
- Table 36: Global Phototherapy Industry Revenue million Forecast, by Product Type 2020 & 2033
- Table 37: Global Phototherapy Industry Revenue million Forecast, by Light Type 2020 & 2033
- Table 38: Global Phototherapy Industry Revenue million Forecast, by Application 2020 & 2033
- Table 39: Global Phototherapy Industry Revenue million Forecast, by End User 2020 & 2033
- Table 40: Global Phototherapy Industry Revenue million Forecast, by Country 2020 & 2033
- Table 41: GCC Phototherapy Industry Revenue (million) Forecast, by Application 2020 & 2033
- Table 42: South Africa Phototherapy Industry Revenue (million) Forecast, by Application 2020 & 2033
- Table 43: Rest of Middle East and Africa Phototherapy Industry Revenue (million) Forecast, by Application 2020 & 2033
- Table 44: Global Phototherapy Industry Revenue million Forecast, by Product Type 2020 & 2033
- Table 45: Global Phototherapy Industry Revenue million Forecast, by Light Type 2020 & 2033
- Table 46: Global Phototherapy Industry Revenue million Forecast, by Application 2020 & 2033
- Table 47: Global Phototherapy Industry Revenue million Forecast, by End User 2020 & 2033
- Table 48: Global Phototherapy Industry Revenue million Forecast, by Country 2020 & 2033
- Table 49: Brazil Phototherapy Industry Revenue (million) Forecast, by Application 2020 & 2033
- Table 50: Argentina Phototherapy Industry Revenue (million) Forecast, by Application 2020 & 2033
- Table 51: Rest of South America Phototherapy Industry Revenue (million) Forecast, by Application 2020 & 2033
Frequently Asked Questions
1. What is the projected Compound Annual Growth Rate (CAGR) of the Phototherapy Industry?
The projected CAGR is approximately 4.1%.
2. Which companies are prominent players in the Phototherapy Industry?
Key companies in the market include Beurer, Zepter International, PhotoMedex Inc, Verilux Inc, Nature Bright, Revian Inc, Koninklijke Philips N V, Northern Light Technologies, Lumie, BioPhotas, Carex, Lucimed SA.
3. What are the main segments of the Phototherapy Industry?
The market segments include Product Type, Light Type, Application, End User.
4. Can you provide details about the market size?
The market size is estimated to be USD 649.37 million as of 2022.
5. What are some drivers contributing to market growth?
Growing Burden of Skin and Mental Health Disorders; Increasing Research and Development Activities.
6. What are the notable trends driving market growth?
Red Light Segment is Expected to Account for the Largest Market Share During the Forecast Period.
7. Are there any restraints impacting market growth?
Increasing Side Effects Due to Light Therapy and Product Recalls.
8. Can you provide examples of recent developments in the market?
In February 2022, STRATA Skin Sciences, Inc. announced the commercial launch of its next-generation excimer laser system, XTRAC Momentum 1.0. The XTRAC excimer laser technology allows for the precise delivery of targeted UVB light therapy to specific treatment areas of the skin for both adult and pediatric patients suffering from inflammatory skin conditions such as psoriasis, atopic dermatitis, and vitiligo.
9. What pricing options are available for accessing the report?
Pricing options include single-user, multi-user, and enterprise licenses priced at USD 4750, USD 5250, and USD 8750 respectively.
10. Is the market size provided in terms of value or volume?
The market size is provided in terms of value, measured in million.
11. Are there any specific market keywords associated with the report?
Yes, the market keyword associated with the report is "Phototherapy Industry," which aids in identifying and referencing the specific market segment covered.
12. How do I determine which pricing option suits my needs best?
The pricing options vary based on user requirements and access needs. Individual users may opt for single-user licenses, while businesses requiring broader access may choose multi-user or enterprise licenses for cost-effective access to the report.
13. Are there any additional resources or data provided in the Phototherapy Industry report?
While the report offers comprehensive insights, it's advisable to review the specific contents or supplementary materials provided to ascertain if additional resources or data are available.
14. How can I stay updated on further developments or reports in the Phototherapy Industry?
To stay informed about further developments, trends, and reports in the Phototherapy Industry, consider subscribing to industry newsletters, following relevant companies and organizations, or regularly checking reputable industry news sources and publications.
Methodology
Step 1 - Identification of Relevant Samples Size from Population Database


Step 2 - Approaches for Defining Global Market Size (Value, Volume* & Price*)

Note*: In applicable scenarios
Step 3 - Data Sources
Primary Research
- Web Analytics
- Survey Reports
- Research Institute
- Latest Research Reports
- Opinion Leaders
Secondary Research
- Annual Reports
- White Paper
- Latest Press Release
- Industry Association
- Paid Database
- Investor Presentations

Step 4 - Data Triangulation
Involves using different sources of information in order to increase the validity of a study
These sources are likely to be stakeholders in a program - participants, other researchers, program staff, other community members, and so on.
Then we put all data in single framework & apply various statistical tools to find out the dynamic on the market.
During the analysis stage, feedback from the stakeholder groups would be compared to determine areas of agreement as well as areas of divergence