

Key Insights
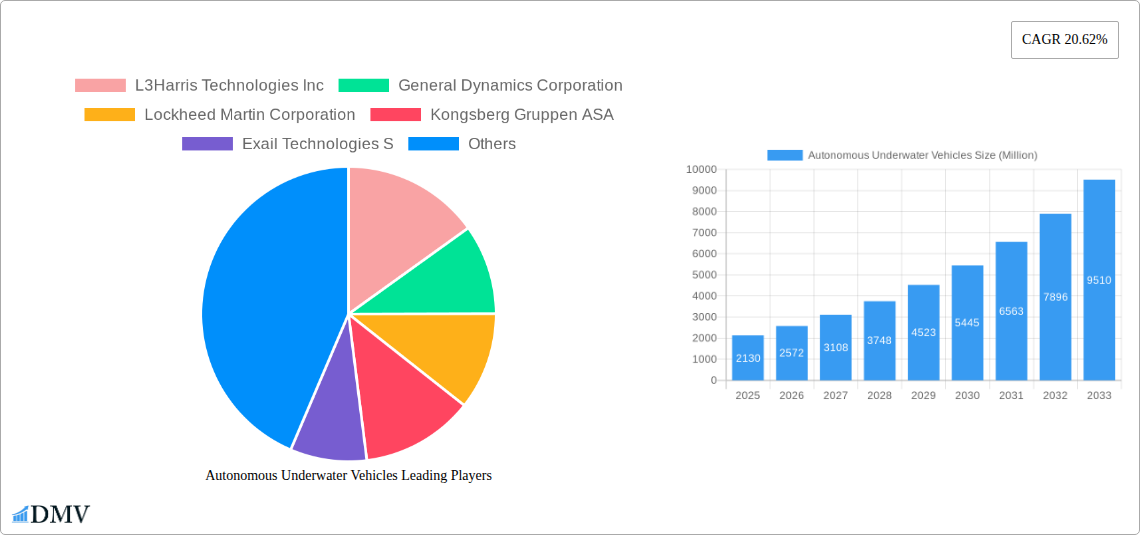
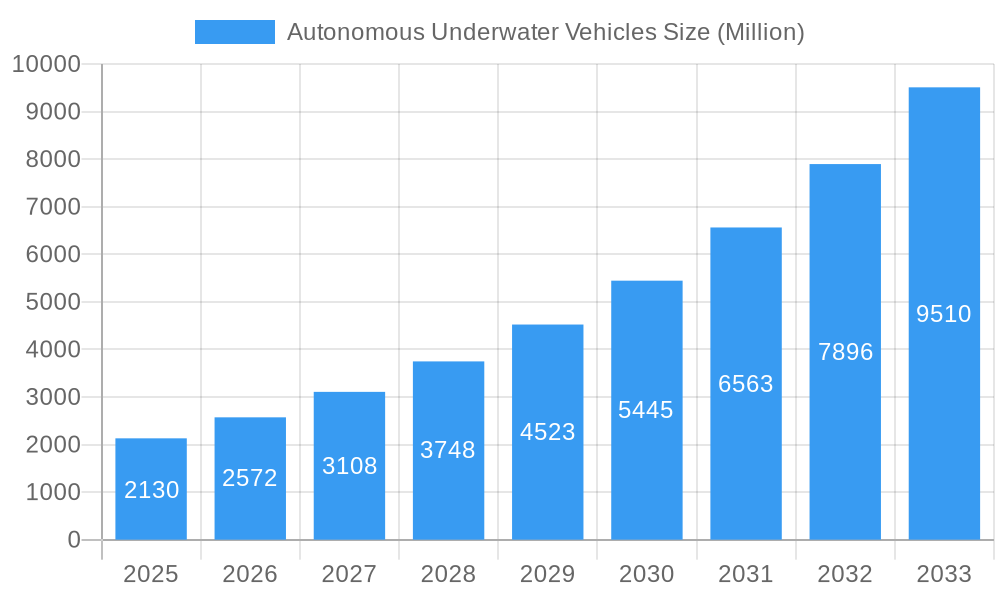
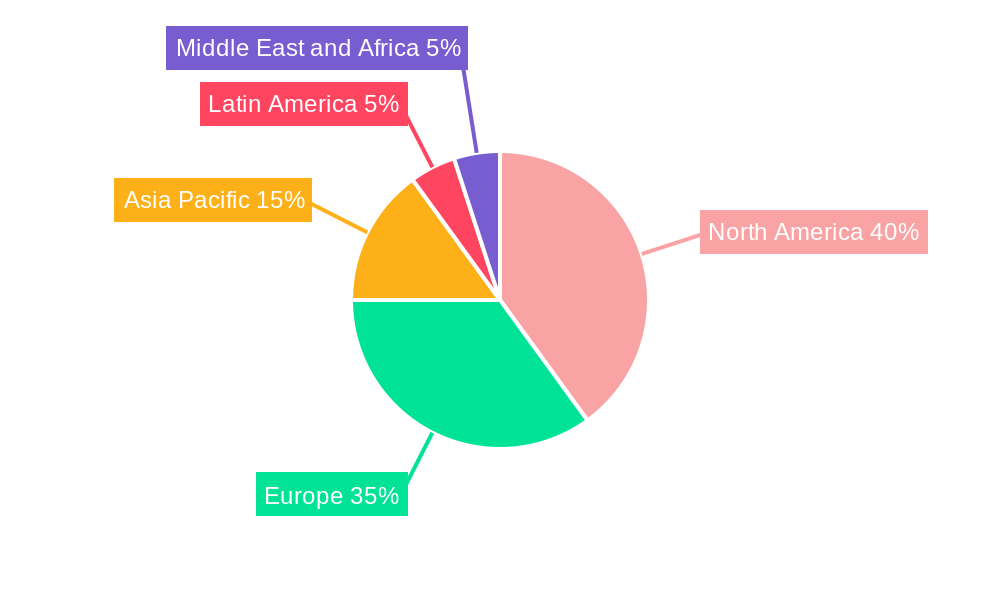
The Autonomous Underwater Vehicle (AUV) market is experiencing robust growth, projected to reach \$2.13 billion in 2025 and exhibiting a Compound Annual Growth Rate (CAGR) of 20.62% from 2025 to 2033. This expansion is driven by several key factors. Increasing demand for efficient subsea operations across diverse sectors, including military & defense (surveillance, mine countermeasures), oil & gas (pipeline inspection, exploration), and environmental monitoring (pollution detection, oceanographic research), is a primary catalyst. Technological advancements, particularly in areas like sensor technology, battery life, and AI-powered navigation systems, are significantly enhancing AUV capabilities, leading to broader adoption and application across new markets. Furthermore, the growing need for efficient search and salvage operations, coupled with rising interest in archaeological exploration using non-invasive AUV technology, is fueling market growth. The market segmentation reveals a varied landscape, with medium and large AUVs dominating the market share, driven by their greater payload capacity and operational range. North America and Europe currently hold significant market share, driven by substantial investment in defense and offshore energy infrastructure; however, the Asia-Pacific region is expected to demonstrate rapid growth due to increasing infrastructure development and governmental investments in maritime exploration and research.
Autonomous Underwater Vehicles Market Size (In Billion)
The competitive landscape is characterized by a mix of established defense contractors (like Lockheed Martin, Boeing, and General Dynamics) and specialized AUV manufacturers (like Kongsberg Gruppen and Teledyne Technologies). These companies are actively involved in R&D, strategic partnerships, and mergers and acquisitions to strengthen their market position and expand their product portfolio. While potential restraints include high initial investment costs and the need for specialized technical expertise to operate AUVs, the long-term benefits of improved efficiency, reduced risk, and access to previously unreachable areas continue to outweigh these challenges. The ongoing technological advancements, coupled with increasing demand across diverse applications, position the AUV market for substantial growth throughout the forecast period, paving the way for a flourishing ecosystem of innovation and industry expansion.
Autonomous Underwater Vehicles Company Market Share
Autonomous Underwater Vehicles (AUV) Market: A Comprehensive Report (2019-2033)
This insightful report provides a comprehensive analysis of the Autonomous Underwater Vehicles (AUV) market, projecting a market value exceeding $XX Million by 2033. The study covers the historical period (2019-2024), the base year (2025), and forecasts the market's trajectory from 2025 to 2033. Key players like L3Harris Technologies Inc., General Dynamics Corporation, and Lockheed Martin Corporation are profiled, alongside an examination of market segments, technological advancements, and future opportunities. This report is essential for stakeholders seeking a deep understanding of this rapidly evolving sector.
Autonomous Underwater Vehicles Market Composition & Trends
The Autonomous Underwater Vehicle (AUV) market is characterized by a dynamic landscape, with significant growth anticipated. Valued at approximately $XX Million in 2025, the market demonstrates a moderately consolidated structure. Leading players such as L3Harris Technologies Inc., General Dynamics Corporation, and Kongsberg Gruppen ASA are estimated to collectively command a substantial market share, around XX% in 2025. However, the ecosystem also thrives on the innovative contributions of smaller, specialized firms that are pushing the boundaries of AUV technology.
Key drivers of market expansion include relentless technological advancements. These span across critical areas like AI-powered navigation, which enables sophisticated autonomous maneuvering in challenging subsea environments; enhanced sensor technologies offering superior data acquisition and analysis; and significant improvements in operational endurance through advanced power solutions. Furthermore, the industry's trajectory is influenced by the implementation of stringent environmental regulations governing underwater exploration and resource management, fostering a need for more efficient and less impactful survey methods.
While Remotely Operated Vehicles (ROVs) continue to be a competitive substitute, AUVs are increasingly favored for applications demanding true autonomy, reduced operational costs, and the ability to cover larger areas with minimal human intervention. This inherent advantage is solidifying their position in various niche and large-scale projects.
Mergers and acquisitions (M&A) are expected to remain a significant aspect of market evolution, with an estimated $XX Million in deal value projected over the next five years. This activity is fueled by a strategic imperative for companies to broaden their technological capabilities, expand their product portfolios, and enhance their global market penetration. The primary end-user segments are robust, comprising government entities (including military and research institutions) and a diverse range of commercial enterprises, particularly those involved in the oil and gas sector for exploration and pipeline inspection, and in environmental monitoring for ecological assessments and conservation efforts.
- Market Concentration: Moderately consolidated, with top three players anticipated to hold approximately XX% market share in 2025.
- Innovation Catalysts: The market is propelled by advancements in AI-powered navigation, sophisticated sensor technology, and extended operational endurance.
- Regulatory Landscape: Stringent environmental regulations are actively shaping operational practices and driving demand for compliant technologies.
- Substitute Products: ROVs present viable alternatives, yet AUVs offer distinct advantages in terms of autonomy, cost-effectiveness, and operational efficiency for specific use cases.
- End-User Profile: Dominated by Government (Military & Research) and Commercial sectors, notably Oil & Gas and Environmental Monitoring.
- M&A Activity: Projected deal value of $XX Million over the next five years, indicating significant strategic consolidation and growth.
Autonomous Underwater Vehicles Industry Evolution
The AUV market is experiencing robust growth, with a projected Compound Annual Growth Rate (CAGR) of XX% during the forecast period (2025-2033). This growth is primarily driven by increasing demand from the military & defense sector for intelligence, surveillance, and reconnaissance (ISR) applications, coupled with growing interest in underwater resource exploration (oil & gas) and environmental monitoring initiatives. Technological advancements such as enhanced autonomy, improved sensor integration, and the development of more robust and reliable AUVs are further contributing to market expansion. The adoption rate of AUVs is rising across various sectors, with a notable increase observed in applications requiring extended operational periods or access to hazardous environments. This trend is expected to continue, further fueling market expansion throughout the forecast period. The demand for improved underwater mapping and surveying capabilities across commercial and defense segments is driving increased investments in the sector, leading to the development of increasingly sophisticated and capable AUVs. The market is also witnessing a shift toward smaller, more versatile AUVs for niche applications, alongside the development of larger AUVs designed for high-end tasks.
Leading Regions, Countries, or Segments in Autonomous Underwater Vehicles
The North American region is projected to remain the dominant market for AUVs throughout the forecast period, driven by significant investments from the US military and a robust private sector involved in oil and gas exploration, as well as environmental monitoring initiatives. The Asia-Pacific region is expected to experience substantial growth due to increasing infrastructure development and heightened focus on maritime security.
- Dominant Region: North America
- Key Drivers (North America): Significant military investment, strong private sector participation in oil and gas and environmental monitoring.
- Key Drivers (Asia-Pacific): Infrastructure development, focus on maritime security.
By Application: The military and defense segment currently dominates, accounting for the largest market share, followed by the oil and gas sector. The environmental protection and monitoring segment shows significant growth potential. The archaeology and exploration segment is a niche area with potential for future expansion.
- Dominant Segment (Application): Military & Defense
- Growth Potential: Environmental Protection & Monitoring
By Type: The medium-sized AUV segment is experiencing the highest growth rate, balancing operational capabilities and cost-effectiveness. The large AUV segment is critical for deep-sea exploration and military operations, albeit representing a smaller market share compared to medium AUVs.
- Fastest-Growing Segment (Type): Medium
- High-Value Segment (Type): Large
Autonomous Underwater Vehicles Product Innovations
Recent product innovations in the AUV sector are significantly enhancing their operational capabilities and expanding their application horizons. A cornerstone of these advancements lies in enhanced AI-powered navigation systems. These sophisticated systems empower AUVs to autonomously and efficiently chart courses through complex and dynamic underwater environments, including intricate underwater terrains and areas with limited visibility. Complementing this are advanced sensor technologies, which are providing unprecedented levels of data accuracy, resolution, and range, thereby enabling more comprehensive and reliable subsea data acquisition. Furthermore, breakthroughs in energy management and battery technology are leading to significantly improved endurance, allowing AUVs to undertake longer missions and cover greater distances without the need for frequent resurfacing or support. These collective innovations are not only increasing mission success rates but are also unlocking new possibilities in sectors ranging from deep-sea exploration and scientific research to offshore infrastructure inspection and marine conservation.
The unique selling propositions (USPs) of modern AUVs are increasingly centered on their heightened levels of autonomy, improved resilience in harsh subsea conditions, and their superior capabilities for real-time data acquisition and processing.
Propelling Factors for Autonomous Underwater Vehicles Growth
Several factors drive AUV market growth. Technological advancements, including AI-powered navigation and advanced sensor technologies, are significantly enhancing capabilities. Government initiatives, particularly in defense and environmental monitoring, are driving demand. The increasing need for subsea infrastructure inspection and maintenance fuels adoption in the commercial sector. Furthermore, cost reductions in AUV manufacturing and operational expenses are making the technology more accessible.
Obstacles in the Autonomous Underwater Vehicles Market
Despite its promising growth trajectory, the AUV market encounters several significant obstacles. A primary challenge is the high initial investment cost associated with acquiring and deploying advanced AUV systems, which can be a barrier for smaller organizations or for projects with limited budgets. Potential supply chain disruptions, exacerbated by global events, can impact the availability of critical components and lead to extended delivery timelines, affecting production schedules and project completion. The market also experiences intense competition, not only among established global manufacturers but also from emerging players who are continually introducing novel technologies. Furthermore, navigating the regulatory landscape, particularly the complex and time-consuming process of obtaining permits for underwater operations, can introduce delays and escalate project costs, demanding careful planning and adherence to evolving international and local regulations.
Future Opportunities in Autonomous Underwater Vehicles
Future opportunities lie in expanding into new applications, such as aquaculture monitoring, subsea cable inspection, and underwater infrastructure asset management. Technological advancements, such as improved energy storage solutions, will extend mission durations. Further integration of AI and machine learning will enhance autonomy and decision-making capabilities.
Major Players in the Autonomous Underwater Vehicles Ecosystem
Key Developments in Autonomous Underwater Vehicles Industry
- July 2023: L3Harris Technologies Inc. demonstrated a significant leap in autonomous operations by successfully launching and recovering an AUV from a moving submarine, showcasing enhanced operational capabilities and system integration.
- February 2024: Kongsberg Gruppen ASA’s HUGIN AUVs were selected for deployment by the US military through a contract with the Defense Innovation Unit (DIU), underscoring the growing strategic importance and adoption of AUVs in defense applications.
Strategic Autonomous Underwater Vehicles Market Forecast
The future outlook for the Autonomous Underwater Vehicle (AUV) market is exceptionally positive, signaling a period of sustained and robust expansion. This optimistic forecast is underpinned by a confluence of factors, including rapid technological advancements that are continuously enhancing AUV capabilities, a notable increase in government spending on defense, maritime security, and scientific research initiatives, and the burgeoning adoption of AUVs in various commercial applications. As the operational capacities of AUVs continue to expand—offering greater autonomy, improved data collection, and enhanced mission flexibility—coupled with a projected trend of declining acquisition and operational costs, the market is set to unlock new and untapped segments. This evolution will drive broader adoption across diverse sectors, from renewable energy infrastructure inspection to deep-sea mineral exploration and environmental monitoring. The market's future growth trajectory is anticipated to be significant, characterized by persistent strong demand across key segments, fueled by ongoing technological breakthroughs, strategic partnerships, and an increasing recognition of the invaluable role AUVs play in subsea operations.
Autonomous Underwater Vehicles Segmentation
- 1. Production Analysis
- 2. Consumption Analysis
- 3. Import Market Analysis (Value & Volume)
- 4. Export Market Analysis (Value & Volume)
- 5. Price Trend Analysis
Autonomous Underwater Vehicles Segmentation By Geography
-
1. North America
- 1.1. United States
- 1.2. Canada
- 1.3. Mexico
-
2. South America
- 2.1. Brazil
- 2.2. Argentina
- 2.3. Rest of South America
-
3. Europe
- 3.1. United Kingdom
- 3.2. Germany
- 3.3. France
- 3.4. Italy
- 3.5. Spain
- 3.6. Russia
- 3.7. Benelux
- 3.8. Nordics
- 3.9. Rest of Europe
-
4. Middle East & Africa
- 4.1. Turkey
- 4.2. Israel
- 4.3. GCC
- 4.4. North Africa
- 4.5. South Africa
- 4.6. Rest of Middle East & Africa
-
5. Asia Pacific
- 5.1. China
- 5.2. India
- 5.3. Japan
- 5.4. South Korea
- 5.5. ASEAN
- 5.6. Oceania
- 5.7. Rest of Asia Pacific
Autonomous Underwater Vehicles Regional Market Share
Geographic Coverage of Autonomous Underwater Vehicles
Autonomous Underwater Vehicles REPORT HIGHLIGHTS
| Aspects | Details |
|---|---|
| Study Period | 2020-2034 |
| Base Year | 2025 |
| Estimated Year | 2026 |
| Forecast Period | 2026-2034 |
| Historical Period | 2020-2025 |
| Growth Rate | CAGR of 20.62% from 2020-2034 |
| Segmentation |
|
Table of Contents
- 1. Introduction
- 1.1. Research Scope
- 1.2. Market Segmentation
- 1.3. Research Objective
- 1.4. Definitions and Assumptions
- 2. Executive Summary
- 2.1. Market Snapshot
- 3. Market Dynamics
- 3.1. Market Drivers
- 3.2. Market Restrains
- 3.3. Market Trends
- 3.4. Market Opportunities
- 4. Market Factor Analysis
- 4.1. Porters Five Forces
- 4.1.1. Bargaining Power of Suppliers
- 4.1.2. Bargaining Power of Buyers
- 4.1.3. Threat of New Entrants
- 4.1.4. Threat of Substitutes
- 4.1.5. Competitive Rivalry
- 4.2. PESTEL analysis
- 4.3. BCG Analysis
- 4.3.1. Stars (High Growth, High Market Share)
- 4.3.2. Cash Cows (Low Growth, High Market Share)
- 4.3.3. Question Mark (High Growth, Low Market Share)
- 4.3.4. Dogs (Low Growth, Low Market Share)
- 4.4. Ansoff Matrix Analysis
- 4.5. Supply Chain Analysis
- 4.6. Regulatory Landscape
- 4.7. Current Market Potential and Opportunity Assessment (TAM–SAM–SOM Framework)
- 4.8. DMV Analyst Note
- 4.1. Porters Five Forces
- 5. Market Analysis, Insights and Forecast 2021-2033
- 5.1. Market Analysis, Insights and Forecast - by Production Analysis
- 5.2. Market Analysis, Insights and Forecast - by Consumption Analysis
- 5.3. Market Analysis, Insights and Forecast - by Import Market Analysis (Value & Volume)
- 5.4. Market Analysis, Insights and Forecast - by Export Market Analysis (Value & Volume)
- 5.5. Market Analysis, Insights and Forecast - by Price Trend Analysis
- 5.6. Market Analysis, Insights and Forecast - by Region
- 5.6.1. North America
- 5.6.2. South America
- 5.6.3. Europe
- 5.6.4. Middle East & Africa
- 5.6.5. Asia Pacific
- 6. Global Autonomous Underwater Vehicles Analysis, Insights and Forecast, 2021-2033
- 6.1. Market Analysis, Insights and Forecast - by Production Analysis
- 6.2. Market Analysis, Insights and Forecast - by Consumption Analysis
- 6.3. Market Analysis, Insights and Forecast - by Import Market Analysis (Value & Volume)
- 6.4. Market Analysis, Insights and Forecast - by Export Market Analysis (Value & Volume)
- 6.5. Market Analysis, Insights and Forecast - by Price Trend Analysis
- 7. North America Autonomous Underwater Vehicles Analysis, Insights and Forecast, 2020-2032
- 7.1. Market Analysis, Insights and Forecast - by Production Analysis
- 7.2. Market Analysis, Insights and Forecast - by Consumption Analysis
- 7.3. Market Analysis, Insights and Forecast - by Import Market Analysis (Value & Volume)
- 7.4. Market Analysis, Insights and Forecast - by Export Market Analysis (Value & Volume)
- 7.5. Market Analysis, Insights and Forecast - by Price Trend Analysis
- 8. South America Autonomous Underwater Vehicles Analysis, Insights and Forecast, 2020-2032
- 8.1. Market Analysis, Insights and Forecast - by Production Analysis
- 8.2. Market Analysis, Insights and Forecast - by Consumption Analysis
- 8.3. Market Analysis, Insights and Forecast - by Import Market Analysis (Value & Volume)
- 8.4. Market Analysis, Insights and Forecast - by Export Market Analysis (Value & Volume)
- 8.5. Market Analysis, Insights and Forecast - by Price Trend Analysis
- 9. Europe Autonomous Underwater Vehicles Analysis, Insights and Forecast, 2020-2032
- 9.1. Market Analysis, Insights and Forecast - by Production Analysis
- 9.2. Market Analysis, Insights and Forecast - by Consumption Analysis
- 9.3. Market Analysis, Insights and Forecast - by Import Market Analysis (Value & Volume)
- 9.4. Market Analysis, Insights and Forecast - by Export Market Analysis (Value & Volume)
- 9.5. Market Analysis, Insights and Forecast - by Price Trend Analysis
- 10. Middle East & Africa Autonomous Underwater Vehicles Analysis, Insights and Forecast, 2020-2032
- 10.1. Market Analysis, Insights and Forecast - by Production Analysis
- 10.2. Market Analysis, Insights and Forecast - by Consumption Analysis
- 10.3. Market Analysis, Insights and Forecast - by Import Market Analysis (Value & Volume)
- 10.4. Market Analysis, Insights and Forecast - by Export Market Analysis (Value & Volume)
- 10.5. Market Analysis, Insights and Forecast - by Price Trend Analysis
- 11. Asia Pacific Autonomous Underwater Vehicles Analysis, Insights and Forecast, 2020-2032
- 11.1. Market Analysis, Insights and Forecast - by Production Analysis
- 11.2. Market Analysis, Insights and Forecast - by Consumption Analysis
- 11.3. Market Analysis, Insights and Forecast - by Import Market Analysis (Value & Volume)
- 11.4. Market Analysis, Insights and Forecast - by Export Market Analysis (Value & Volume)
- 11.5. Market Analysis, Insights and Forecast - by Price Trend Analysis
- 12. Competitive Analysis
- 12.1. Company Profiles
- 12.1.1 L3Harris Technologies Inc
- 12.1.1.1. Company Overview
- 12.1.1.2. Products
- 12.1.1.3. Company Financials
- 12.1.1.4. SWOT Analysis
- 12.1.2 General Dynamics Corporation
- 12.1.2.1. Company Overview
- 12.1.2.2. Products
- 12.1.2.3. Company Financials
- 12.1.2.4. SWOT Analysis
- 12.1.3 Lockheed Martin Corporation
- 12.1.3.1. Company Overview
- 12.1.3.2. Products
- 12.1.3.3. Company Financials
- 12.1.3.4. SWOT Analysis
- 12.1.4 Kongsberg Gruppen ASA
- 12.1.4.1. Company Overview
- 12.1.4.2. Products
- 12.1.4.3. Company Financials
- 12.1.4.4. SWOT Analysis
- 12.1.5 Exail Technologies S
- 12.1.5.1. Company Overview
- 12.1.5.2. Products
- 12.1.5.3. Company Financials
- 12.1.5.4. SWOT Analysis
- 12.1.6 SAAB AB
- 12.1.6.1. Company Overview
- 12.1.6.2. Products
- 12.1.6.3. Company Financials
- 12.1.6.4. SWOT Analysis
- 12.1.7 BAE Systems plc
- 12.1.7.1. Company Overview
- 12.1.7.2. Products
- 12.1.7.3. Company Financials
- 12.1.7.4. SWOT Analysis
- 12.1.8 Teledyne Technologies Inc
- 12.1.8.1. Company Overview
- 12.1.8.2. Products
- 12.1.8.3. Company Financials
- 12.1.8.4. SWOT Analysis
- 12.1.9 The Boeing Company
- 12.1.9.1. Company Overview
- 12.1.9.2. Products
- 12.1.9.3. Company Financials
- 12.1.9.4. SWOT Analysis
- 12.1.1 L3Harris Technologies Inc
- 12.2. Market Entropy
- 12.2.1 Company's Key Areas Served
- 12.2.2 Recent Developments
- 12.3. Company Market Share Analysis 2025
- 12.3.1 Top 5 Companies Market Share Analysis
- 12.3.2 Top 3 Companies Market Share Analysis
- 12.4. List of Potential Customers
- 13. Research Methodology
List of Figures
- Figure 1: Global Autonomous Underwater Vehicles Revenue Breakdown (billion, %) by Region 2025 & 2033
- Figure 2: North America Autonomous Underwater Vehicles Revenue (billion), by Production Analysis 2025 & 2033
- Figure 3: North America Autonomous Underwater Vehicles Revenue Share (%), by Production Analysis 2025 & 2033
- Figure 4: North America Autonomous Underwater Vehicles Revenue (billion), by Consumption Analysis 2025 & 2033
- Figure 5: North America Autonomous Underwater Vehicles Revenue Share (%), by Consumption Analysis 2025 & 2033
- Figure 6: North America Autonomous Underwater Vehicles Revenue (billion), by Import Market Analysis (Value & Volume) 2025 & 2033
- Figure 7: North America Autonomous Underwater Vehicles Revenue Share (%), by Import Market Analysis (Value & Volume) 2025 & 2033
- Figure 8: North America Autonomous Underwater Vehicles Revenue (billion), by Export Market Analysis (Value & Volume) 2025 & 2033
- Figure 9: North America Autonomous Underwater Vehicles Revenue Share (%), by Export Market Analysis (Value & Volume) 2025 & 2033
- Figure 10: North America Autonomous Underwater Vehicles Revenue (billion), by Price Trend Analysis 2025 & 2033
- Figure 11: North America Autonomous Underwater Vehicles Revenue Share (%), by Price Trend Analysis 2025 & 2033
- Figure 12: North America Autonomous Underwater Vehicles Revenue (billion), by Country 2025 & 2033
- Figure 13: North America Autonomous Underwater Vehicles Revenue Share (%), by Country 2025 & 2033
- Figure 14: South America Autonomous Underwater Vehicles Revenue (billion), by Production Analysis 2025 & 2033
- Figure 15: South America Autonomous Underwater Vehicles Revenue Share (%), by Production Analysis 2025 & 2033
- Figure 16: South America Autonomous Underwater Vehicles Revenue (billion), by Consumption Analysis 2025 & 2033
- Figure 17: South America Autonomous Underwater Vehicles Revenue Share (%), by Consumption Analysis 2025 & 2033
- Figure 18: South America Autonomous Underwater Vehicles Revenue (billion), by Import Market Analysis (Value & Volume) 2025 & 2033
- Figure 19: South America Autonomous Underwater Vehicles Revenue Share (%), by Import Market Analysis (Value & Volume) 2025 & 2033
- Figure 20: South America Autonomous Underwater Vehicles Revenue (billion), by Export Market Analysis (Value & Volume) 2025 & 2033
- Figure 21: South America Autonomous Underwater Vehicles Revenue Share (%), by Export Market Analysis (Value & Volume) 2025 & 2033
- Figure 22: South America Autonomous Underwater Vehicles Revenue (billion), by Price Trend Analysis 2025 & 2033
- Figure 23: South America Autonomous Underwater Vehicles Revenue Share (%), by Price Trend Analysis 2025 & 2033
- Figure 24: South America Autonomous Underwater Vehicles Revenue (billion), by Country 2025 & 2033
- Figure 25: South America Autonomous Underwater Vehicles Revenue Share (%), by Country 2025 & 2033
- Figure 26: Europe Autonomous Underwater Vehicles Revenue (billion), by Production Analysis 2025 & 2033
- Figure 27: Europe Autonomous Underwater Vehicles Revenue Share (%), by Production Analysis 2025 & 2033
- Figure 28: Europe Autonomous Underwater Vehicles Revenue (billion), by Consumption Analysis 2025 & 2033
- Figure 29: Europe Autonomous Underwater Vehicles Revenue Share (%), by Consumption Analysis 2025 & 2033
- Figure 30: Europe Autonomous Underwater Vehicles Revenue (billion), by Import Market Analysis (Value & Volume) 2025 & 2033
- Figure 31: Europe Autonomous Underwater Vehicles Revenue Share (%), by Import Market Analysis (Value & Volume) 2025 & 2033
- Figure 32: Europe Autonomous Underwater Vehicles Revenue (billion), by Export Market Analysis (Value & Volume) 2025 & 2033
- Figure 33: Europe Autonomous Underwater Vehicles Revenue Share (%), by Export Market Analysis (Value & Volume) 2025 & 2033
- Figure 34: Europe Autonomous Underwater Vehicles Revenue (billion), by Price Trend Analysis 2025 & 2033
- Figure 35: Europe Autonomous Underwater Vehicles Revenue Share (%), by Price Trend Analysis 2025 & 2033
- Figure 36: Europe Autonomous Underwater Vehicles Revenue (billion), by Country 2025 & 2033
- Figure 37: Europe Autonomous Underwater Vehicles Revenue Share (%), by Country 2025 & 2033
- Figure 38: Middle East & Africa Autonomous Underwater Vehicles Revenue (billion), by Production Analysis 2025 & 2033
- Figure 39: Middle East & Africa Autonomous Underwater Vehicles Revenue Share (%), by Production Analysis 2025 & 2033
- Figure 40: Middle East & Africa Autonomous Underwater Vehicles Revenue (billion), by Consumption Analysis 2025 & 2033
- Figure 41: Middle East & Africa Autonomous Underwater Vehicles Revenue Share (%), by Consumption Analysis 2025 & 2033
- Figure 42: Middle East & Africa Autonomous Underwater Vehicles Revenue (billion), by Import Market Analysis (Value & Volume) 2025 & 2033
- Figure 43: Middle East & Africa Autonomous Underwater Vehicles Revenue Share (%), by Import Market Analysis (Value & Volume) 2025 & 2033
- Figure 44: Middle East & Africa Autonomous Underwater Vehicles Revenue (billion), by Export Market Analysis (Value & Volume) 2025 & 2033
- Figure 45: Middle East & Africa Autonomous Underwater Vehicles Revenue Share (%), by Export Market Analysis (Value & Volume) 2025 & 2033
- Figure 46: Middle East & Africa Autonomous Underwater Vehicles Revenue (billion), by Price Trend Analysis 2025 & 2033
- Figure 47: Middle East & Africa Autonomous Underwater Vehicles Revenue Share (%), by Price Trend Analysis 2025 & 2033
- Figure 48: Middle East & Africa Autonomous Underwater Vehicles Revenue (billion), by Country 2025 & 2033
- Figure 49: Middle East & Africa Autonomous Underwater Vehicles Revenue Share (%), by Country 2025 & 2033
- Figure 50: Asia Pacific Autonomous Underwater Vehicles Revenue (billion), by Production Analysis 2025 & 2033
- Figure 51: Asia Pacific Autonomous Underwater Vehicles Revenue Share (%), by Production Analysis 2025 & 2033
- Figure 52: Asia Pacific Autonomous Underwater Vehicles Revenue (billion), by Consumption Analysis 2025 & 2033
- Figure 53: Asia Pacific Autonomous Underwater Vehicles Revenue Share (%), by Consumption Analysis 2025 & 2033
- Figure 54: Asia Pacific Autonomous Underwater Vehicles Revenue (billion), by Import Market Analysis (Value & Volume) 2025 & 2033
- Figure 55: Asia Pacific Autonomous Underwater Vehicles Revenue Share (%), by Import Market Analysis (Value & Volume) 2025 & 2033
- Figure 56: Asia Pacific Autonomous Underwater Vehicles Revenue (billion), by Export Market Analysis (Value & Volume) 2025 & 2033
- Figure 57: Asia Pacific Autonomous Underwater Vehicles Revenue Share (%), by Export Market Analysis (Value & Volume) 2025 & 2033
- Figure 58: Asia Pacific Autonomous Underwater Vehicles Revenue (billion), by Price Trend Analysis 2025 & 2033
- Figure 59: Asia Pacific Autonomous Underwater Vehicles Revenue Share (%), by Price Trend Analysis 2025 & 2033
- Figure 60: Asia Pacific Autonomous Underwater Vehicles Revenue (billion), by Country 2025 & 2033
- Figure 61: Asia Pacific Autonomous Underwater Vehicles Revenue Share (%), by Country 2025 & 2033
List of Tables
- Table 1: Global Autonomous Underwater Vehicles Revenue billion Forecast, by Production Analysis 2020 & 2033
- Table 2: Global Autonomous Underwater Vehicles Revenue billion Forecast, by Consumption Analysis 2020 & 2033
- Table 3: Global Autonomous Underwater Vehicles Revenue billion Forecast, by Import Market Analysis (Value & Volume) 2020 & 2033
- Table 4: Global Autonomous Underwater Vehicles Revenue billion Forecast, by Export Market Analysis (Value & Volume) 2020 & 2033
- Table 5: Global Autonomous Underwater Vehicles Revenue billion Forecast, by Price Trend Analysis 2020 & 2033
- Table 6: Global Autonomous Underwater Vehicles Revenue billion Forecast, by Region 2020 & 2033
- Table 7: Global Autonomous Underwater Vehicles Revenue billion Forecast, by Production Analysis 2020 & 2033
- Table 8: Global Autonomous Underwater Vehicles Revenue billion Forecast, by Consumption Analysis 2020 & 2033
- Table 9: Global Autonomous Underwater Vehicles Revenue billion Forecast, by Import Market Analysis (Value & Volume) 2020 & 2033
- Table 10: Global Autonomous Underwater Vehicles Revenue billion Forecast, by Export Market Analysis (Value & Volume) 2020 & 2033
- Table 11: Global Autonomous Underwater Vehicles Revenue billion Forecast, by Price Trend Analysis 2020 & 2033
- Table 12: Global Autonomous Underwater Vehicles Revenue billion Forecast, by Country 2020 & 2033
- Table 13: United States Autonomous Underwater Vehicles Revenue (billion) Forecast, by Application 2020 & 2033
- Table 14: Canada Autonomous Underwater Vehicles Revenue (billion) Forecast, by Application 2020 & 2033
- Table 15: Mexico Autonomous Underwater Vehicles Revenue (billion) Forecast, by Application 2020 & 2033
- Table 16: Global Autonomous Underwater Vehicles Revenue billion Forecast, by Production Analysis 2020 & 2033
- Table 17: Global Autonomous Underwater Vehicles Revenue billion Forecast, by Consumption Analysis 2020 & 2033
- Table 18: Global Autonomous Underwater Vehicles Revenue billion Forecast, by Import Market Analysis (Value & Volume) 2020 & 2033
- Table 19: Global Autonomous Underwater Vehicles Revenue billion Forecast, by Export Market Analysis (Value & Volume) 2020 & 2033
- Table 20: Global Autonomous Underwater Vehicles Revenue billion Forecast, by Price Trend Analysis 2020 & 2033
- Table 21: Global Autonomous Underwater Vehicles Revenue billion Forecast, by Country 2020 & 2033
- Table 22: Brazil Autonomous Underwater Vehicles Revenue (billion) Forecast, by Application 2020 & 2033
- Table 23: Argentina Autonomous Underwater Vehicles Revenue (billion) Forecast, by Application 2020 & 2033
- Table 24: Rest of South America Autonomous Underwater Vehicles Revenue (billion) Forecast, by Application 2020 & 2033
- Table 25: Global Autonomous Underwater Vehicles Revenue billion Forecast, by Production Analysis 2020 & 2033
- Table 26: Global Autonomous Underwater Vehicles Revenue billion Forecast, by Consumption Analysis 2020 & 2033
- Table 27: Global Autonomous Underwater Vehicles Revenue billion Forecast, by Import Market Analysis (Value & Volume) 2020 & 2033
- Table 28: Global Autonomous Underwater Vehicles Revenue billion Forecast, by Export Market Analysis (Value & Volume) 2020 & 2033
- Table 29: Global Autonomous Underwater Vehicles Revenue billion Forecast, by Price Trend Analysis 2020 & 2033
- Table 30: Global Autonomous Underwater Vehicles Revenue billion Forecast, by Country 2020 & 2033
- Table 31: United Kingdom Autonomous Underwater Vehicles Revenue (billion) Forecast, by Application 2020 & 2033
- Table 32: Germany Autonomous Underwater Vehicles Revenue (billion) Forecast, by Application 2020 & 2033
- Table 33: France Autonomous Underwater Vehicles Revenue (billion) Forecast, by Application 2020 & 2033
- Table 34: Italy Autonomous Underwater Vehicles Revenue (billion) Forecast, by Application 2020 & 2033
- Table 35: Spain Autonomous Underwater Vehicles Revenue (billion) Forecast, by Application 2020 & 2033
- Table 36: Russia Autonomous Underwater Vehicles Revenue (billion) Forecast, by Application 2020 & 2033
- Table 37: Benelux Autonomous Underwater Vehicles Revenue (billion) Forecast, by Application 2020 & 2033
- Table 38: Nordics Autonomous Underwater Vehicles Revenue (billion) Forecast, by Application 2020 & 2033
- Table 39: Rest of Europe Autonomous Underwater Vehicles Revenue (billion) Forecast, by Application 2020 & 2033
- Table 40: Global Autonomous Underwater Vehicles Revenue billion Forecast, by Production Analysis 2020 & 2033
- Table 41: Global Autonomous Underwater Vehicles Revenue billion Forecast, by Consumption Analysis 2020 & 2033
- Table 42: Global Autonomous Underwater Vehicles Revenue billion Forecast, by Import Market Analysis (Value & Volume) 2020 & 2033
- Table 43: Global Autonomous Underwater Vehicles Revenue billion Forecast, by Export Market Analysis (Value & Volume) 2020 & 2033
- Table 44: Global Autonomous Underwater Vehicles Revenue billion Forecast, by Price Trend Analysis 2020 & 2033
- Table 45: Global Autonomous Underwater Vehicles Revenue billion Forecast, by Country 2020 & 2033
- Table 46: Turkey Autonomous Underwater Vehicles Revenue (billion) Forecast, by Application 2020 & 2033
- Table 47: Israel Autonomous Underwater Vehicles Revenue (billion) Forecast, by Application 2020 & 2033
- Table 48: GCC Autonomous Underwater Vehicles Revenue (billion) Forecast, by Application 2020 & 2033
- Table 49: North Africa Autonomous Underwater Vehicles Revenue (billion) Forecast, by Application 2020 & 2033
- Table 50: South Africa Autonomous Underwater Vehicles Revenue (billion) Forecast, by Application 2020 & 2033
- Table 51: Rest of Middle East & Africa Autonomous Underwater Vehicles Revenue (billion) Forecast, by Application 2020 & 2033
- Table 52: Global Autonomous Underwater Vehicles Revenue billion Forecast, by Production Analysis 2020 & 2033
- Table 53: Global Autonomous Underwater Vehicles Revenue billion Forecast, by Consumption Analysis 2020 & 2033
- Table 54: Global Autonomous Underwater Vehicles Revenue billion Forecast, by Import Market Analysis (Value & Volume) 2020 & 2033
- Table 55: Global Autonomous Underwater Vehicles Revenue billion Forecast, by Export Market Analysis (Value & Volume) 2020 & 2033
- Table 56: Global Autonomous Underwater Vehicles Revenue billion Forecast, by Price Trend Analysis 2020 & 2033
- Table 57: Global Autonomous Underwater Vehicles Revenue billion Forecast, by Country 2020 & 2033
- Table 58: China Autonomous Underwater Vehicles Revenue (billion) Forecast, by Application 2020 & 2033
- Table 59: India Autonomous Underwater Vehicles Revenue (billion) Forecast, by Application 2020 & 2033
- Table 60: Japan Autonomous Underwater Vehicles Revenue (billion) Forecast, by Application 2020 & 2033
- Table 61: South Korea Autonomous Underwater Vehicles Revenue (billion) Forecast, by Application 2020 & 2033
- Table 62: ASEAN Autonomous Underwater Vehicles Revenue (billion) Forecast, by Application 2020 & 2033
- Table 63: Oceania Autonomous Underwater Vehicles Revenue (billion) Forecast, by Application 2020 & 2033
- Table 64: Rest of Asia Pacific Autonomous Underwater Vehicles Revenue (billion) Forecast, by Application 2020 & 2033
Frequently Asked Questions
1. What is the projected Compound Annual Growth Rate (CAGR) of the Autonomous Underwater Vehicles?
The projected CAGR is approximately 20.62%.
2. Which companies are prominent players in the Autonomous Underwater Vehicles?
Key companies in the market include L3Harris Technologies Inc, General Dynamics Corporation, Lockheed Martin Corporation, Kongsberg Gruppen ASA, Exail Technologies S, SAAB AB, BAE Systems plc, Teledyne Technologies Inc, The Boeing Company.
3. What are the main segments of the Autonomous Underwater Vehicles?
The market segments include Production Analysis, Consumption Analysis, Import Market Analysis (Value & Volume), Export Market Analysis (Value & Volume), Price Trend Analysis.
4. Can you provide details about the market size?
The market size is estimated to be USD 2.57 billion as of 2022.
5. What are some drivers contributing to market growth?
Increase in Internet of Things (IoT) and Autonomous Systems; Rise in Demand for Military and Defense Satellite Communication Solutions.
6. What are the notable trends driving market growth?
Military & Defense will a Hold Significant Market Share.
7. Are there any restraints impacting market growth?
Cybersecurity Threats to Satellite Communication; Interference in Transmission of Data.
8. Can you provide examples of recent developments in the market?
February 2024: Kongsberg was awarded a contract with the Defense Innovation Unit (DIU) to rapidly deliver HUGIN Autonomous Underwater Vehicle (AUV) capabilities for the US military.
9. What pricing options are available for accessing the report?
Pricing options include single-user, multi-user, and enterprise licenses priced at USD 4750, USD 5250, and USD 8750 respectively.
10. Is the market size provided in terms of value or volume?
The market size is provided in terms of value, measured in billion.
11. Are there any specific market keywords associated with the report?
Yes, the market keyword associated with the report is "Autonomous Underwater Vehicles," which aids in identifying and referencing the specific market segment covered.
12. How do I determine which pricing option suits my needs best?
The pricing options vary based on user requirements and access needs. Individual users may opt for single-user licenses, while businesses requiring broader access may choose multi-user or enterprise licenses for cost-effective access to the report.
13. Are there any additional resources or data provided in the Autonomous Underwater Vehicles report?
While the report offers comprehensive insights, it's advisable to review the specific contents or supplementary materials provided to ascertain if additional resources or data are available.
14. How can I stay updated on further developments or reports in the Autonomous Underwater Vehicles?
To stay informed about further developments, trends, and reports in the Autonomous Underwater Vehicles, consider subscribing to industry newsletters, following relevant companies and organizations, or regularly checking reputable industry news sources and publications.
Methodology
Step 1 - Identification of Relevant Samples Size from Population Database


Step 2 - Approaches for Defining Global Market Size (Value, Volume* & Price*)

Note*: In applicable scenarios
Step 3 - Data Sources
Primary Research
- Web Analytics
- Survey Reports
- Research Institute
- Latest Research Reports
- Opinion Leaders
Secondary Research
- Annual Reports
- White Paper
- Latest Press Release
- Industry Association
- Paid Database
- Investor Presentations

Step 4 - Data Triangulation
Involves using different sources of information in order to increase the validity of a study
These sources are likely to be stakeholders in a program - participants, other researchers, program staff, other community members, and so on.
Then we put all data in single framework & apply various statistical tools to find out the dynamic on the market.
During the analysis stage, feedback from the stakeholder groups would be compared to determine areas of agreement as well as areas of divergence