

Key Insights
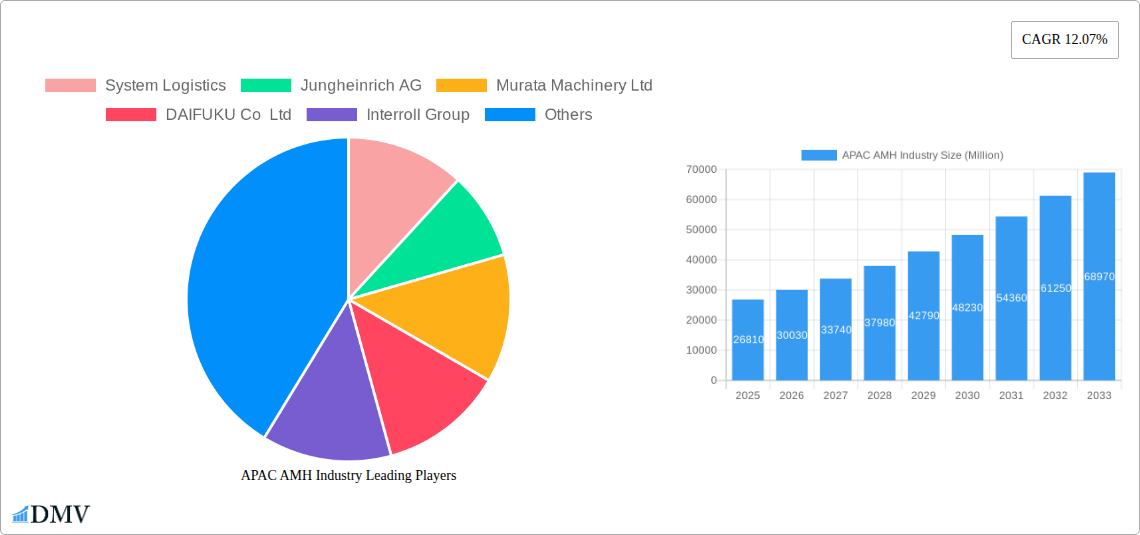
The Asia-Pacific (APAC) automated material handling (AMH) market exhibits robust growth, driven by the region's expanding e-commerce sector, increasing automation adoption across industries, and a burgeoning need for efficient logistics solutions. The market's 2025 value of $26.81 billion, coupled with a Compound Annual Growth Rate (CAGR) of 12.07%, projects substantial expansion through 2033. Key drivers include rising labor costs, the need for improved warehouse efficiency, and the increasing complexity of supply chains. Significant growth is observed in segments like Automated Guided Vehicles (AGVs) and Automated Storage and Retrieval Systems (ASRS), particularly within e-commerce fulfillment centers and manufacturing facilities. China, Japan, India, and South Korea are major contributors to APAC's AMH market, fueled by substantial investments in infrastructure and technological advancements. However, initial high capital expenditures for AMH systems and the need for skilled workforce training remain as potential restraints. The market's segmentation by equipment type (e.g., mobile robots, automated conveyors, robotic sortation systems), end-user vertical (e.g., e-commerce, automotive, food & beverage), and product type (hardware, software, services) allows for targeted strategies and investment opportunities. The increasing adoption of Artificial Intelligence (AI) and Internet of Things (IoT) technologies further enhances the potential for growth in the APAC AMH market.
The diverse nature of the APAC AMH market presents both challenges and opportunities. While countries like China and Japan lead in technological advancement and market size, other nations within the region are experiencing rapid growth, creating a fragmented yet dynamic landscape. This necessitates a differentiated approach by market players, requiring a deep understanding of individual country-specific regulatory frameworks, infrastructure development, and consumer demand. The ongoing development of innovative solutions that address specific industry needs and cater to localized market preferences will be crucial for success. The integration of advanced technologies such as AI, machine learning, and cloud computing within AMH solutions will play a significant role in shaping future market trends, demanding continuous innovation and adaptation from companies within the sector. The long-term forecast suggests that APAC's AMH market will remain a highly competitive and attractive investment destination.
APAC AMH Industry Market Report: 2019-2033
This comprehensive report provides a detailed analysis of the Asia-Pacific (APAC) Automated Material Handling (AMH) industry, offering invaluable insights for stakeholders seeking to navigate this dynamic market. The report covers the period from 2019 to 2033, with a focus on the 2025-2033 forecast period. Market sizing is in Millions.
APAC AMH Industry Market Composition & Trends
This section delves into the intricate structure of the APAC AMH market, examining market concentration, innovative drivers, regulatory frameworks, substitute products, end-user profiles, and merger and acquisition (M&A) activities. The market is characterized by a moderate level of concentration, with key players like System Logistics, Jungheinrich AG, Murata Machinery Ltd, and DAIFUKU Co Ltd holding significant market share. However, the emergence of innovative companies like VisionNav Robotics is disrupting the established order.
The APAC AMH market is experiencing robust growth, driven by factors such as the increasing adoption of e-commerce, automation in manufacturing, and government initiatives promoting Industry 4.0. Regulatory landscapes vary across countries, impacting market entry and operation. Substitute products, such as traditional manual handling methods, are losing ground to the efficiency and cost-effectiveness of AMH solutions.
- Market Share Distribution (2024): DAIFUKU Co Ltd: 15%, KION Group: 12%, System Logistics: 10%, Others: 63%
- M&A Activity (2019-2024): Total deal value estimated at $XX Million, with an average deal size of $XX Million. Deals primarily focused on technology acquisition and geographic expansion.
- Innovation Catalysts: Advancements in robotics, AI, and IoT are driving significant product innovations, improving efficiency and reducing operational costs.
- End-User Profiles: The automotive, e-commerce, and food & beverage sectors are key end-users, driving significant demand for AMH systems.
APAC AMH Industry Industry Evolution
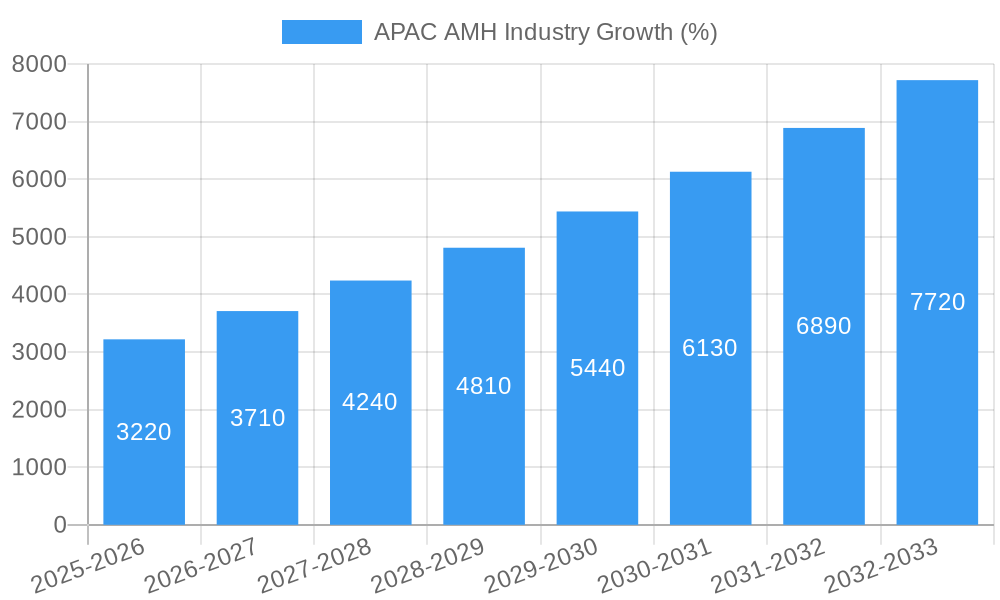
This section examines the evolutionary trajectory of the APAC AMH industry, analyzing market growth, technological progress, and evolving consumer demands. The market witnessed a Compound Annual Growth Rate (CAGR) of XX% during the historical period (2019-2024) and is projected to grow at a CAGR of XX% during the forecast period (2025-2033). This growth is fueled by the increasing adoption of automation across various industries, particularly in response to labor shortages and rising labor costs. Technological advancements, such as the development of autonomous mobile robots (AMRs) and advanced warehouse management systems (WMS), have significantly enhanced efficiency and productivity. The shift towards Industry 4.0 and the increasing need for supply chain optimization are further propelling market growth. Adoption rates of AMRs, for example, are projected to increase by XX% annually.
Leading Regions, Countries, or Segments in APAC AMH Industry
China and Japan dominate the APAC AMH market, accounting for approximately XX% and XX% of the total market value, respectively. Their dominance is driven by robust industrial growth, large manufacturing sectors, and substantial investments in automation technologies. Significant growth is also expected from India and other Southeast Asian countries.
Key Drivers:
- China: Government initiatives promoting automation, massive e-commerce growth, and a large manufacturing base.
- Japan: Advanced technological capabilities, established AMH industry, and high demand from automotive and electronics sectors.
- India: Rapid economic growth, expanding manufacturing sector, and increasing adoption of automation in logistics.
Dominance Factors: Large market size, robust industrial growth, government support for automation initiatives, and a strong technological foundation. The Retail/Warehousing/Distribution Centers/Logistic Centers segment is the largest end-user vertical, accounting for approximately XX% of the market due to the expansion of e-commerce and the need for efficient order fulfillment. Similarly, Automated Guided Vehicles (AGVs) constitute the largest equipment type segment due to their versatility and adaptability to various applications.
APAC AMH Industry Product Innovations
Recent innovations include the development of sophisticated AMRs with advanced AI capabilities, enabling improved navigation, obstacle avoidance, and task execution. The integration of IoT sensors and cloud-based platforms enhances data collection, analysis, and real-time monitoring, facilitating predictive maintenance and operational optimization. These innovations lead to improved throughput, reduced operational costs, and enhanced safety.
Propelling Factors for APAC AMH Industry Growth
Technological advancements, such as the development of sophisticated robotics and AI-powered systems, are a key driver. Economic factors, including rising labor costs and the increasing need for supply chain efficiency, are also propelling growth. Furthermore, government initiatives promoting automation and Industry 4.0 are creating a favorable environment for market expansion.
Obstacles in the APAC AMH Industry Market
High initial investment costs for AMH systems can be a barrier to entry for small and medium-sized enterprises (SMEs). Supply chain disruptions, particularly in the context of global geopolitical uncertainty, can lead to delays and increased costs. Intense competition among established players and emerging companies also poses a challenge.
Future Opportunities in APAP AMH Industry
The increasing adoption of automation in emerging markets like India and Southeast Asia presents significant opportunities. The growing demand for customized AMH solutions tailored to specific industry needs represents another significant area of growth. Furthermore, the integration of cutting-edge technologies such as 5G, AI, and cloud computing will unlock new levels of efficiency and scalability.
Major Players in the APAC AMH Industry Ecosystem
- System Logistics
- Jungheinrich AG
- Murata Machinery Ltd
- DAIFUKU Co Ltd
- Interroll Group
- BEUMER Group GmbH & Co KG
- VisionNav Robotics
- SSI Schaefer AG
- Witron Logistik
- KION Group
- Kardex Group
- JBT Corporation
- Honeywell Intelligrated Inc
- Toyota Industries Corporation
- Kuka AG
Key Developments in APAC AMH Industry Industry
- September 2021: AFT Industries AG and Daifuku of Japan formed a cooperative business agreement, leveraging their material handling expertise in the automotive industry.
- December 2021: KION Group established a new forklift truck manufacturing facility in Jinan, China, expanding its production capacity.
- March 2022: VisionNav Robotics showcased its VNP15 automated forklift at MODEX 2022.
- June 2022: Lodige Industries installed a fully automated air cargo terminal at Chengdu Tianfu International Airport.
- August 2022: Juki Automation Systems (JAS) Inc. planned to exhibit its Autonomous Material Handling System and JM-50 at the SMTA Guadalajara Expo & Tech Forum.
Strategic APAC AMH Industry Market Forecast
The APAC AMH market is poised for significant growth, driven by increasing automation adoption across various sectors, technological innovation, and supportive government policies. The market's future trajectory will be shaped by the continued evolution of robotics, AI, and IoT technologies, which will further enhance the efficiency, flexibility, and intelligence of AMH systems. This creates substantial opportunities for both established players and innovative startups to capitalize on this expanding market. The projected growth in e-commerce and the increasing demand for efficient supply chain solutions will further fuel the expansion of this market segment.
APAC AMH Industry Segmentation
-
1. Product Type
- 1.1. Hardware
- 1.2. Software
- 1.3. Services
-
2. Equipment Type
-
2.1. Mobile Robots
-
2.1.1. Automated Guided Vehicle (AGV)
- 2.1.1.1. Automated Forklift
- 2.1.1.2. Automated Tow/Tractor/Tug
- 2.1.1.3. Unit Load
- 2.1.1.4. Assembly Line
- 2.1.1.5. Special Purpose
- 2.1.2. Autonomous Mobile Robots (AMR)
- 2.1.3. Laser Guided Vehicle
-
2.1.1. Automated Guided Vehicle (AGV)
-
2.2. Automated Storage and Retrieval System (ASRS)
- 2.2.1. Fixed Aisle (Stacker Crane + Shuttle System)
- 2.2.2. Carousel (Horizontal Carousel + Vertical Carousel)
- 2.2.3. Vertical Lift Module
-
2.3. Automated Conveyor
- 2.3.1. Belt
- 2.3.2. Roller
- 2.3.3. Pallet
- 2.3.4. Overhead
-
2.4. Palletizer
- 2.4.1. Conventional (High Level + Low Level)
- 2.4.2. Robotic
- 2.5. Sortation System
-
2.1. Mobile Robots
-
3. End-user Vertical
- 3.1. Airport
- 3.2. Automotive
- 3.3. Food and Beverage
- 3.4. Retail/W
- 3.5. General Manufacturing
- 3.6. Pharmaceuticals
- 3.7. Post and Parcel
- 3.8. Other End-Users
APAC AMH Industry Segmentation By Geography
-
1. North America
- 1.1. United States
- 1.2. Canada
- 1.3. Mexico
-
2. South America
- 2.1. Brazil
- 2.2. Argentina
- 2.3. Rest of South America
-
3. Europe
- 3.1. United Kingdom
- 3.2. Germany
- 3.3. France
- 3.4. Italy
- 3.5. Spain
- 3.6. Russia
- 3.7. Benelux
- 3.8. Nordics
- 3.9. Rest of Europe
-
4. Middle East & Africa
- 4.1. Turkey
- 4.2. Israel
- 4.3. GCC
- 4.4. North Africa
- 4.5. South Africa
- 4.6. Rest of Middle East & Africa
-
5. Asia Pacific
- 5.1. China
- 5.2. India
- 5.3. Japan
- 5.4. South Korea
- 5.5. ASEAN
- 5.6. Oceania
- 5.7. Rest of Asia Pacific
APAC AMH Industry REPORT HIGHLIGHTS
| Aspects | Details |
|---|---|
| Study Period | 2019-2033 |
| Base Year | 2024 |
| Estimated Year | 2025 |
| Forecast Period | 2025-2033 |
| Historical Period | 2019-2024 |
| Growth Rate | CAGR of 12.07% from 2019-2033 |
| Segmentation |
|
Table of Contents
- 1. Introduction
- 1.1. Research Scope
- 1.2. Market Segmentation
- 1.3. Research Methodology
- 1.4. Definitions and Assumptions
- 2. Executive Summary
- 2.1. Introduction
- 3. Market Dynamics
- 3.1. Introduction
- 3.2. Market Drivers
- 3.2.1. Increasing Technological Advancments Aiding Market Growth; Industry 4.0 Investments Driving The Demand For Automation And Material Handling; Rapid Growth In E-commerce
- 3.3. Market Restrains
- 3.3.1. High Initial Costs; Unavailability Of Skilled Workforce
- 3.4. Market Trends
- 3.4.1. Airports to Hold a Dominant Market Share
- 4. Market Factor Analysis
- 4.1. Porters Five Forces
- 4.2. Supply/Value Chain
- 4.3. PESTEL analysis
- 4.4. Market Entropy
- 4.5. Patent/Trademark Analysis
- 5. Global APAC AMH Industry Analysis, Insights and Forecast, 2019-2031
- 5.1. Market Analysis, Insights and Forecast - by Product Type
- 5.1.1. Hardware
- 5.1.2. Software
- 5.1.3. Services
- 5.2. Market Analysis, Insights and Forecast - by Equipment Type
- 5.2.1. Mobile Robots
- 5.2.1.1. Automated Guided Vehicle (AGV)
- 5.2.1.1.1. Automated Forklift
- 5.2.1.1.2. Automated Tow/Tractor/Tug
- 5.2.1.1.3. Unit Load
- 5.2.1.1.4. Assembly Line
- 5.2.1.1.5. Special Purpose
- 5.2.1.2. Autonomous Mobile Robots (AMR)
- 5.2.1.3. Laser Guided Vehicle
- 5.2.1.1. Automated Guided Vehicle (AGV)
- 5.2.2. Automated Storage and Retrieval System (ASRS)
- 5.2.2.1. Fixed Aisle (Stacker Crane + Shuttle System)
- 5.2.2.2. Carousel (Horizontal Carousel + Vertical Carousel)
- 5.2.2.3. Vertical Lift Module
- 5.2.3. Automated Conveyor
- 5.2.3.1. Belt
- 5.2.3.2. Roller
- 5.2.3.3. Pallet
- 5.2.3.4. Overhead
- 5.2.4. Palletizer
- 5.2.4.1. Conventional (High Level + Low Level)
- 5.2.4.2. Robotic
- 5.2.5. Sortation System
- 5.2.1. Mobile Robots
- 5.3. Market Analysis, Insights and Forecast - by End-user Vertical
- 5.3.1. Airport
- 5.3.2. Automotive
- 5.3.3. Food and Beverage
- 5.3.4. Retail/W
- 5.3.5. General Manufacturing
- 5.3.6. Pharmaceuticals
- 5.3.7. Post and Parcel
- 5.3.8. Other End-Users
- 5.4. Market Analysis, Insights and Forecast - by Region
- 5.4.1. North America
- 5.4.2. South America
- 5.4.3. Europe
- 5.4.4. Middle East & Africa
- 5.4.5. Asia Pacific
- 5.1. Market Analysis, Insights and Forecast - by Product Type
- 6. North America APAC AMH Industry Analysis, Insights and Forecast, 2019-2031
- 6.1. Market Analysis, Insights and Forecast - by Product Type
- 6.1.1. Hardware
- 6.1.2. Software
- 6.1.3. Services
- 6.2. Market Analysis, Insights and Forecast - by Equipment Type
- 6.2.1. Mobile Robots
- 6.2.1.1. Automated Guided Vehicle (AGV)
- 6.2.1.1.1. Automated Forklift
- 6.2.1.1.2. Automated Tow/Tractor/Tug
- 6.2.1.1.3. Unit Load
- 6.2.1.1.4. Assembly Line
- 6.2.1.1.5. Special Purpose
- 6.2.1.2. Autonomous Mobile Robots (AMR)
- 6.2.1.3. Laser Guided Vehicle
- 6.2.1.1. Automated Guided Vehicle (AGV)
- 6.2.2. Automated Storage and Retrieval System (ASRS)
- 6.2.2.1. Fixed Aisle (Stacker Crane + Shuttle System)
- 6.2.2.2. Carousel (Horizontal Carousel + Vertical Carousel)
- 6.2.2.3. Vertical Lift Module
- 6.2.3. Automated Conveyor
- 6.2.3.1. Belt
- 6.2.3.2. Roller
- 6.2.3.3. Pallet
- 6.2.3.4. Overhead
- 6.2.4. Palletizer
- 6.2.4.1. Conventional (High Level + Low Level)
- 6.2.4.2. Robotic
- 6.2.5. Sortation System
- 6.2.1. Mobile Robots
- 6.3. Market Analysis, Insights and Forecast - by End-user Vertical
- 6.3.1. Airport
- 6.3.2. Automotive
- 6.3.3. Food and Beverage
- 6.3.4. Retail/W
- 6.3.5. General Manufacturing
- 6.3.6. Pharmaceuticals
- 6.3.7. Post and Parcel
- 6.3.8. Other End-Users
- 6.1. Market Analysis, Insights and Forecast - by Product Type
- 7. South America APAC AMH Industry Analysis, Insights and Forecast, 2019-2031
- 7.1. Market Analysis, Insights and Forecast - by Product Type
- 7.1.1. Hardware
- 7.1.2. Software
- 7.1.3. Services
- 7.2. Market Analysis, Insights and Forecast - by Equipment Type
- 7.2.1. Mobile Robots
- 7.2.1.1. Automated Guided Vehicle (AGV)
- 7.2.1.1.1. Automated Forklift
- 7.2.1.1.2. Automated Tow/Tractor/Tug
- 7.2.1.1.3. Unit Load
- 7.2.1.1.4. Assembly Line
- 7.2.1.1.5. Special Purpose
- 7.2.1.2. Autonomous Mobile Robots (AMR)
- 7.2.1.3. Laser Guided Vehicle
- 7.2.1.1. Automated Guided Vehicle (AGV)
- 7.2.2. Automated Storage and Retrieval System (ASRS)
- 7.2.2.1. Fixed Aisle (Stacker Crane + Shuttle System)
- 7.2.2.2. Carousel (Horizontal Carousel + Vertical Carousel)
- 7.2.2.3. Vertical Lift Module
- 7.2.3. Automated Conveyor
- 7.2.3.1. Belt
- 7.2.3.2. Roller
- 7.2.3.3. Pallet
- 7.2.3.4. Overhead
- 7.2.4. Palletizer
- 7.2.4.1. Conventional (High Level + Low Level)
- 7.2.4.2. Robotic
- 7.2.5. Sortation System
- 7.2.1. Mobile Robots
- 7.3. Market Analysis, Insights and Forecast - by End-user Vertical
- 7.3.1. Airport
- 7.3.2. Automotive
- 7.3.3. Food and Beverage
- 7.3.4. Retail/W
- 7.3.5. General Manufacturing
- 7.3.6. Pharmaceuticals
- 7.3.7. Post and Parcel
- 7.3.8. Other End-Users
- 7.1. Market Analysis, Insights and Forecast - by Product Type
- 8. Europe APAC AMH Industry Analysis, Insights and Forecast, 2019-2031
- 8.1. Market Analysis, Insights and Forecast - by Product Type
- 8.1.1. Hardware
- 8.1.2. Software
- 8.1.3. Services
- 8.2. Market Analysis, Insights and Forecast - by Equipment Type
- 8.2.1. Mobile Robots
- 8.2.1.1. Automated Guided Vehicle (AGV)
- 8.2.1.1.1. Automated Forklift
- 8.2.1.1.2. Automated Tow/Tractor/Tug
- 8.2.1.1.3. Unit Load
- 8.2.1.1.4. Assembly Line
- 8.2.1.1.5. Special Purpose
- 8.2.1.2. Autonomous Mobile Robots (AMR)
- 8.2.1.3. Laser Guided Vehicle
- 8.2.1.1. Automated Guided Vehicle (AGV)
- 8.2.2. Automated Storage and Retrieval System (ASRS)
- 8.2.2.1. Fixed Aisle (Stacker Crane + Shuttle System)
- 8.2.2.2. Carousel (Horizontal Carousel + Vertical Carousel)
- 8.2.2.3. Vertical Lift Module
- 8.2.3. Automated Conveyor
- 8.2.3.1. Belt
- 8.2.3.2. Roller
- 8.2.3.3. Pallet
- 8.2.3.4. Overhead
- 8.2.4. Palletizer
- 8.2.4.1. Conventional (High Level + Low Level)
- 8.2.4.2. Robotic
- 8.2.5. Sortation System
- 8.2.1. Mobile Robots
- 8.3. Market Analysis, Insights and Forecast - by End-user Vertical
- 8.3.1. Airport
- 8.3.2. Automotive
- 8.3.3. Food and Beverage
- 8.3.4. Retail/W
- 8.3.5. General Manufacturing
- 8.3.6. Pharmaceuticals
- 8.3.7. Post and Parcel
- 8.3.8. Other End-Users
- 8.1. Market Analysis, Insights and Forecast - by Product Type
- 9. Middle East & Africa APAC AMH Industry Analysis, Insights and Forecast, 2019-2031
- 9.1. Market Analysis, Insights and Forecast - by Product Type
- 9.1.1. Hardware
- 9.1.2. Software
- 9.1.3. Services
- 9.2. Market Analysis, Insights and Forecast - by Equipment Type
- 9.2.1. Mobile Robots
- 9.2.1.1. Automated Guided Vehicle (AGV)
- 9.2.1.1.1. Automated Forklift
- 9.2.1.1.2. Automated Tow/Tractor/Tug
- 9.2.1.1.3. Unit Load
- 9.2.1.1.4. Assembly Line
- 9.2.1.1.5. Special Purpose
- 9.2.1.2. Autonomous Mobile Robots (AMR)
- 9.2.1.3. Laser Guided Vehicle
- 9.2.1.1. Automated Guided Vehicle (AGV)
- 9.2.2. Automated Storage and Retrieval System (ASRS)
- 9.2.2.1. Fixed Aisle (Stacker Crane + Shuttle System)
- 9.2.2.2. Carousel (Horizontal Carousel + Vertical Carousel)
- 9.2.2.3. Vertical Lift Module
- 9.2.3. Automated Conveyor
- 9.2.3.1. Belt
- 9.2.3.2. Roller
- 9.2.3.3. Pallet
- 9.2.3.4. Overhead
- 9.2.4. Palletizer
- 9.2.4.1. Conventional (High Level + Low Level)
- 9.2.4.2. Robotic
- 9.2.5. Sortation System
- 9.2.1. Mobile Robots
- 9.3. Market Analysis, Insights and Forecast - by End-user Vertical
- 9.3.1. Airport
- 9.3.2. Automotive
- 9.3.3. Food and Beverage
- 9.3.4. Retail/W
- 9.3.5. General Manufacturing
- 9.3.6. Pharmaceuticals
- 9.3.7. Post and Parcel
- 9.3.8. Other End-Users
- 9.1. Market Analysis, Insights and Forecast - by Product Type
- 10. Asia Pacific APAC AMH Industry Analysis, Insights and Forecast, 2019-2031
- 10.1. Market Analysis, Insights and Forecast - by Product Type
- 10.1.1. Hardware
- 10.1.2. Software
- 10.1.3. Services
- 10.2. Market Analysis, Insights and Forecast - by Equipment Type
- 10.2.1. Mobile Robots
- 10.2.1.1. Automated Guided Vehicle (AGV)
- 10.2.1.1.1. Automated Forklift
- 10.2.1.1.2. Automated Tow/Tractor/Tug
- 10.2.1.1.3. Unit Load
- 10.2.1.1.4. Assembly Line
- 10.2.1.1.5. Special Purpose
- 10.2.1.2. Autonomous Mobile Robots (AMR)
- 10.2.1.3. Laser Guided Vehicle
- 10.2.1.1. Automated Guided Vehicle (AGV)
- 10.2.2. Automated Storage and Retrieval System (ASRS)
- 10.2.2.1. Fixed Aisle (Stacker Crane + Shuttle System)
- 10.2.2.2. Carousel (Horizontal Carousel + Vertical Carousel)
- 10.2.2.3. Vertical Lift Module
- 10.2.3. Automated Conveyor
- 10.2.3.1. Belt
- 10.2.3.2. Roller
- 10.2.3.3. Pallet
- 10.2.3.4. Overhead
- 10.2.4. Palletizer
- 10.2.4.1. Conventional (High Level + Low Level)
- 10.2.4.2. Robotic
- 10.2.5. Sortation System
- 10.2.1. Mobile Robots
- 10.3. Market Analysis, Insights and Forecast - by End-user Vertical
- 10.3.1. Airport
- 10.3.2. Automotive
- 10.3.3. Food and Beverage
- 10.3.4. Retail/W
- 10.3.5. General Manufacturing
- 10.3.6. Pharmaceuticals
- 10.3.7. Post and Parcel
- 10.3.8. Other End-Users
- 10.1. Market Analysis, Insights and Forecast - by Product Type
- 11. North America APAC AMH Industry Analysis, Insights and Forecast, 2019-2031
- 11.1. Market Analysis, Insights and Forecast - By Country/Sub-region
- 11.1.1 United States
- 11.1.2 Canada
- 12. Europe APAC AMH Industry Analysis, Insights and Forecast, 2019-2031
- 12.1. Market Analysis, Insights and Forecast - By Country/Sub-region
- 12.1.1 United Kingdom
- 12.1.2 France
- 12.1.3 Italy
- 12.1.4 Germany
- 12.1.5 Rest of Europe
- 13. Asia Pacific APAC AMH Industry Analysis, Insights and Forecast, 2019-2031
- 13.1. Market Analysis, Insights and Forecast - By Country/Sub-region
- 13.1.1 China
- 13.1.2 Japan
- 13.1.3 India
- 13.1.4 Rest of Asia Pacific
- 14. Latin America APAC AMH Industry Analysis, Insights and Forecast, 2019-2031
- 14.1. Market Analysis, Insights and Forecast - By Country/Sub-region
- 14.1.1 Brazil
- 14.1.2 Argentina
- 14.1.3 Mexico
- 14.1.4 Rest of Latin America
- 15. Middle East and Africa APAC AMH Industry Analysis, Insights and Forecast, 2019-2031
- 15.1. Market Analysis, Insights and Forecast - By Country/Sub-region
- 15.1.1 South Africa
- 15.1.2 Israel
- 15.1.3 Saudi Arabia
- 15.1.4 Rest of Middle East and Africa
- 16. Competitive Analysis
- 16.1. Global Market Share Analysis 2024
- 16.2. Company Profiles
- 16.2.1 System Logistics
- 16.2.1.1. Overview
- 16.2.1.2. Products
- 16.2.1.3. SWOT Analysis
- 16.2.1.4. Recent Developments
- 16.2.1.5. Financials (Based on Availability)
- 16.2.2 Jungheinrich AG
- 16.2.2.1. Overview
- 16.2.2.2. Products
- 16.2.2.3. SWOT Analysis
- 16.2.2.4. Recent Developments
- 16.2.2.5. Financials (Based on Availability)
- 16.2.3 Murata Machinery Ltd
- 16.2.3.1. Overview
- 16.2.3.2. Products
- 16.2.3.3. SWOT Analysis
- 16.2.3.4. Recent Developments
- 16.2.3.5. Financials (Based on Availability)
- 16.2.4 DAIFUKU Co Ltd
- 16.2.4.1. Overview
- 16.2.4.2. Products
- 16.2.4.3. SWOT Analysis
- 16.2.4.4. Recent Developments
- 16.2.4.5. Financials (Based on Availability)
- 16.2.5 Interroll Group
- 16.2.5.1. Overview
- 16.2.5.2. Products
- 16.2.5.3. SWOT Analysis
- 16.2.5.4. Recent Developments
- 16.2.5.5. Financials (Based on Availability)
- 16.2.6 BEUMER Group GmbH & Co KG
- 16.2.6.1. Overview
- 16.2.6.2. Products
- 16.2.6.3. SWOT Analysis
- 16.2.6.4. Recent Developments
- 16.2.6.5. Financials (Based on Availability)
- 16.2.7 VisionNav Robotics
- 16.2.7.1. Overview
- 16.2.7.2. Products
- 16.2.7.3. SWOT Analysis
- 16.2.7.4. Recent Developments
- 16.2.7.5. Financials (Based on Availability)
- 16.2.8 SSI Schaefer AG
- 16.2.8.1. Overview
- 16.2.8.2. Products
- 16.2.8.3. SWOT Analysis
- 16.2.8.4. Recent Developments
- 16.2.8.5. Financials (Based on Availability)
- 16.2.9 Witron Logistik
- 16.2.9.1. Overview
- 16.2.9.2. Products
- 16.2.9.3. SWOT Analysis
- 16.2.9.4. Recent Developments
- 16.2.9.5. Financials (Based on Availability)
- 16.2.10 KION Group
- 16.2.10.1. Overview
- 16.2.10.2. Products
- 16.2.10.3. SWOT Analysis
- 16.2.10.4. Recent Developments
- 16.2.10.5. Financials (Based on Availability)
- 16.2.11 Kardex Group
- 16.2.11.1. Overview
- 16.2.11.2. Products
- 16.2.11.3. SWOT Analysis
- 16.2.11.4. Recent Developments
- 16.2.11.5. Financials (Based on Availability)
- 16.2.12 JBT Corporation
- 16.2.12.1. Overview
- 16.2.12.2. Products
- 16.2.12.3. SWOT Analysis
- 16.2.12.4. Recent Developments
- 16.2.12.5. Financials (Based on Availability)
- 16.2.13 Honeywell Intelligrated Inc
- 16.2.13.1. Overview
- 16.2.13.2. Products
- 16.2.13.3. SWOT Analysis
- 16.2.13.4. Recent Developments
- 16.2.13.5. Financials (Based on Availability)
- 16.2.14 Toyota Industries Corporation
- 16.2.14.1. Overview
- 16.2.14.2. Products
- 16.2.14.3. SWOT Analysis
- 16.2.14.4. Recent Developments
- 16.2.14.5. Financials (Based on Availability)
- 16.2.15 Kuka AG
- 16.2.15.1. Overview
- 16.2.15.2. Products
- 16.2.15.3. SWOT Analysis
- 16.2.15.4. Recent Developments
- 16.2.15.5. Financials (Based on Availability)
- 16.2.1 System Logistics
List of Figures
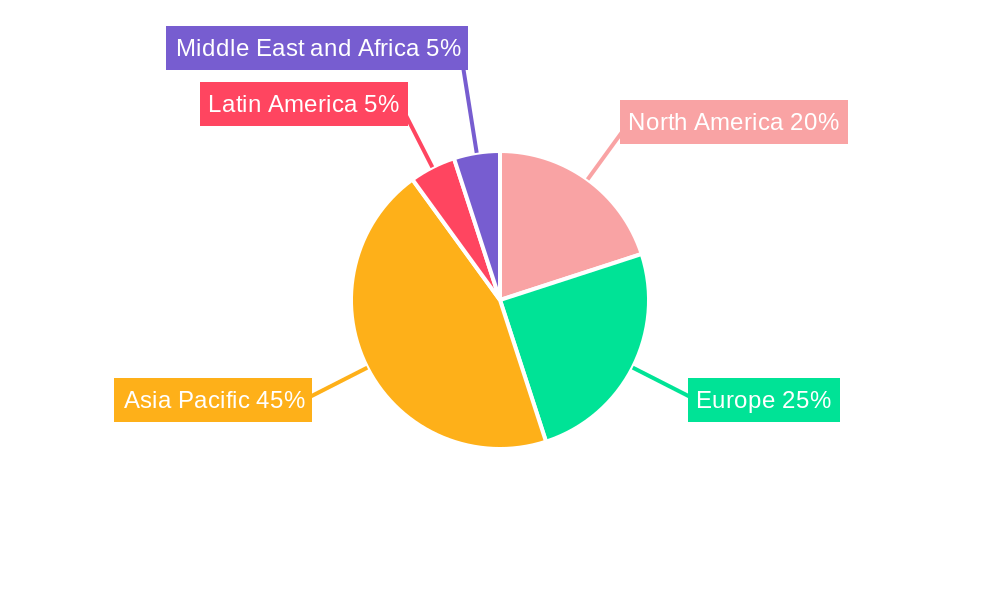
- Figure 1: Global APAC AMH Industry Revenue Breakdown (Million, %) by Region 2024 & 2032
- Figure 2: North America APAC AMH Industry Revenue (Million), by Country 2024 & 2032
- Figure 3: North America APAC AMH Industry Revenue Share (%), by Country 2024 & 2032
- Figure 4: Europe APAC AMH Industry Revenue (Million), by Country 2024 & 2032
- Figure 5: Europe APAC AMH Industry Revenue Share (%), by Country 2024 & 2032
- Figure 6: Asia Pacific APAC AMH Industry Revenue (Million), by Country 2024 & 2032
- Figure 7: Asia Pacific APAC AMH Industry Revenue Share (%), by Country 2024 & 2032
- Figure 8: Latin America APAC AMH Industry Revenue (Million), by Country 2024 & 2032
- Figure 9: Latin America APAC AMH Industry Revenue Share (%), by Country 2024 & 2032
- Figure 10: Middle East and Africa APAC AMH Industry Revenue (Million), by Country 2024 & 2032
- Figure 11: Middle East and Africa APAC AMH Industry Revenue Share (%), by Country 2024 & 2032
- Figure 12: North America APAC AMH Industry Revenue (Million), by Product Type 2024 & 2032
- Figure 13: North America APAC AMH Industry Revenue Share (%), by Product Type 2024 & 2032
- Figure 14: North America APAC AMH Industry Revenue (Million), by Equipment Type 2024 & 2032
- Figure 15: North America APAC AMH Industry Revenue Share (%), by Equipment Type 2024 & 2032
- Figure 16: North America APAC AMH Industry Revenue (Million), by End-user Vertical 2024 & 2032
- Figure 17: North America APAC AMH Industry Revenue Share (%), by End-user Vertical 2024 & 2032
- Figure 18: North America APAC AMH Industry Revenue (Million), by Country 2024 & 2032
- Figure 19: North America APAC AMH Industry Revenue Share (%), by Country 2024 & 2032
- Figure 20: South America APAC AMH Industry Revenue (Million), by Product Type 2024 & 2032
- Figure 21: South America APAC AMH Industry Revenue Share (%), by Product Type 2024 & 2032
- Figure 22: South America APAC AMH Industry Revenue (Million), by Equipment Type 2024 & 2032
- Figure 23: South America APAC AMH Industry Revenue Share (%), by Equipment Type 2024 & 2032
- Figure 24: South America APAC AMH Industry Revenue (Million), by End-user Vertical 2024 & 2032
- Figure 25: South America APAC AMH Industry Revenue Share (%), by End-user Vertical 2024 & 2032
- Figure 26: South America APAC AMH Industry Revenue (Million), by Country 2024 & 2032
- Figure 27: South America APAC AMH Industry Revenue Share (%), by Country 2024 & 2032
- Figure 28: Europe APAC AMH Industry Revenue (Million), by Product Type 2024 & 2032
- Figure 29: Europe APAC AMH Industry Revenue Share (%), by Product Type 2024 & 2032
- Figure 30: Europe APAC AMH Industry Revenue (Million), by Equipment Type 2024 & 2032
- Figure 31: Europe APAC AMH Industry Revenue Share (%), by Equipment Type 2024 & 2032
- Figure 32: Europe APAC AMH Industry Revenue (Million), by End-user Vertical 2024 & 2032
- Figure 33: Europe APAC AMH Industry Revenue Share (%), by End-user Vertical 2024 & 2032
- Figure 34: Europe APAC AMH Industry Revenue (Million), by Country 2024 & 2032
- Figure 35: Europe APAC AMH Industry Revenue Share (%), by Country 2024 & 2032
- Figure 36: Middle East & Africa APAC AMH Industry Revenue (Million), by Product Type 2024 & 2032
- Figure 37: Middle East & Africa APAC AMH Industry Revenue Share (%), by Product Type 2024 & 2032
- Figure 38: Middle East & Africa APAC AMH Industry Revenue (Million), by Equipment Type 2024 & 2032
- Figure 39: Middle East & Africa APAC AMH Industry Revenue Share (%), by Equipment Type 2024 & 2032
- Figure 40: Middle East & Africa APAC AMH Industry Revenue (Million), by End-user Vertical 2024 & 2032
- Figure 41: Middle East & Africa APAC AMH Industry Revenue Share (%), by End-user Vertical 2024 & 2032
- Figure 42: Middle East & Africa APAC AMH Industry Revenue (Million), by Country 2024 & 2032
- Figure 43: Middle East & Africa APAC AMH Industry Revenue Share (%), by Country 2024 & 2032
- Figure 44: Asia Pacific APAC AMH Industry Revenue (Million), by Product Type 2024 & 2032
- Figure 45: Asia Pacific APAC AMH Industry Revenue Share (%), by Product Type 2024 & 2032
- Figure 46: Asia Pacific APAC AMH Industry Revenue (Million), by Equipment Type 2024 & 2032
- Figure 47: Asia Pacific APAC AMH Industry Revenue Share (%), by Equipment Type 2024 & 2032
- Figure 48: Asia Pacific APAC AMH Industry Revenue (Million), by End-user Vertical 2024 & 2032
- Figure 49: Asia Pacific APAC AMH Industry Revenue Share (%), by End-user Vertical 2024 & 2032
- Figure 50: Asia Pacific APAC AMH Industry Revenue (Million), by Country 2024 & 2032
- Figure 51: Asia Pacific APAC AMH Industry Revenue Share (%), by Country 2024 & 2032
List of Tables
- Table 1: Global APAC AMH Industry Revenue Million Forecast, by Region 2019 & 2032
- Table 2: Global APAC AMH Industry Revenue Million Forecast, by Product Type 2019 & 2032
- Table 3: Global APAC AMH Industry Revenue Million Forecast, by Equipment Type 2019 & 2032
- Table 4: Global APAC AMH Industry Revenue Million Forecast, by End-user Vertical 2019 & 2032
- Table 5: Global APAC AMH Industry Revenue Million Forecast, by Region 2019 & 2032
- Table 6: Global APAC AMH Industry Revenue Million Forecast, by Country 2019 & 2032
- Table 7: United States APAC AMH Industry Revenue (Million) Forecast, by Application 2019 & 2032
- Table 8: Canada APAC AMH Industry Revenue (Million) Forecast, by Application 2019 & 2032
- Table 9: Global APAC AMH Industry Revenue Million Forecast, by Country 2019 & 2032
- Table 10: United Kingdom APAC AMH Industry Revenue (Million) Forecast, by Application 2019 & 2032
- Table 11: France APAC AMH Industry Revenue (Million) Forecast, by Application 2019 & 2032
- Table 12: Italy APAC AMH Industry Revenue (Million) Forecast, by Application 2019 & 2032
- Table 13: Germany APAC AMH Industry Revenue (Million) Forecast, by Application 2019 & 2032
- Table 14: Rest of Europe APAC AMH Industry Revenue (Million) Forecast, by Application 2019 & 2032
- Table 15: Global APAC AMH Industry Revenue Million Forecast, by Country 2019 & 2032
- Table 16: China APAC AMH Industry Revenue (Million) Forecast, by Application 2019 & 2032
- Table 17: Japan APAC AMH Industry Revenue (Million) Forecast, by Application 2019 & 2032
- Table 18: India APAC AMH Industry Revenue (Million) Forecast, by Application 2019 & 2032
- Table 19: Rest of Asia Pacific APAC AMH Industry Revenue (Million) Forecast, by Application 2019 & 2032
- Table 20: Global APAC AMH Industry Revenue Million Forecast, by Country 2019 & 2032
- Table 21: Brazil APAC AMH Industry Revenue (Million) Forecast, by Application 2019 & 2032
- Table 22: Argentina APAC AMH Industry Revenue (Million) Forecast, by Application 2019 & 2032
- Table 23: Mexico APAC AMH Industry Revenue (Million) Forecast, by Application 2019 & 2032
- Table 24: Rest of Latin America APAC AMH Industry Revenue (Million) Forecast, by Application 2019 & 2032
- Table 25: Global APAC AMH Industry Revenue Million Forecast, by Country 2019 & 2032
- Table 26: South Africa APAC AMH Industry Revenue (Million) Forecast, by Application 2019 & 2032
- Table 27: Israel APAC AMH Industry Revenue (Million) Forecast, by Application 2019 & 2032
- Table 28: Saudi Arabia APAC AMH Industry Revenue (Million) Forecast, by Application 2019 & 2032
- Table 29: Rest of Middle East and Africa APAC AMH Industry Revenue (Million) Forecast, by Application 2019 & 2032
- Table 30: Global APAC AMH Industry Revenue Million Forecast, by Product Type 2019 & 2032
- Table 31: Global APAC AMH Industry Revenue Million Forecast, by Equipment Type 2019 & 2032
- Table 32: Global APAC AMH Industry Revenue Million Forecast, by End-user Vertical 2019 & 2032
- Table 33: Global APAC AMH Industry Revenue Million Forecast, by Country 2019 & 2032
- Table 34: United States APAC AMH Industry Revenue (Million) Forecast, by Application 2019 & 2032
- Table 35: Canada APAC AMH Industry Revenue (Million) Forecast, by Application 2019 & 2032
- Table 36: Mexico APAC AMH Industry Revenue (Million) Forecast, by Application 2019 & 2032
- Table 37: Global APAC AMH Industry Revenue Million Forecast, by Product Type 2019 & 2032
- Table 38: Global APAC AMH Industry Revenue Million Forecast, by Equipment Type 2019 & 2032
- Table 39: Global APAC AMH Industry Revenue Million Forecast, by End-user Vertical 2019 & 2032
- Table 40: Global APAC AMH Industry Revenue Million Forecast, by Country 2019 & 2032
- Table 41: Brazil APAC AMH Industry Revenue (Million) Forecast, by Application 2019 & 2032
- Table 42: Argentina APAC AMH Industry Revenue (Million) Forecast, by Application 2019 & 2032
- Table 43: Rest of South America APAC AMH Industry Revenue (Million) Forecast, by Application 2019 & 2032
- Table 44: Global APAC AMH Industry Revenue Million Forecast, by Product Type 2019 & 2032
- Table 45: Global APAC AMH Industry Revenue Million Forecast, by Equipment Type 2019 & 2032
- Table 46: Global APAC AMH Industry Revenue Million Forecast, by End-user Vertical 2019 & 2032
- Table 47: Global APAC AMH Industry Revenue Million Forecast, by Country 2019 & 2032
- Table 48: United Kingdom APAC AMH Industry Revenue (Million) Forecast, by Application 2019 & 2032
- Table 49: Germany APAC AMH Industry Revenue (Million) Forecast, by Application 2019 & 2032
- Table 50: France APAC AMH Industry Revenue (Million) Forecast, by Application 2019 & 2032
- Table 51: Italy APAC AMH Industry Revenue (Million) Forecast, by Application 2019 & 2032
- Table 52: Spain APAC AMH Industry Revenue (Million) Forecast, by Application 2019 & 2032
- Table 53: Russia APAC AMH Industry Revenue (Million) Forecast, by Application 2019 & 2032
- Table 54: Benelux APAC AMH Industry Revenue (Million) Forecast, by Application 2019 & 2032
- Table 55: Nordics APAC AMH Industry Revenue (Million) Forecast, by Application 2019 & 2032
- Table 56: Rest of Europe APAC AMH Industry Revenue (Million) Forecast, by Application 2019 & 2032
- Table 57: Global APAC AMH Industry Revenue Million Forecast, by Product Type 2019 & 2032
- Table 58: Global APAC AMH Industry Revenue Million Forecast, by Equipment Type 2019 & 2032
- Table 59: Global APAC AMH Industry Revenue Million Forecast, by End-user Vertical 2019 & 2032
- Table 60: Global APAC AMH Industry Revenue Million Forecast, by Country 2019 & 2032
- Table 61: Turkey APAC AMH Industry Revenue (Million) Forecast, by Application 2019 & 2032
- Table 62: Israel APAC AMH Industry Revenue (Million) Forecast, by Application 2019 & 2032
- Table 63: GCC APAC AMH Industry Revenue (Million) Forecast, by Application 2019 & 2032
- Table 64: North Africa APAC AMH Industry Revenue (Million) Forecast, by Application 2019 & 2032
- Table 65: South Africa APAC AMH Industry Revenue (Million) Forecast, by Application 2019 & 2032
- Table 66: Rest of Middle East & Africa APAC AMH Industry Revenue (Million) Forecast, by Application 2019 & 2032
- Table 67: Global APAC AMH Industry Revenue Million Forecast, by Product Type 2019 & 2032
- Table 68: Global APAC AMH Industry Revenue Million Forecast, by Equipment Type 2019 & 2032
- Table 69: Global APAC AMH Industry Revenue Million Forecast, by End-user Vertical 2019 & 2032
- Table 70: Global APAC AMH Industry Revenue Million Forecast, by Country 2019 & 2032
- Table 71: China APAC AMH Industry Revenue (Million) Forecast, by Application 2019 & 2032
- Table 72: India APAC AMH Industry Revenue (Million) Forecast, by Application 2019 & 2032
- Table 73: Japan APAC AMH Industry Revenue (Million) Forecast, by Application 2019 & 2032
- Table 74: South Korea APAC AMH Industry Revenue (Million) Forecast, by Application 2019 & 2032
- Table 75: ASEAN APAC AMH Industry Revenue (Million) Forecast, by Application 2019 & 2032
- Table 76: Oceania APAC AMH Industry Revenue (Million) Forecast, by Application 2019 & 2032
- Table 77: Rest of Asia Pacific APAC AMH Industry Revenue (Million) Forecast, by Application 2019 & 2032
Frequently Asked Questions
1. What is the projected Compound Annual Growth Rate (CAGR) of the APAC AMH Industry?
The projected CAGR is approximately 12.07%.
2. Which companies are prominent players in the APAC AMH Industry?
Key companies in the market include System Logistics, Jungheinrich AG, Murata Machinery Ltd, DAIFUKU Co Ltd, Interroll Group, BEUMER Group GmbH & Co KG, VisionNav Robotics, SSI Schaefer AG, Witron Logistik, KION Group, Kardex Group, JBT Corporation, Honeywell Intelligrated Inc, Toyota Industries Corporation, Kuka AG.
3. What are the main segments of the APAC AMH Industry?
The market segments include Product Type, Equipment Type, End-user Vertical.
4. Can you provide details about the market size?
The market size is estimated to be USD 26.81 Million as of 2022.
5. What are some drivers contributing to market growth?
Increasing Technological Advancments Aiding Market Growth; Industry 4.0 Investments Driving The Demand For Automation And Material Handling; Rapid Growth In E-commerce.
6. What are the notable trends driving market growth?
Airports to Hold a Dominant Market Share.
7. Are there any restraints impacting market growth?
High Initial Costs; Unavailability Of Skilled Workforce.
8. Can you provide examples of recent developments in the market?
August 2022 - Juki Automation Systems (JAS), Inc., a world-leading provider of automated assembly products and systems, announced plans to exhibit at the SMTA Guadalajara Expo & Tech Forum to demonstrate the award-winning Autonomous Material Handling System and JM-50 to demonstrate the award-winning Autonomous Material Handling System and JM-50.
9. What pricing options are available for accessing the report?
Pricing options include single-user, multi-user, and enterprise licenses priced at USD 4750, USD 4950, and USD 6800 respectively.
10. Is the market size provided in terms of value or volume?
The market size is provided in terms of value, measured in Million.
11. Are there any specific market keywords associated with the report?
Yes, the market keyword associated with the report is "APAC AMH Industry," which aids in identifying and referencing the specific market segment covered.
12. How do I determine which pricing option suits my needs best?
The pricing options vary based on user requirements and access needs. Individual users may opt for single-user licenses, while businesses requiring broader access may choose multi-user or enterprise licenses for cost-effective access to the report.
13. Are there any additional resources or data provided in the APAC AMH Industry report?
While the report offers comprehensive insights, it's advisable to review the specific contents or supplementary materials provided to ascertain if additional resources or data are available.
14. How can I stay updated on further developments or reports in the APAC AMH Industry?
To stay informed about further developments, trends, and reports in the APAC AMH Industry, consider subscribing to industry newsletters, following relevant companies and organizations, or regularly checking reputable industry news sources and publications.
Methodology
Step 1 - Identification of Relevant Samples Size from Population Database


Step 2 - Approaches for Defining Global Market Size (Value, Volume* & Price*)

Note*: In applicable scenarios
Step 3 - Data Sources
Primary Research
- Web Analytics
- Survey Reports
- Research Institute
- Latest Research Reports
- Opinion Leaders
Secondary Research
- Annual Reports
- White Paper
- Latest Press Release
- Industry Association
- Paid Database
- Investor Presentations

Step 4 - Data Triangulation
Involves using different sources of information in order to increase the validity of a study
These sources are likely to be stakeholders in a program - participants, other researchers, program staff, other community members, and so on.
Then we put all data in single framework & apply various statistical tools to find out the dynamic on the market.
During the analysis stage, feedback from the stakeholder groups would be compared to determine areas of agreement as well as areas of divergence
