

Key Insights
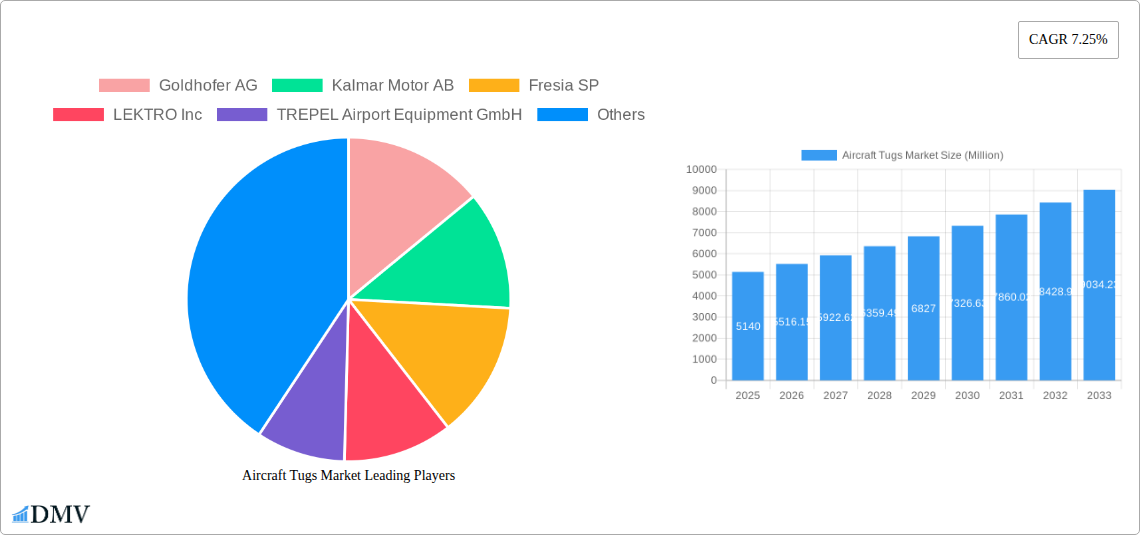
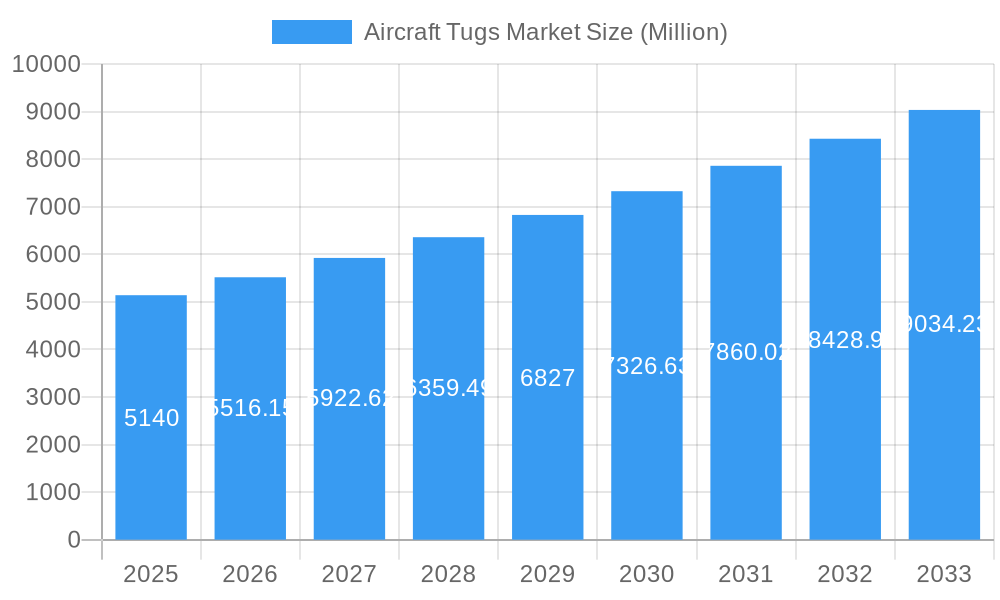
The Aircraft Tugs Market, valued at $5.14 billion in 2025, is projected to experience robust growth, exhibiting a Compound Annual Growth Rate (CAGR) of 7.25% from 2025 to 2033. This expansion is driven by several key factors. The increasing air travel demand globally necessitates efficient ground support equipment, including aircraft tugs, for smoother airport operations. Furthermore, the rise in e-commerce and express cargo delivery fuels the need for faster turnaround times, directly impacting the demand for reliable and powerful aircraft tugs. Technological advancements, such as the integration of electric and hybrid power systems in newer models, are contributing to improved fuel efficiency, reduced emissions, and enhanced safety features, driving market adoption. The market is segmented by type (conventional and towbarless) and power source (diesel, gas, and electric), with electric tugs gaining traction due to their environmental benefits and reduced operating costs. Regionally, North America and Europe currently hold significant market share, but the Asia-Pacific region is poised for substantial growth due to rapid airport infrastructure development and the expansion of airline operations. The presence of established players like Goldhofer AG, Kalmar Motor AB, and Textron Inc., alongside emerging companies, fosters competition and innovation within the market. However, high initial investment costs for advanced models and stringent emission regulations could pose challenges to market expansion in certain regions.
Aircraft Tugs Market Market Size (In Billion)
The forecast period (2025-2033) anticipates continued market expansion, propelled by the sustained growth in air passenger and cargo traffic. The adoption of advanced features, such as automated steering and improved braking systems, will enhance operational efficiency and safety. Furthermore, increasing focus on sustainability and reduced carbon footprints will encourage the adoption of electric and hybrid aircraft tugs, which are expected to capture a larger market share over the forecast period. Competitive landscape analysis suggests that established players will focus on product innovation and expansion into emerging markets. New entrants are expected to leverage technological advancements and offer cost-effective solutions, thereby intensifying competition and potentially disrupting the market dynamics. Overall, the aircraft tugs market is poised for consistent growth, driven by a confluence of factors related to air travel expansion, technological advancements, and environmental considerations.
Aircraft Tugs Market Company Market Share
Aircraft Tugs Market: A Comprehensive Report (2019-2033)
This insightful report provides a detailed analysis of the Aircraft Tugs Market, encompassing historical data (2019-2024), the base year (2025), and a comprehensive forecast (2025-2033). We delve deep into market dynamics, competitive landscapes, technological advancements, and future growth prospects, offering invaluable insights for stakeholders across the aviation industry. The market is projected to reach xx Million by 2033, showcasing significant growth potential.
Aircraft Tugs Market Market Composition & Trends
This section examines the Aircraft Tugs Market's structure, revealing its concentration levels and key trends. We analyze the influence of innovation, regulatory frameworks, substitute products, and end-user profiles. Furthermore, the report meticulously explores merger and acquisition (M&A) activities within the sector, quantifying deal values and analyzing their impact on market share distribution. Major players like Goldhofer AG, Kalmar Motor AB, and Tronair Inc. are examined for their individual market positions and strategies. The market exhibits a moderately concentrated structure, with the top five players holding an estimated xx% market share in 2025. Innovation in electric and towbarless tugs is a key driver, while stringent environmental regulations are reshaping the competitive landscape. The report also features an in-depth analysis of M&A activities, with xx Million in deal value recorded between 2019 and 2024.
- Market Concentration: Moderately concentrated, with top 5 players holding xx% market share in 2025.
- Innovation Catalysts: Development of electric and towbarless tugs, autonomous systems.
- Regulatory Landscape: Stringent emission regulations driving adoption of cleaner technologies.
- Substitute Products: Limited direct substitutes, but alternative ground handling methods exist.
- End-User Profiles: Primarily airports and airlines, with growing demand from maintenance facilities.
- M&A Activities: xx Million in deal value recorded between 2019 and 2024.
Aircraft Tugs Market Industry Evolution
This in-depth analysis charts the evolution of the Aircraft Tugs Market, illustrating its growth trajectory, technological advancements, and shifting consumer demands. From 2019 to 2024, the market witnessed a Compound Annual Growth Rate (CAGR) of xx%, driven primarily by the increasing air travel volume and the adoption of more efficient ground handling equipment. The shift toward electric and autonomous tugs is reshaping the market, with adoption rates projected to reach xx% by 2033. The increasing focus on sustainability and reducing carbon emissions is further accelerating the transition to eco-friendly technologies. Airlines are increasingly prioritizing operational efficiency and cost reduction, driving the demand for technologically advanced tugs.
Leading Regions, Countries, or Segments in Aircraft Tugs Market
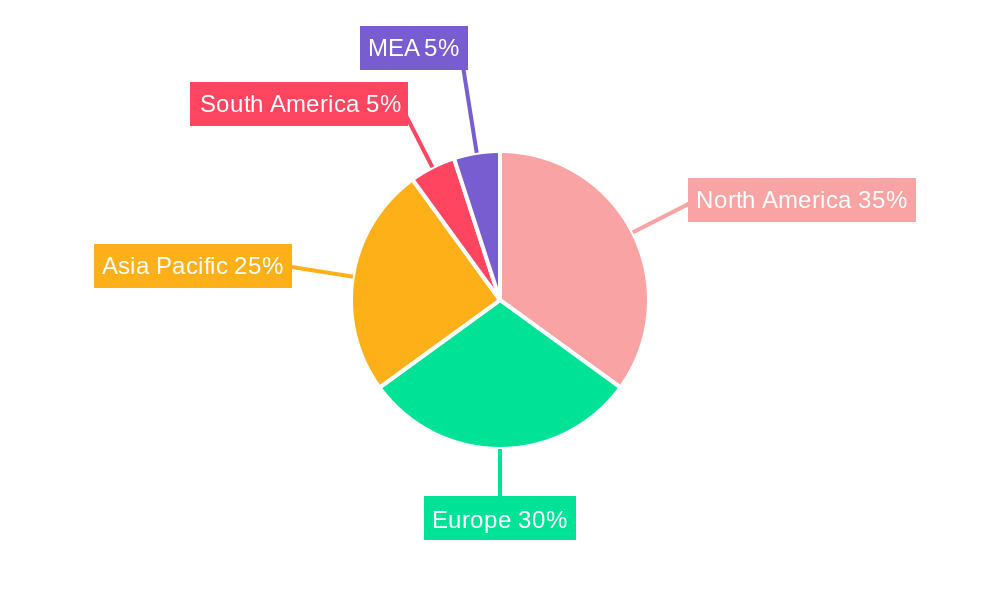
This section identifies the dominant regions, countries, and segments within the Aircraft Tugs Market. North America currently leads the market due to high aircraft traffic and significant investments in airport infrastructure. However, the Asia-Pacific region is expected to experience the fastest growth due to rapid expansion of air travel in emerging economies. The conventional tug segment currently holds the largest market share; however, the towbarless segment is experiencing rapid growth due to increased efficiency and safety. Electric tugs are witnessing significant adoption, primarily driven by environmental regulations and sustainability initiatives.
- Key Drivers (North America): High aircraft traffic, significant investments in airport infrastructure, strong regulatory support for emission reduction.
- Key Drivers (Asia-Pacific): Rapid growth in air travel, increasing airport development, government initiatives promoting sustainable technologies.
- Type:
- Conventional: Largest market share driven by established technology and lower initial costs.
- Towbarless: Fastest-growing segment, offering enhanced efficiency and safety.
- Power:
- Diesel: Still dominant due to cost-effectiveness and range, but declining market share.
- Electric: Fastest-growing power source, driven by sustainability goals and government incentives.
- Gas: Niche segment, limited adoption due to environmental concerns.
Aircraft Tugs Market Product Innovations
Recent innovations in aircraft tugs focus on enhancing efficiency, safety, and environmental sustainability. The introduction of electric and hybrid-electric models has significantly reduced emissions, while advancements in autonomous navigation systems are improving operational efficiency and reducing labor costs. Towbarless tugs, with their enhanced safety features and improved maneuverability, are gaining significant traction. These innovations deliver improved fuel efficiency, reduced downtime, and enhanced operator safety, creating a significant competitive advantage for manufacturers.
Propelling Factors for Aircraft Tugs Market Growth
The Aircraft Tugs Market is fueled by several key factors. Increased air passenger traffic globally drives the demand for efficient ground handling equipment. Stringent environmental regulations, particularly concerning emissions, are pushing the adoption of electric and hybrid tugs. Furthermore, technological advancements, such as autonomous navigation and improved safety features, enhance the appeal of new tug models. Finally, ongoing investments in airport infrastructure globally support market expansion.
Obstacles in the Aircraft Tugs Market Market
The market faces challenges such as high initial investment costs for advanced tugs, potential supply chain disruptions impacting production timelines, and intense competition from established and emerging players. Regulatory complexities and varying safety standards across different regions pose additional barriers to entry. These factors can significantly influence adoption rates and overall market growth.
Future Opportunities in Aircraft Tugs Market
Future growth opportunities lie in emerging markets with expanding air travel, further technological advancements towards autonomous operation and improved energy efficiency, and increased demand for specialized tugs catering to specific aircraft types. The integration of advanced technologies like predictive maintenance and digital connectivity can also unlock new market potential. Furthermore, the growing emphasis on sustainable aviation fuels will likely further propel the adoption of electric and hybrid tugs.
Major Players in the Aircraft Tugs Market Ecosystem
- Goldhofer AG
- Kalmar Motor AB
- Fresia SP
- LEKTRO Inc
- TREPEL Airport Equipment GmbH
- Tronair Inc
- John Bean Technologies Corp
- Tinka Resources Limited
- Textron Inc (Ground Support Equipment Inc)
- Airtug LLC
- MULAG
- MOTOTOK
Key Developments in Aircraft Tugs Market Industry
- June 2023: Lokpriyo Gopinath Bordoloi International Airport launched its first electric vehicle tug, signifying a shift towards sustainable ground support equipment.
- April 2023: Air India's adoption of pilot-controlled tow tractors for Airbus A320s highlights the growing trend toward automated and emission-reducing technologies.
Strategic Aircraft Tugs Market Market Forecast
The Aircraft Tugs Market is poised for significant growth over the forecast period (2025-2033), driven by the factors discussed earlier. The increasing adoption of electric and autonomous tugs, coupled with the expansion of air travel and investments in airport infrastructure, presents substantial opportunities for market players. The market is expected to witness a CAGR of xx%, reaching xx Million by 2033. This growth will be fueled by the continued focus on sustainability, operational efficiency, and technological advancements.
Aircraft Tugs Market Segmentation
- 1. Production Analysis
- 2. Consumption Analysis
- 3. Import Market Analysis (Value & Volume)
- 4. Export Market Analysis (Value & Volume)
- 5. Price Trend Analysis
Aircraft Tugs Market Segmentation By Geography
-
1. North America
- 1.1. United States
- 1.2. Canada
- 1.3. Mexico
-
2. South America
- 2.1. Brazil
- 2.2. Argentina
- 2.3. Rest of South America
-
3. Europe
- 3.1. United Kingdom
- 3.2. Germany
- 3.3. France
- 3.4. Italy
- 3.5. Spain
- 3.6. Russia
- 3.7. Benelux
- 3.8. Nordics
- 3.9. Rest of Europe
-
4. Middle East & Africa
- 4.1. Turkey
- 4.2. Israel
- 4.3. GCC
- 4.4. North Africa
- 4.5. South Africa
- 4.6. Rest of Middle East & Africa
-
5. Asia Pacific
- 5.1. China
- 5.2. India
- 5.3. Japan
- 5.4. South Korea
- 5.5. ASEAN
- 5.6. Oceania
- 5.7. Rest of Asia Pacific
Aircraft Tugs Market Regional Market Share
Geographic Coverage of Aircraft Tugs Market
Aircraft Tugs Market REPORT HIGHLIGHTS
| Aspects | Details |
|---|---|
| Study Period | 2020-2034 |
| Base Year | 2025 |
| Estimated Year | 2026 |
| Forecast Period | 2026-2034 |
| Historical Period | 2020-2025 |
| Growth Rate | CAGR of 7.25% from 2020-2034 |
| Segmentation |
|
Table of Contents
- 1. Introduction
- 1.1. Research Scope
- 1.2. Market Segmentation
- 1.3. Research Objective
- 1.4. Definitions and Assumptions
- 2. Executive Summary
- 2.1. Market Snapshot
- 3. Market Dynamics
- 3.1. Market Drivers
- 3.2. Market Restrains
- 3.3. Market Trends
- 3.4. Market Opportunities
- 4. Market Factor Analysis
- 4.1. Porters Five Forces
- 4.1.1. Bargaining Power of Suppliers
- 4.1.2. Bargaining Power of Buyers
- 4.1.3. Threat of New Entrants
- 4.1.4. Threat of Substitutes
- 4.1.5. Competitive Rivalry
- 4.2. PESTEL analysis
- 4.3. BCG Analysis
- 4.3.1. Stars (High Growth, High Market Share)
- 4.3.2. Cash Cows (Low Growth, High Market Share)
- 4.3.3. Question Mark (High Growth, Low Market Share)
- 4.3.4. Dogs (Low Growth, Low Market Share)
- 4.4. Ansoff Matrix Analysis
- 4.5. Supply Chain Analysis
- 4.6. Regulatory Landscape
- 4.7. Current Market Potential and Opportunity Assessment (TAM–SAM–SOM Framework)
- 4.8. DMV Analyst Note
- 4.1. Porters Five Forces
- 5. Market Analysis, Insights and Forecast 2021-2033
- 5.1. Market Analysis, Insights and Forecast - by Production Analysis
- 5.2. Market Analysis, Insights and Forecast - by Consumption Analysis
- 5.3. Market Analysis, Insights and Forecast - by Import Market Analysis (Value & Volume)
- 5.4. Market Analysis, Insights and Forecast - by Export Market Analysis (Value & Volume)
- 5.5. Market Analysis, Insights and Forecast - by Price Trend Analysis
- 5.6. Market Analysis, Insights and Forecast - by Region
- 5.6.1. North America
- 5.6.2. South America
- 5.6.3. Europe
- 5.6.4. Middle East & Africa
- 5.6.5. Asia Pacific
- 6. Global Aircraft Tugs Market Analysis, Insights and Forecast, 2021-2033
- 6.1. Market Analysis, Insights and Forecast - by Production Analysis
- 6.2. Market Analysis, Insights and Forecast - by Consumption Analysis
- 6.3. Market Analysis, Insights and Forecast - by Import Market Analysis (Value & Volume)
- 6.4. Market Analysis, Insights and Forecast - by Export Market Analysis (Value & Volume)
- 6.5. Market Analysis, Insights and Forecast - by Price Trend Analysis
- 7. North America Aircraft Tugs Market Analysis, Insights and Forecast, 2020-2032
- 7.1. Market Analysis, Insights and Forecast - by Production Analysis
- 7.2. Market Analysis, Insights and Forecast - by Consumption Analysis
- 7.3. Market Analysis, Insights and Forecast - by Import Market Analysis (Value & Volume)
- 7.4. Market Analysis, Insights and Forecast - by Export Market Analysis (Value & Volume)
- 7.5. Market Analysis, Insights and Forecast - by Price Trend Analysis
- 8. South America Aircraft Tugs Market Analysis, Insights and Forecast, 2020-2032
- 8.1. Market Analysis, Insights and Forecast - by Production Analysis
- 8.2. Market Analysis, Insights and Forecast - by Consumption Analysis
- 8.3. Market Analysis, Insights and Forecast - by Import Market Analysis (Value & Volume)
- 8.4. Market Analysis, Insights and Forecast - by Export Market Analysis (Value & Volume)
- 8.5. Market Analysis, Insights and Forecast - by Price Trend Analysis
- 9. Europe Aircraft Tugs Market Analysis, Insights and Forecast, 2020-2032
- 9.1. Market Analysis, Insights and Forecast - by Production Analysis
- 9.2. Market Analysis, Insights and Forecast - by Consumption Analysis
- 9.3. Market Analysis, Insights and Forecast - by Import Market Analysis (Value & Volume)
- 9.4. Market Analysis, Insights and Forecast - by Export Market Analysis (Value & Volume)
- 9.5. Market Analysis, Insights and Forecast - by Price Trend Analysis
- 10. Middle East & Africa Aircraft Tugs Market Analysis, Insights and Forecast, 2020-2032
- 10.1. Market Analysis, Insights and Forecast - by Production Analysis
- 10.2. Market Analysis, Insights and Forecast - by Consumption Analysis
- 10.3. Market Analysis, Insights and Forecast - by Import Market Analysis (Value & Volume)
- 10.4. Market Analysis, Insights and Forecast - by Export Market Analysis (Value & Volume)
- 10.5. Market Analysis, Insights and Forecast - by Price Trend Analysis
- 11. Asia Pacific Aircraft Tugs Market Analysis, Insights and Forecast, 2020-2032
- 11.1. Market Analysis, Insights and Forecast - by Production Analysis
- 11.2. Market Analysis, Insights and Forecast - by Consumption Analysis
- 11.3. Market Analysis, Insights and Forecast - by Import Market Analysis (Value & Volume)
- 11.4. Market Analysis, Insights and Forecast - by Export Market Analysis (Value & Volume)
- 11.5. Market Analysis, Insights and Forecast - by Price Trend Analysis
- 12. Competitive Analysis
- 12.1. Company Profiles
- 12.1.1 Goldhofer AG
- 12.1.1.1. Company Overview
- 12.1.1.2. Products
- 12.1.1.3. Company Financials
- 12.1.1.4. SWOT Analysis
- 12.1.2 Kalmar Motor AB
- 12.1.2.1. Company Overview
- 12.1.2.2. Products
- 12.1.2.3. Company Financials
- 12.1.2.4. SWOT Analysis
- 12.1.3 Fresia SP
- 12.1.3.1. Company Overview
- 12.1.3.2. Products
- 12.1.3.3. Company Financials
- 12.1.3.4. SWOT Analysis
- 12.1.4 LEKTRO Inc
- 12.1.4.1. Company Overview
- 12.1.4.2. Products
- 12.1.4.3. Company Financials
- 12.1.4.4. SWOT Analysis
- 12.1.5 TREPEL Airport Equipment GmbH
- 12.1.5.1. Company Overview
- 12.1.5.2. Products
- 12.1.5.3. Company Financials
- 12.1.5.4. SWOT Analysis
- 12.1.6 Tronair Inc
- 12.1.6.1. Company Overview
- 12.1.6.2. Products
- 12.1.6.3. Company Financials
- 12.1.6.4. SWOT Analysis
- 12.1.7 John Bean Technologies Corp
- 12.1.7.1. Company Overview
- 12.1.7.2. Products
- 12.1.7.3. Company Financials
- 12.1.7.4. SWOT Analysis
- 12.1.8 Tinka Resources Limited
- 12.1.8.1. Company Overview
- 12.1.8.2. Products
- 12.1.8.3. Company Financials
- 12.1.8.4. SWOT Analysis
- 12.1.9 Textron Inc (Ground Support Equipment Inc )
- 12.1.9.1. Company Overview
- 12.1.9.2. Products
- 12.1.9.3. Company Financials
- 12.1.9.4. SWOT Analysis
- 12.1.10 Airtug LLC
- 12.1.10.1. Company Overview
- 12.1.10.2. Products
- 12.1.10.3. Company Financials
- 12.1.10.4. SWOT Analysis
- 12.1.11 MULAG
- 12.1.11.1. Company Overview
- 12.1.11.2. Products
- 12.1.11.3. Company Financials
- 12.1.11.4. SWOT Analysis
- 12.1.12 MOTOTOK
- 12.1.12.1. Company Overview
- 12.1.12.2. Products
- 12.1.12.3. Company Financials
- 12.1.12.4. SWOT Analysis
- 12.1.1 Goldhofer AG
- 12.2. Market Entropy
- 12.2.1 Company's Key Areas Served
- 12.2.2 Recent Developments
- 12.3. Company Market Share Analysis 2025
- 12.3.1 Top 5 Companies Market Share Analysis
- 12.3.2 Top 3 Companies Market Share Analysis
- 12.4. List of Potential Customers
- 13. Research Methodology
List of Figures
- Figure 1: Global Aircraft Tugs Market Revenue Breakdown (billion, %) by Region 2025 & 2033
- Figure 2: North America Aircraft Tugs Market Revenue (billion), by Production Analysis 2025 & 2033
- Figure 3: North America Aircraft Tugs Market Revenue Share (%), by Production Analysis 2025 & 2033
- Figure 4: North America Aircraft Tugs Market Revenue (billion), by Consumption Analysis 2025 & 2033
- Figure 5: North America Aircraft Tugs Market Revenue Share (%), by Consumption Analysis 2025 & 2033
- Figure 6: North America Aircraft Tugs Market Revenue (billion), by Import Market Analysis (Value & Volume) 2025 & 2033
- Figure 7: North America Aircraft Tugs Market Revenue Share (%), by Import Market Analysis (Value & Volume) 2025 & 2033
- Figure 8: North America Aircraft Tugs Market Revenue (billion), by Export Market Analysis (Value & Volume) 2025 & 2033
- Figure 9: North America Aircraft Tugs Market Revenue Share (%), by Export Market Analysis (Value & Volume) 2025 & 2033
- Figure 10: North America Aircraft Tugs Market Revenue (billion), by Price Trend Analysis 2025 & 2033
- Figure 11: North America Aircraft Tugs Market Revenue Share (%), by Price Trend Analysis 2025 & 2033
- Figure 12: North America Aircraft Tugs Market Revenue (billion), by Country 2025 & 2033
- Figure 13: North America Aircraft Tugs Market Revenue Share (%), by Country 2025 & 2033
- Figure 14: South America Aircraft Tugs Market Revenue (billion), by Production Analysis 2025 & 2033
- Figure 15: South America Aircraft Tugs Market Revenue Share (%), by Production Analysis 2025 & 2033
- Figure 16: South America Aircraft Tugs Market Revenue (billion), by Consumption Analysis 2025 & 2033
- Figure 17: South America Aircraft Tugs Market Revenue Share (%), by Consumption Analysis 2025 & 2033
- Figure 18: South America Aircraft Tugs Market Revenue (billion), by Import Market Analysis (Value & Volume) 2025 & 2033
- Figure 19: South America Aircraft Tugs Market Revenue Share (%), by Import Market Analysis (Value & Volume) 2025 & 2033
- Figure 20: South America Aircraft Tugs Market Revenue (billion), by Export Market Analysis (Value & Volume) 2025 & 2033
- Figure 21: South America Aircraft Tugs Market Revenue Share (%), by Export Market Analysis (Value & Volume) 2025 & 2033
- Figure 22: South America Aircraft Tugs Market Revenue (billion), by Price Trend Analysis 2025 & 2033
- Figure 23: South America Aircraft Tugs Market Revenue Share (%), by Price Trend Analysis 2025 & 2033
- Figure 24: South America Aircraft Tugs Market Revenue (billion), by Country 2025 & 2033
- Figure 25: South America Aircraft Tugs Market Revenue Share (%), by Country 2025 & 2033
- Figure 26: Europe Aircraft Tugs Market Revenue (billion), by Production Analysis 2025 & 2033
- Figure 27: Europe Aircraft Tugs Market Revenue Share (%), by Production Analysis 2025 & 2033
- Figure 28: Europe Aircraft Tugs Market Revenue (billion), by Consumption Analysis 2025 & 2033
- Figure 29: Europe Aircraft Tugs Market Revenue Share (%), by Consumption Analysis 2025 & 2033
- Figure 30: Europe Aircraft Tugs Market Revenue (billion), by Import Market Analysis (Value & Volume) 2025 & 2033
- Figure 31: Europe Aircraft Tugs Market Revenue Share (%), by Import Market Analysis (Value & Volume) 2025 & 2033
- Figure 32: Europe Aircraft Tugs Market Revenue (billion), by Export Market Analysis (Value & Volume) 2025 & 2033
- Figure 33: Europe Aircraft Tugs Market Revenue Share (%), by Export Market Analysis (Value & Volume) 2025 & 2033
- Figure 34: Europe Aircraft Tugs Market Revenue (billion), by Price Trend Analysis 2025 & 2033
- Figure 35: Europe Aircraft Tugs Market Revenue Share (%), by Price Trend Analysis 2025 & 2033
- Figure 36: Europe Aircraft Tugs Market Revenue (billion), by Country 2025 & 2033
- Figure 37: Europe Aircraft Tugs Market Revenue Share (%), by Country 2025 & 2033
- Figure 38: Middle East & Africa Aircraft Tugs Market Revenue (billion), by Production Analysis 2025 & 2033
- Figure 39: Middle East & Africa Aircraft Tugs Market Revenue Share (%), by Production Analysis 2025 & 2033
- Figure 40: Middle East & Africa Aircraft Tugs Market Revenue (billion), by Consumption Analysis 2025 & 2033
- Figure 41: Middle East & Africa Aircraft Tugs Market Revenue Share (%), by Consumption Analysis 2025 & 2033
- Figure 42: Middle East & Africa Aircraft Tugs Market Revenue (billion), by Import Market Analysis (Value & Volume) 2025 & 2033
- Figure 43: Middle East & Africa Aircraft Tugs Market Revenue Share (%), by Import Market Analysis (Value & Volume) 2025 & 2033
- Figure 44: Middle East & Africa Aircraft Tugs Market Revenue (billion), by Export Market Analysis (Value & Volume) 2025 & 2033
- Figure 45: Middle East & Africa Aircraft Tugs Market Revenue Share (%), by Export Market Analysis (Value & Volume) 2025 & 2033
- Figure 46: Middle East & Africa Aircraft Tugs Market Revenue (billion), by Price Trend Analysis 2025 & 2033
- Figure 47: Middle East & Africa Aircraft Tugs Market Revenue Share (%), by Price Trend Analysis 2025 & 2033
- Figure 48: Middle East & Africa Aircraft Tugs Market Revenue (billion), by Country 2025 & 2033
- Figure 49: Middle East & Africa Aircraft Tugs Market Revenue Share (%), by Country 2025 & 2033
- Figure 50: Asia Pacific Aircraft Tugs Market Revenue (billion), by Production Analysis 2025 & 2033
- Figure 51: Asia Pacific Aircraft Tugs Market Revenue Share (%), by Production Analysis 2025 & 2033
- Figure 52: Asia Pacific Aircraft Tugs Market Revenue (billion), by Consumption Analysis 2025 & 2033
- Figure 53: Asia Pacific Aircraft Tugs Market Revenue Share (%), by Consumption Analysis 2025 & 2033
- Figure 54: Asia Pacific Aircraft Tugs Market Revenue (billion), by Import Market Analysis (Value & Volume) 2025 & 2033
- Figure 55: Asia Pacific Aircraft Tugs Market Revenue Share (%), by Import Market Analysis (Value & Volume) 2025 & 2033
- Figure 56: Asia Pacific Aircraft Tugs Market Revenue (billion), by Export Market Analysis (Value & Volume) 2025 & 2033
- Figure 57: Asia Pacific Aircraft Tugs Market Revenue Share (%), by Export Market Analysis (Value & Volume) 2025 & 2033
- Figure 58: Asia Pacific Aircraft Tugs Market Revenue (billion), by Price Trend Analysis 2025 & 2033
- Figure 59: Asia Pacific Aircraft Tugs Market Revenue Share (%), by Price Trend Analysis 2025 & 2033
- Figure 60: Asia Pacific Aircraft Tugs Market Revenue (billion), by Country 2025 & 2033
- Figure 61: Asia Pacific Aircraft Tugs Market Revenue Share (%), by Country 2025 & 2033
List of Tables
- Table 1: Global Aircraft Tugs Market Revenue billion Forecast, by Production Analysis 2020 & 2033
- Table 2: Global Aircraft Tugs Market Revenue billion Forecast, by Consumption Analysis 2020 & 2033
- Table 3: Global Aircraft Tugs Market Revenue billion Forecast, by Import Market Analysis (Value & Volume) 2020 & 2033
- Table 4: Global Aircraft Tugs Market Revenue billion Forecast, by Export Market Analysis (Value & Volume) 2020 & 2033
- Table 5: Global Aircraft Tugs Market Revenue billion Forecast, by Price Trend Analysis 2020 & 2033
- Table 6: Global Aircraft Tugs Market Revenue billion Forecast, by Region 2020 & 2033
- Table 7: Global Aircraft Tugs Market Revenue billion Forecast, by Production Analysis 2020 & 2033
- Table 8: Global Aircraft Tugs Market Revenue billion Forecast, by Consumption Analysis 2020 & 2033
- Table 9: Global Aircraft Tugs Market Revenue billion Forecast, by Import Market Analysis (Value & Volume) 2020 & 2033
- Table 10: Global Aircraft Tugs Market Revenue billion Forecast, by Export Market Analysis (Value & Volume) 2020 & 2033
- Table 11: Global Aircraft Tugs Market Revenue billion Forecast, by Price Trend Analysis 2020 & 2033
- Table 12: Global Aircraft Tugs Market Revenue billion Forecast, by Country 2020 & 2033
- Table 13: United States Aircraft Tugs Market Revenue (billion) Forecast, by Application 2020 & 2033
- Table 14: Canada Aircraft Tugs Market Revenue (billion) Forecast, by Application 2020 & 2033
- Table 15: Mexico Aircraft Tugs Market Revenue (billion) Forecast, by Application 2020 & 2033
- Table 16: Global Aircraft Tugs Market Revenue billion Forecast, by Production Analysis 2020 & 2033
- Table 17: Global Aircraft Tugs Market Revenue billion Forecast, by Consumption Analysis 2020 & 2033
- Table 18: Global Aircraft Tugs Market Revenue billion Forecast, by Import Market Analysis (Value & Volume) 2020 & 2033
- Table 19: Global Aircraft Tugs Market Revenue billion Forecast, by Export Market Analysis (Value & Volume) 2020 & 2033
- Table 20: Global Aircraft Tugs Market Revenue billion Forecast, by Price Trend Analysis 2020 & 2033
- Table 21: Global Aircraft Tugs Market Revenue billion Forecast, by Country 2020 & 2033
- Table 22: Brazil Aircraft Tugs Market Revenue (billion) Forecast, by Application 2020 & 2033
- Table 23: Argentina Aircraft Tugs Market Revenue (billion) Forecast, by Application 2020 & 2033
- Table 24: Rest of South America Aircraft Tugs Market Revenue (billion) Forecast, by Application 2020 & 2033
- Table 25: Global Aircraft Tugs Market Revenue billion Forecast, by Production Analysis 2020 & 2033
- Table 26: Global Aircraft Tugs Market Revenue billion Forecast, by Consumption Analysis 2020 & 2033
- Table 27: Global Aircraft Tugs Market Revenue billion Forecast, by Import Market Analysis (Value & Volume) 2020 & 2033
- Table 28: Global Aircraft Tugs Market Revenue billion Forecast, by Export Market Analysis (Value & Volume) 2020 & 2033
- Table 29: Global Aircraft Tugs Market Revenue billion Forecast, by Price Trend Analysis 2020 & 2033
- Table 30: Global Aircraft Tugs Market Revenue billion Forecast, by Country 2020 & 2033
- Table 31: United Kingdom Aircraft Tugs Market Revenue (billion) Forecast, by Application 2020 & 2033
- Table 32: Germany Aircraft Tugs Market Revenue (billion) Forecast, by Application 2020 & 2033
- Table 33: France Aircraft Tugs Market Revenue (billion) Forecast, by Application 2020 & 2033
- Table 34: Italy Aircraft Tugs Market Revenue (billion) Forecast, by Application 2020 & 2033
- Table 35: Spain Aircraft Tugs Market Revenue (billion) Forecast, by Application 2020 & 2033
- Table 36: Russia Aircraft Tugs Market Revenue (billion) Forecast, by Application 2020 & 2033
- Table 37: Benelux Aircraft Tugs Market Revenue (billion) Forecast, by Application 2020 & 2033
- Table 38: Nordics Aircraft Tugs Market Revenue (billion) Forecast, by Application 2020 & 2033
- Table 39: Rest of Europe Aircraft Tugs Market Revenue (billion) Forecast, by Application 2020 & 2033
- Table 40: Global Aircraft Tugs Market Revenue billion Forecast, by Production Analysis 2020 & 2033
- Table 41: Global Aircraft Tugs Market Revenue billion Forecast, by Consumption Analysis 2020 & 2033
- Table 42: Global Aircraft Tugs Market Revenue billion Forecast, by Import Market Analysis (Value & Volume) 2020 & 2033
- Table 43: Global Aircraft Tugs Market Revenue billion Forecast, by Export Market Analysis (Value & Volume) 2020 & 2033
- Table 44: Global Aircraft Tugs Market Revenue billion Forecast, by Price Trend Analysis 2020 & 2033
- Table 45: Global Aircraft Tugs Market Revenue billion Forecast, by Country 2020 & 2033
- Table 46: Turkey Aircraft Tugs Market Revenue (billion) Forecast, by Application 2020 & 2033
- Table 47: Israel Aircraft Tugs Market Revenue (billion) Forecast, by Application 2020 & 2033
- Table 48: GCC Aircraft Tugs Market Revenue (billion) Forecast, by Application 2020 & 2033
- Table 49: North Africa Aircraft Tugs Market Revenue (billion) Forecast, by Application 2020 & 2033
- Table 50: South Africa Aircraft Tugs Market Revenue (billion) Forecast, by Application 2020 & 2033
- Table 51: Rest of Middle East & Africa Aircraft Tugs Market Revenue (billion) Forecast, by Application 2020 & 2033
- Table 52: Global Aircraft Tugs Market Revenue billion Forecast, by Production Analysis 2020 & 2033
- Table 53: Global Aircraft Tugs Market Revenue billion Forecast, by Consumption Analysis 2020 & 2033
- Table 54: Global Aircraft Tugs Market Revenue billion Forecast, by Import Market Analysis (Value & Volume) 2020 & 2033
- Table 55: Global Aircraft Tugs Market Revenue billion Forecast, by Export Market Analysis (Value & Volume) 2020 & 2033
- Table 56: Global Aircraft Tugs Market Revenue billion Forecast, by Price Trend Analysis 2020 & 2033
- Table 57: Global Aircraft Tugs Market Revenue billion Forecast, by Country 2020 & 2033
- Table 58: China Aircraft Tugs Market Revenue (billion) Forecast, by Application 2020 & 2033
- Table 59: India Aircraft Tugs Market Revenue (billion) Forecast, by Application 2020 & 2033
- Table 60: Japan Aircraft Tugs Market Revenue (billion) Forecast, by Application 2020 & 2033
- Table 61: South Korea Aircraft Tugs Market Revenue (billion) Forecast, by Application 2020 & 2033
- Table 62: ASEAN Aircraft Tugs Market Revenue (billion) Forecast, by Application 2020 & 2033
- Table 63: Oceania Aircraft Tugs Market Revenue (billion) Forecast, by Application 2020 & 2033
- Table 64: Rest of Asia Pacific Aircraft Tugs Market Revenue (billion) Forecast, by Application 2020 & 2033
Frequently Asked Questions
1. What is the projected Compound Annual Growth Rate (CAGR) of the Aircraft Tugs Market?
The projected CAGR is approximately 7.25%.
2. Which companies are prominent players in the Aircraft Tugs Market?
Key companies in the market include Goldhofer AG, Kalmar Motor AB, Fresia SP, LEKTRO Inc, TREPEL Airport Equipment GmbH, Tronair Inc, John Bean Technologies Corp, Tinka Resources Limited, Textron Inc (Ground Support Equipment Inc ), Airtug LLC, MULAG, MOTOTOK.
3. What are the main segments of the Aircraft Tugs Market?
The market segments include Production Analysis, Consumption Analysis, Import Market Analysis (Value & Volume), Export Market Analysis (Value & Volume), Price Trend Analysis.
4. Can you provide details about the market size?
The market size is estimated to be USD 5.51 billion as of 2022.
5. What are some drivers contributing to market growth?
Increase in Internet of Things (IoT) and Autonomous Systems; Rise in Demand for Military and Defense Satellite Communication Solutions.
6. What are the notable trends driving market growth?
Electric Segment is Anticipated to Register the Highest CAGR During the Forecast Period.
7. Are there any restraints impacting market growth?
Cybersecurity Threats to Satellite Communication; Interference in Transmission of Data.
8. Can you provide examples of recent developments in the market?
June 2023: Lokpriyo Gopinath Bordoloi International Airport launched its first electric vehicle tug to handle ground operations.
9. What pricing options are available for accessing the report?
Pricing options include single-user, multi-user, and enterprise licenses priced at USD 4750, USD 5250, and USD 8750 respectively.
10. Is the market size provided in terms of value or volume?
The market size is provided in terms of value, measured in billion.
11. Are there any specific market keywords associated with the report?
Yes, the market keyword associated with the report is "Aircraft Tugs Market," which aids in identifying and referencing the specific market segment covered.
12. How do I determine which pricing option suits my needs best?
The pricing options vary based on user requirements and access needs. Individual users may opt for single-user licenses, while businesses requiring broader access may choose multi-user or enterprise licenses for cost-effective access to the report.
13. Are there any additional resources or data provided in the Aircraft Tugs Market report?
While the report offers comprehensive insights, it's advisable to review the specific contents or supplementary materials provided to ascertain if additional resources or data are available.
14. How can I stay updated on further developments or reports in the Aircraft Tugs Market?
To stay informed about further developments, trends, and reports in the Aircraft Tugs Market, consider subscribing to industry newsletters, following relevant companies and organizations, or regularly checking reputable industry news sources and publications.
Methodology
Step 1 - Identification of Relevant Samples Size from Population Database


Step 2 - Approaches for Defining Global Market Size (Value, Volume* & Price*)

Note*: In applicable scenarios
Step 3 - Data Sources
Primary Research
- Web Analytics
- Survey Reports
- Research Institute
- Latest Research Reports
- Opinion Leaders
Secondary Research
- Annual Reports
- White Paper
- Latest Press Release
- Industry Association
- Paid Database
- Investor Presentations

Step 4 - Data Triangulation
Involves using different sources of information in order to increase the validity of a study
These sources are likely to be stakeholders in a program - participants, other researchers, program staff, other community members, and so on.
Then we put all data in single framework & apply various statistical tools to find out the dynamic on the market.
During the analysis stage, feedback from the stakeholder groups would be compared to determine areas of agreement as well as areas of divergence