

Key Insights
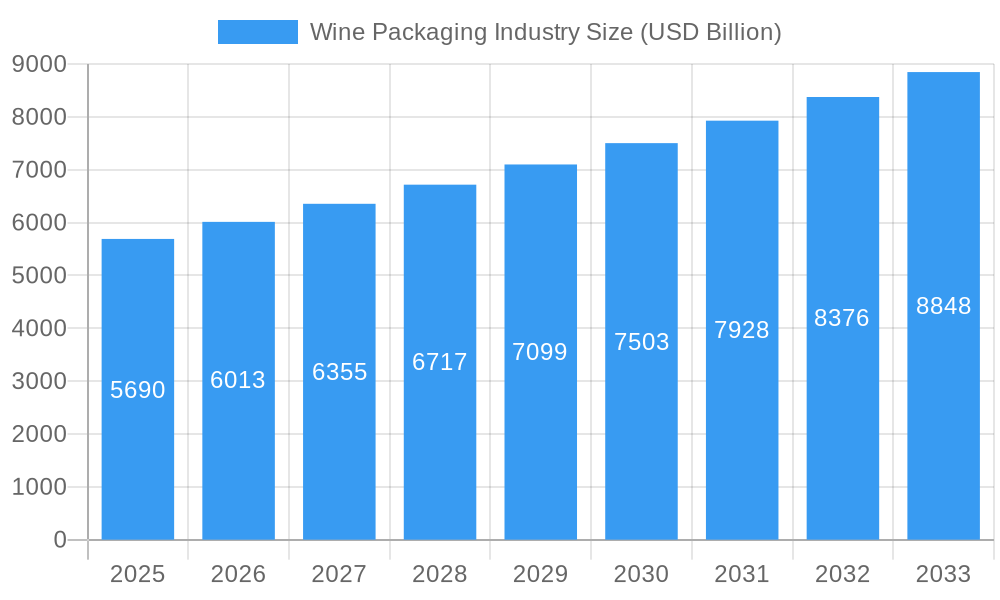
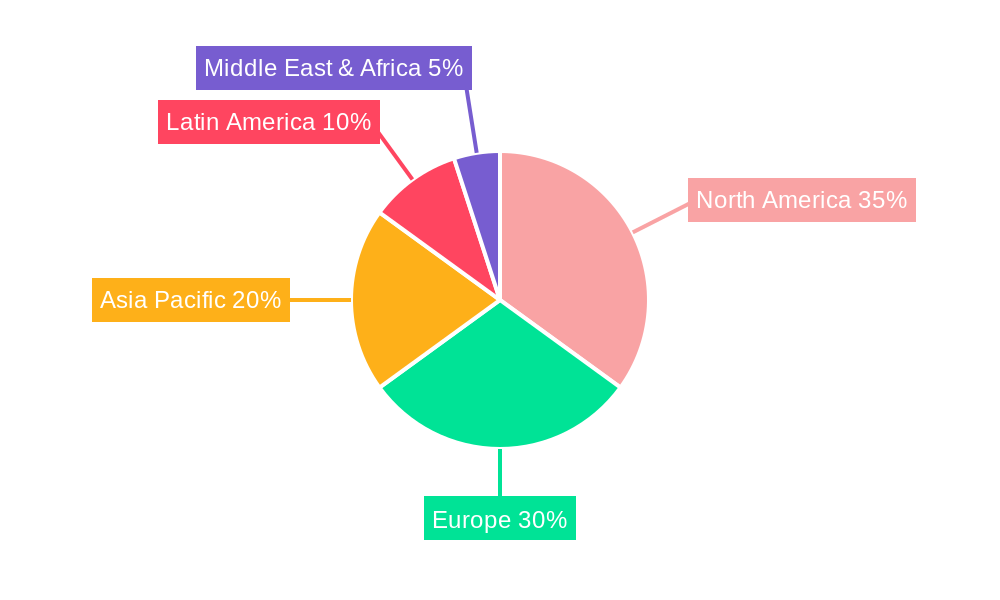
The global wine packaging market, valued at $5.69 billion in 2025, is projected to experience robust growth, exhibiting a compound annual growth rate (CAGR) of 5.48% from 2025 to 2033. This expansion is driven by several key factors. The increasing consumption of wine globally, particularly in emerging markets like Asia-Pacific, fuels demand for effective and attractive packaging solutions. Furthermore, the growing preference for premium wines necessitates innovative packaging designs that enhance the product's appeal and preserve its quality. Sustainability concerns are also significantly influencing market trends, with a rising demand for eco-friendly materials like recycled glass and lightweight alternatives to reduce environmental impact. The market segmentation reveals a diverse landscape, with glass bottles maintaining a significant market share due to their perceived quality and association with premium wines. However, plastic bottles and bag-in-box packaging are gaining traction due to their cost-effectiveness and convenience. Competition among key players like Encore Glass, Ardagh Group, and Tetra Laval International is driving innovation and efficiency improvements throughout the value chain. Regional variations exist, with North America and Europe currently holding the largest market shares, but Asia-Pacific is expected to witness significant growth in the coming years due to its expanding wine-consuming population and increasing disposable incomes.

Wine Packaging Industry Market Size (In Billion)
The restraining factors primarily involve fluctuating raw material prices, especially for glass and plastic, which impacts production costs. Stringent regulations regarding packaging materials and sustainability are also influencing manufacturers to invest in eco-conscious solutions. The ongoing technological advancements in packaging materials and printing technologies continue to present both challenges and opportunities for companies to enhance their product offerings and differentiate themselves in a competitive market. This necessitates continuous adaptation to evolving consumer preferences and technological breakthroughs. The industry anticipates significant advancements in lightweighting packaging to minimize transportation costs and environmental impact, further reinforcing the importance of sustainable solutions. The overall market outlook remains positive, fueled by consistent growth in wine consumption and the dynamic evolution of packaging technology.
Wine Packaging Industry Company Market Share
Wine Packaging Industry Market Report: 2019-2033
This comprehensive report provides a detailed analysis of the global wine packaging industry, projecting a market value of USD xx Billion by 2033. The study period covers 2019-2033, with 2025 serving as both the base and estimated year. This in-depth analysis delves into market trends, competitive landscapes, technological advancements, and future growth opportunities, providing crucial insights for stakeholders across the value chain.
Wine Packaging Industry Market Composition & Trends
The wine packaging market, valued at USD xx Billion in 2025, exhibits a moderately concentrated structure with key players holding significant market share. Market share distribution is influenced by factors such as technological capabilities, brand recognition, and global reach. The industry witnesses continuous innovation driven by consumer demand for sustainable and convenient packaging solutions. Regulatory landscapes, particularly concerning material recyclability and sustainability, significantly impact packaging choices. Substitute products, such as alternative closure systems and dispensing technologies, challenge traditional packaging formats. End-users, primarily wineries and wine distributors, influence packaging preferences based on cost, brand image, and logistical considerations. M&A activity has been moderate, with deal values averaging USD xx Billion annually over the past five years. Key trends include:
- Increasing demand for sustainable packaging: Driven by environmentally conscious consumers and stricter regulations.
- Growth of e-commerce: Leading to innovations in packaging for online wine delivery.
- Focus on lightweighting: Reducing material usage and carbon footprint.
- Premiumization: Demand for sophisticated packaging to enhance brand image.
- Consolidation: Ongoing mergers and acquisitions to achieve scale and efficiency.
Wine Packaging Industry Industry Evolution
The wine packaging industry has experienced significant evolution over the historical period (2019-2024), witnessing a Compound Annual Growth Rate (CAGR) of xx%. This growth is fueled by several factors including rising wine consumption globally, especially in emerging markets. Technological advancements, such as improved barrier materials for extended shelf life and innovative closure systems, have enhanced packaging functionality and convenience. Shifting consumer demands towards sustainability and eco-friendly packaging have spurred the adoption of lightweight and recyclable materials, particularly in glass and paperboard. The forecast period (2025-2033) anticipates continued growth, projected at a CAGR of xx%, driven by these ongoing trends and the emergence of new packaging formats. Specific examples include:
- Increased adoption of bag-in-box packaging, offering cost and sustainability advantages.
- Growth in demand for specialized packaging for premium wine varieties.
- Development of innovative closure systems emphasizing tamper-evidence and ease of use.
- Integration of smart packaging technologies to enhance consumer engagement and traceability.
Leading Regions, Countries, or Segments in Wine Packaging Industry
The global wine packaging market is geographically diverse, with leading regions and segments exhibiting varying growth trajectories.
Material Type: Glass continues to dominate due to its perceived quality and premium image. However, plastic and paperboard are experiencing growth due to cost-effectiveness and sustainability. Metal closures maintain a strong presence due to their security and convenience.
Product Type: Glass bottles remain the most widely used packaging format, however, plastic bottles are gaining traction in segments prioritizing cost-efficiency and lightweight options. Bag-in-box solutions are experiencing rapid growth due to their cost effectiveness and suitability for large volumes. Other product types represent a niche segment with innovative packaging solutions catering to premium segments.
Key Drivers: Investment in sustainable packaging technologies, stringent environmental regulations, and the growing preference for convenient packaging options all contribute to shaping the dominance of various segments and regions. Europe and North America currently represent significant markets, but strong growth is anticipated from Asia-Pacific.
Wine Packaging Industry Product Innovations
Recent product innovations focus on sustainability, convenience, and premiumization. Lightweight glass bottles, improved barrier films for plastic bottles, and eco-friendly coatings for paperboard packaging illustrate a strong trend toward environmentally responsible solutions. Smart packaging solutions incorporating QR codes and other technologies are being explored to enhance traceability and consumer engagement. New closure designs improve tamper-evidence and ease of use. These innovations address key customer needs while contributing to industry-wide sustainability objectives.
Propelling Factors for Wine Packaging Industry Growth
Several factors propel the growth of the wine packaging industry. Technological advancements, such as lighter-weight materials and improved barrier properties, offer cost and environmental benefits. The rise of e-commerce necessitates robust packaging for wine delivery. Furthermore, favorable economic conditions in key markets and increased regulatory focus on sustainability drive investment in eco-friendly packaging solutions. For example, the EU's stringent regulations on plastics are significantly impacting packaging material choices across Europe.
Obstacles in the Wine Packaging Industry Market
The wine packaging industry faces several challenges. Fluctuating raw material prices, particularly for plastics and metals, impact production costs. Supply chain disruptions can lead to production delays and increased costs. Furthermore, intense competition from established players and the emergence of new entrants create pressure on margins. Finally, strict environmental regulations in many regions require substantial investment in sustainable packaging solutions. These challenges contribute to uncertainty and require strategic planning to mitigate risks.
Future Opportunities in Wine Packaging Industry
Future opportunities reside in exploring sustainable materials like bioplastics and innovative packaging designs to minimize environmental impact. Growth in emerging markets, particularly in Asia and Latin America, offers considerable expansion potential. Integrating smart packaging technology to improve product traceability and consumer engagement presents significant opportunities. The increasing popularity of premium wines necessitates investments in higher-end packaging solutions. Meeting diverse consumer preferences and adopting sustainable practices will be key for future success.
Major Players in the Wine Packaging Industry Ecosystem
Key Developments in Wine Packaging Industry Industry
- December 2022: Orora Glass wins WIIA Packaging & Design Award for its lightweight sparkling wine bottle, highlighting the industry's focus on sustainability and innovation.
- November 2022: Smurfit Kappa launches a sustainable packaging solution tailored for e-commerce wine sales, reflecting the growing importance of online channels.
Strategic Wine Packaging Industry Market Forecast
The wine packaging industry is poised for continued growth, driven by rising wine consumption, increasing demand for sustainable packaging, and technological advancements. Opportunities exist in expanding into emerging markets, developing innovative packaging solutions, and leveraging smart packaging technologies. The market's future success hinges on addressing consumer preferences for convenience and sustainability, while simultaneously navigating challenges related to raw material costs and regulatory compliance. The industry's positive trajectory is expected to continue throughout the forecast period.
Wine Packaging Industry Segmentation
-
1. Material Type
- 1.1. Glass
- 1.2. Plastic
- 1.3. Metal
- 1.4. Paper Board
-
2. Product Type
- 2.1. Glass Bottles
- 2.2. Plastic Bottles
- 2.3. Bag in Box
- 2.4. Other Product Types
Wine Packaging Industry Segmentation By Geography
-
1. North America
- 1.1. United States
- 1.2. Canada
-
2. Europe
- 2.1. United Kingdom
- 2.2. Germany
- 2.3. Italy
- 2.4. France
- 2.5. Spain
- 2.6. Rest of Europe
-
3. Asia Pacific
- 3.1. China
- 3.2. Japan
- 3.3. Australia and New Zealand
- 3.4. Rest of Asia Pacific
- 4. Latin America
- 5. Middle East and Africa
Wine Packaging Industry Regional Market Share
Geographic Coverage of Wine Packaging Industry
Wine Packaging Industry REPORT HIGHLIGHTS
| Aspects | Details |
|---|---|
| Study Period | 2020-2034 |
| Base Year | 2025 |
| Estimated Year | 2026 |
| Forecast Period | 2026-2034 |
| Historical Period | 2020-2025 |
| Growth Rate | CAGR of 5.48% from 2020-2034 |
| Segmentation |
|
Table of Contents
- 1. Introduction
- 1.1. Research Scope
- 1.2. Market Segmentation
- 1.3. Research Objective
- 1.4. Definitions and Assumptions
- 2. Executive Summary
- 2.1. Market Snapshot
- 3. Market Dynamics
- 3.1. Market Drivers
- 3.2. Market Restrains
- 3.3. Market Trends
- 3.4. Market Opportunities
- 4. Market Factor Analysis
- 4.1. Porters Five Forces
- 4.1.1. Bargaining Power of Suppliers
- 4.1.2. Bargaining Power of Buyers
- 4.1.3. Threat of New Entrants
- 4.1.4. Threat of Substitutes
- 4.1.5. Competitive Rivalry
- 4.2. PESTEL analysis
- 4.3. BCG Analysis
- 4.3.1. Stars (High Growth, High Market Share)
- 4.3.2. Cash Cows (Low Growth, High Market Share)
- 4.3.3. Question Mark (High Growth, Low Market Share)
- 4.3.4. Dogs (Low Growth, Low Market Share)
- 4.4. Ansoff Matrix Analysis
- 4.5. Supply Chain Analysis
- 4.6. Regulatory Landscape
- 4.7. Current Market Potential and Opportunity Assessment (TAM–SAM–SOM Framework)
- 4.8. DMV Analyst Note
- 4.1. Porters Five Forces
- 5. Market Analysis, Insights and Forecast 2021-2033
- 5.1. Market Analysis, Insights and Forecast - by Material Type
- 5.1.1. Glass
- 5.1.2. Plastic
- 5.1.3. Metal
- 5.1.4. Paper Board
- 5.2. Market Analysis, Insights and Forecast - by Product Type
- 5.2.1. Glass Bottles
- 5.2.2. Plastic Bottles
- 5.2.3. Bag in Box
- 5.2.4. Other Product Types
- 5.3. Market Analysis, Insights and Forecast - by Region
- 5.3.1. North America
- 5.3.2. Europe
- 5.3.3. Asia Pacific
- 5.3.4. Latin America
- 5.3.5. Middle East and Africa
- 5.1. Market Analysis, Insights and Forecast - by Material Type
- 6. Global Wine Packaging Industry Analysis, Insights and Forecast, 2021-2033
- 6.1. Market Analysis, Insights and Forecast - by Material Type
- 6.1.1. Glass
- 6.1.2. Plastic
- 6.1.3. Metal
- 6.1.4. Paper Board
- 6.2. Market Analysis, Insights and Forecast - by Product Type
- 6.2.1. Glass Bottles
- 6.2.2. Plastic Bottles
- 6.2.3. Bag in Box
- 6.2.4. Other Product Types
- 6.1. Market Analysis, Insights and Forecast - by Material Type
- 7. North America Wine Packaging Industry Analysis, Insights and Forecast, 2020-2032
- 7.1. Market Analysis, Insights and Forecast - by Material Type
- 7.1.1. Glass
- 7.1.2. Plastic
- 7.1.3. Metal
- 7.1.4. Paper Board
- 7.2. Market Analysis, Insights and Forecast - by Product Type
- 7.2.1. Glass Bottles
- 7.2.2. Plastic Bottles
- 7.2.3. Bag in Box
- 7.2.4. Other Product Types
- 7.1. Market Analysis, Insights and Forecast - by Material Type
- 8. Europe Wine Packaging Industry Analysis, Insights and Forecast, 2020-2032
- 8.1. Market Analysis, Insights and Forecast - by Material Type
- 8.1.1. Glass
- 8.1.2. Plastic
- 8.1.3. Metal
- 8.1.4. Paper Board
- 8.2. Market Analysis, Insights and Forecast - by Product Type
- 8.2.1. Glass Bottles
- 8.2.2. Plastic Bottles
- 8.2.3. Bag in Box
- 8.2.4. Other Product Types
- 8.1. Market Analysis, Insights and Forecast - by Material Type
- 9. Asia Pacific Wine Packaging Industry Analysis, Insights and Forecast, 2020-2032
- 9.1. Market Analysis, Insights and Forecast - by Material Type
- 9.1.1. Glass
- 9.1.2. Plastic
- 9.1.3. Metal
- 9.1.4. Paper Board
- 9.2. Market Analysis, Insights and Forecast - by Product Type
- 9.2.1. Glass Bottles
- 9.2.2. Plastic Bottles
- 9.2.3. Bag in Box
- 9.2.4. Other Product Types
- 9.1. Market Analysis, Insights and Forecast - by Material Type
- 10. Latin America Wine Packaging Industry Analysis, Insights and Forecast, 2020-2032
- 10.1. Market Analysis, Insights and Forecast - by Material Type
- 10.1.1. Glass
- 10.1.2. Plastic
- 10.1.3. Metal
- 10.1.4. Paper Board
- 10.2. Market Analysis, Insights and Forecast - by Product Type
- 10.2.1. Glass Bottles
- 10.2.2. Plastic Bottles
- 10.2.3. Bag in Box
- 10.2.4. Other Product Types
- 10.1. Market Analysis, Insights and Forecast - by Material Type
- 11. Middle East and Africa Wine Packaging Industry Analysis, Insights and Forecast, 2020-2032
- 11.1. Market Analysis, Insights and Forecast - by Material Type
- 11.1.1. Glass
- 11.1.2. Plastic
- 11.1.3. Metal
- 11.1.4. Paper Board
- 11.2. Market Analysis, Insights and Forecast - by Product Type
- 11.2.1. Glass Bottles
- 11.2.2. Plastic Bottles
- 11.2.3. Bag in Box
- 11.2.4. Other Product Types
- 11.1. Market Analysis, Insights and Forecast - by Material Type
- 12. Competitive Analysis
- 12.1. Company Profiles
- 12.1.1 Encore Glass
- 12.1.1.1. Company Overview
- 12.1.1.2. Products
- 12.1.1.3. Company Financials
- 12.1.1.4. SWOT Analysis
- 12.1.2 Ardagh Group
- 12.1.2.1. Company Overview
- 12.1.2.2. Products
- 12.1.2.3. Company Financials
- 12.1.2.4. SWOT Analysis
- 12.1.3 Tetra Laval International
- 12.1.3.1. Company Overview
- 12.1.3.2. Products
- 12.1.3.3. Company Financials
- 12.1.3.4. SWOT Analysis
- 12.1.4 Liqui-Box Corporation ( Dow Chemical Company)
- 12.1.4.1. Company Overview
- 12.1.4.2. Products
- 12.1.4.3. Company Financials
- 12.1.4.4. SWOT Analysis
- 12.1.5 Saverglass SAS
- 12.1.5.1. Company Overview
- 12.1.5.2. Products
- 12.1.5.3. Company Financials
- 12.1.5.4. SWOT Analysis
- 12.1.6 Scholle Corporation
- 12.1.6.1. Company Overview
- 12.1.6.2. Products
- 12.1.6.3. Company Financials
- 12.1.6.4. SWOT Analysis
- 12.1.7 TricorBraun Incorporate
- 12.1.7.1. Company Overview
- 12.1.7.2. Products
- 12.1.7.3. Company Financials
- 12.1.7.4. SWOT Analysis
- 12.1.8 Ball Corporation
- 12.1.8.1. Company Overview
- 12.1.8.2. Products
- 12.1.8.3. Company Financials
- 12.1.8.4. SWOT Analysis
- 12.1.9 G3 Enterprises
- 12.1.9.1. Company Overview
- 12.1.9.2. Products
- 12.1.9.3. Company Financials
- 12.1.9.4. SWOT Analysis
- 12.1.10 Maverick Enterprises
- 12.1.10.1. Company Overview
- 12.1.10.2. Products
- 12.1.10.3. Company Financials
- 12.1.10.4. SWOT Analysis
- 12.1.11 Guala Closures
- 12.1.11.1. Company Overview
- 12.1.11.2. Products
- 12.1.11.3. Company Financials
- 12.1.11.4. SWOT Analysis
- 12.1.12 Owens-Illinois Group
- 12.1.12.1. Company Overview
- 12.1.12.2. Products
- 12.1.12.3. Company Financials
- 12.1.12.4. SWOT Analysis
- 12.1.13 International Paper
- 12.1.13.1. Company Overview
- 12.1.13.2. Products
- 12.1.13.3. Company Financials
- 12.1.13.4. SWOT Analysis
- 12.1.1 Encore Glass
- 12.2. Market Entropy
- 12.2.1 Company's Key Areas Served
- 12.2.2 Recent Developments
- 12.3. Company Market Share Analysis 2025
- 12.3.1 Top 5 Companies Market Share Analysis
- 12.3.2 Top 3 Companies Market Share Analysis
- 12.4. List of Potential Customers
- 13. Research Methodology
List of Figures
- Figure 1: Global Wine Packaging Industry Revenue Breakdown (USD Billion, %) by Region 2025 & 2033
- Figure 2: Global Wine Packaging Industry Volume Breakdown (K Tons, %) by Region 2025 & 2033
- Figure 3: North America Wine Packaging Industry Revenue (USD Billion), by Material Type 2025 & 2033
- Figure 4: North America Wine Packaging Industry Volume (K Tons), by Material Type 2025 & 2033
- Figure 5: North America Wine Packaging Industry Revenue Share (%), by Material Type 2025 & 2033
- Figure 6: North America Wine Packaging Industry Volume Share (%), by Material Type 2025 & 2033
- Figure 7: North America Wine Packaging Industry Revenue (USD Billion), by Product Type 2025 & 2033
- Figure 8: North America Wine Packaging Industry Volume (K Tons), by Product Type 2025 & 2033
- Figure 9: North America Wine Packaging Industry Revenue Share (%), by Product Type 2025 & 2033
- Figure 10: North America Wine Packaging Industry Volume Share (%), by Product Type 2025 & 2033
- Figure 11: North America Wine Packaging Industry Revenue (USD Billion), by Country 2025 & 2033
- Figure 12: North America Wine Packaging Industry Volume (K Tons), by Country 2025 & 2033
- Figure 13: North America Wine Packaging Industry Revenue Share (%), by Country 2025 & 2033
- Figure 14: North America Wine Packaging Industry Volume Share (%), by Country 2025 & 2033
- Figure 15: Europe Wine Packaging Industry Revenue (USD Billion), by Material Type 2025 & 2033
- Figure 16: Europe Wine Packaging Industry Volume (K Tons), by Material Type 2025 & 2033
- Figure 17: Europe Wine Packaging Industry Revenue Share (%), by Material Type 2025 & 2033
- Figure 18: Europe Wine Packaging Industry Volume Share (%), by Material Type 2025 & 2033
- Figure 19: Europe Wine Packaging Industry Revenue (USD Billion), by Product Type 2025 & 2033
- Figure 20: Europe Wine Packaging Industry Volume (K Tons), by Product Type 2025 & 2033
- Figure 21: Europe Wine Packaging Industry Revenue Share (%), by Product Type 2025 & 2033
- Figure 22: Europe Wine Packaging Industry Volume Share (%), by Product Type 2025 & 2033
- Figure 23: Europe Wine Packaging Industry Revenue (USD Billion), by Country 2025 & 2033
- Figure 24: Europe Wine Packaging Industry Volume (K Tons), by Country 2025 & 2033
- Figure 25: Europe Wine Packaging Industry Revenue Share (%), by Country 2025 & 2033
- Figure 26: Europe Wine Packaging Industry Volume Share (%), by Country 2025 & 2033
- Figure 27: Asia Pacific Wine Packaging Industry Revenue (USD Billion), by Material Type 2025 & 2033
- Figure 28: Asia Pacific Wine Packaging Industry Volume (K Tons), by Material Type 2025 & 2033
- Figure 29: Asia Pacific Wine Packaging Industry Revenue Share (%), by Material Type 2025 & 2033
- Figure 30: Asia Pacific Wine Packaging Industry Volume Share (%), by Material Type 2025 & 2033
- Figure 31: Asia Pacific Wine Packaging Industry Revenue (USD Billion), by Product Type 2025 & 2033
- Figure 32: Asia Pacific Wine Packaging Industry Volume (K Tons), by Product Type 2025 & 2033
- Figure 33: Asia Pacific Wine Packaging Industry Revenue Share (%), by Product Type 2025 & 2033
- Figure 34: Asia Pacific Wine Packaging Industry Volume Share (%), by Product Type 2025 & 2033
- Figure 35: Asia Pacific Wine Packaging Industry Revenue (USD Billion), by Country 2025 & 2033
- Figure 36: Asia Pacific Wine Packaging Industry Volume (K Tons), by Country 2025 & 2033
- Figure 37: Asia Pacific Wine Packaging Industry Revenue Share (%), by Country 2025 & 2033
- Figure 38: Asia Pacific Wine Packaging Industry Volume Share (%), by Country 2025 & 2033
- Figure 39: Latin America Wine Packaging Industry Revenue (USD Billion), by Material Type 2025 & 2033
- Figure 40: Latin America Wine Packaging Industry Volume (K Tons), by Material Type 2025 & 2033
- Figure 41: Latin America Wine Packaging Industry Revenue Share (%), by Material Type 2025 & 2033
- Figure 42: Latin America Wine Packaging Industry Volume Share (%), by Material Type 2025 & 2033
- Figure 43: Latin America Wine Packaging Industry Revenue (USD Billion), by Product Type 2025 & 2033
- Figure 44: Latin America Wine Packaging Industry Volume (K Tons), by Product Type 2025 & 2033
- Figure 45: Latin America Wine Packaging Industry Revenue Share (%), by Product Type 2025 & 2033
- Figure 46: Latin America Wine Packaging Industry Volume Share (%), by Product Type 2025 & 2033
- Figure 47: Latin America Wine Packaging Industry Revenue (USD Billion), by Country 2025 & 2033
- Figure 48: Latin America Wine Packaging Industry Volume (K Tons), by Country 2025 & 2033
- Figure 49: Latin America Wine Packaging Industry Revenue Share (%), by Country 2025 & 2033
- Figure 50: Latin America Wine Packaging Industry Volume Share (%), by Country 2025 & 2033
- Figure 51: Middle East and Africa Wine Packaging Industry Revenue (USD Billion), by Material Type 2025 & 2033
- Figure 52: Middle East and Africa Wine Packaging Industry Volume (K Tons), by Material Type 2025 & 2033
- Figure 53: Middle East and Africa Wine Packaging Industry Revenue Share (%), by Material Type 2025 & 2033
- Figure 54: Middle East and Africa Wine Packaging Industry Volume Share (%), by Material Type 2025 & 2033
- Figure 55: Middle East and Africa Wine Packaging Industry Revenue (USD Billion), by Product Type 2025 & 2033
- Figure 56: Middle East and Africa Wine Packaging Industry Volume (K Tons), by Product Type 2025 & 2033
- Figure 57: Middle East and Africa Wine Packaging Industry Revenue Share (%), by Product Type 2025 & 2033
- Figure 58: Middle East and Africa Wine Packaging Industry Volume Share (%), by Product Type 2025 & 2033
- Figure 59: Middle East and Africa Wine Packaging Industry Revenue (USD Billion), by Country 2025 & 2033
- Figure 60: Middle East and Africa Wine Packaging Industry Volume (K Tons), by Country 2025 & 2033
- Figure 61: Middle East and Africa Wine Packaging Industry Revenue Share (%), by Country 2025 & 2033
- Figure 62: Middle East and Africa Wine Packaging Industry Volume Share (%), by Country 2025 & 2033
List of Tables
- Table 1: Global Wine Packaging Industry Revenue USD Billion Forecast, by Material Type 2020 & 2033
- Table 2: Global Wine Packaging Industry Volume K Tons Forecast, by Material Type 2020 & 2033
- Table 3: Global Wine Packaging Industry Revenue USD Billion Forecast, by Product Type 2020 & 2033
- Table 4: Global Wine Packaging Industry Volume K Tons Forecast, by Product Type 2020 & 2033
- Table 5: Global Wine Packaging Industry Revenue USD Billion Forecast, by Region 2020 & 2033
- Table 6: Global Wine Packaging Industry Volume K Tons Forecast, by Region 2020 & 2033
- Table 7: Global Wine Packaging Industry Revenue USD Billion Forecast, by Material Type 2020 & 2033
- Table 8: Global Wine Packaging Industry Volume K Tons Forecast, by Material Type 2020 & 2033
- Table 9: Global Wine Packaging Industry Revenue USD Billion Forecast, by Product Type 2020 & 2033
- Table 10: Global Wine Packaging Industry Volume K Tons Forecast, by Product Type 2020 & 2033
- Table 11: Global Wine Packaging Industry Revenue USD Billion Forecast, by Country 2020 & 2033
- Table 12: Global Wine Packaging Industry Volume K Tons Forecast, by Country 2020 & 2033
- Table 13: United States Wine Packaging Industry Revenue (USD Billion) Forecast, by Application 2020 & 2033
- Table 14: United States Wine Packaging Industry Volume (K Tons) Forecast, by Application 2020 & 2033
- Table 15: Canada Wine Packaging Industry Revenue (USD Billion) Forecast, by Application 2020 & 2033
- Table 16: Canada Wine Packaging Industry Volume (K Tons) Forecast, by Application 2020 & 2033
- Table 17: Global Wine Packaging Industry Revenue USD Billion Forecast, by Material Type 2020 & 2033
- Table 18: Global Wine Packaging Industry Volume K Tons Forecast, by Material Type 2020 & 2033
- Table 19: Global Wine Packaging Industry Revenue USD Billion Forecast, by Product Type 2020 & 2033
- Table 20: Global Wine Packaging Industry Volume K Tons Forecast, by Product Type 2020 & 2033
- Table 21: Global Wine Packaging Industry Revenue USD Billion Forecast, by Country 2020 & 2033
- Table 22: Global Wine Packaging Industry Volume K Tons Forecast, by Country 2020 & 2033
- Table 23: United Kingdom Wine Packaging Industry Revenue (USD Billion) Forecast, by Application 2020 & 2033
- Table 24: United Kingdom Wine Packaging Industry Volume (K Tons) Forecast, by Application 2020 & 2033
- Table 25: Germany Wine Packaging Industry Revenue (USD Billion) Forecast, by Application 2020 & 2033
- Table 26: Germany Wine Packaging Industry Volume (K Tons) Forecast, by Application 2020 & 2033
- Table 27: Italy Wine Packaging Industry Revenue (USD Billion) Forecast, by Application 2020 & 2033
- Table 28: Italy Wine Packaging Industry Volume (K Tons) Forecast, by Application 2020 & 2033
- Table 29: France Wine Packaging Industry Revenue (USD Billion) Forecast, by Application 2020 & 2033
- Table 30: France Wine Packaging Industry Volume (K Tons) Forecast, by Application 2020 & 2033
- Table 31: Spain Wine Packaging Industry Revenue (USD Billion) Forecast, by Application 2020 & 2033
- Table 32: Spain Wine Packaging Industry Volume (K Tons) Forecast, by Application 2020 & 2033
- Table 33: Rest of Europe Wine Packaging Industry Revenue (USD Billion) Forecast, by Application 2020 & 2033
- Table 34: Rest of Europe Wine Packaging Industry Volume (K Tons) Forecast, by Application 2020 & 2033
- Table 35: Global Wine Packaging Industry Revenue USD Billion Forecast, by Material Type 2020 & 2033
- Table 36: Global Wine Packaging Industry Volume K Tons Forecast, by Material Type 2020 & 2033
- Table 37: Global Wine Packaging Industry Revenue USD Billion Forecast, by Product Type 2020 & 2033
- Table 38: Global Wine Packaging Industry Volume K Tons Forecast, by Product Type 2020 & 2033
- Table 39: Global Wine Packaging Industry Revenue USD Billion Forecast, by Country 2020 & 2033
- Table 40: Global Wine Packaging Industry Volume K Tons Forecast, by Country 2020 & 2033
- Table 41: China Wine Packaging Industry Revenue (USD Billion) Forecast, by Application 2020 & 2033
- Table 42: China Wine Packaging Industry Volume (K Tons) Forecast, by Application 2020 & 2033
- Table 43: Japan Wine Packaging Industry Revenue (USD Billion) Forecast, by Application 2020 & 2033
- Table 44: Japan Wine Packaging Industry Volume (K Tons) Forecast, by Application 2020 & 2033
- Table 45: Australia and New Zealand Wine Packaging Industry Revenue (USD Billion) Forecast, by Application 2020 & 2033
- Table 46: Australia and New Zealand Wine Packaging Industry Volume (K Tons) Forecast, by Application 2020 & 2033
- Table 47: Rest of Asia Pacific Wine Packaging Industry Revenue (USD Billion) Forecast, by Application 2020 & 2033
- Table 48: Rest of Asia Pacific Wine Packaging Industry Volume (K Tons) Forecast, by Application 2020 & 2033
- Table 49: Global Wine Packaging Industry Revenue USD Billion Forecast, by Material Type 2020 & 2033
- Table 50: Global Wine Packaging Industry Volume K Tons Forecast, by Material Type 2020 & 2033
- Table 51: Global Wine Packaging Industry Revenue USD Billion Forecast, by Product Type 2020 & 2033
- Table 52: Global Wine Packaging Industry Volume K Tons Forecast, by Product Type 2020 & 2033
- Table 53: Global Wine Packaging Industry Revenue USD Billion Forecast, by Country 2020 & 2033
- Table 54: Global Wine Packaging Industry Volume K Tons Forecast, by Country 2020 & 2033
- Table 55: Global Wine Packaging Industry Revenue USD Billion Forecast, by Material Type 2020 & 2033
- Table 56: Global Wine Packaging Industry Volume K Tons Forecast, by Material Type 2020 & 2033
- Table 57: Global Wine Packaging Industry Revenue USD Billion Forecast, by Product Type 2020 & 2033
- Table 58: Global Wine Packaging Industry Volume K Tons Forecast, by Product Type 2020 & 2033
- Table 59: Global Wine Packaging Industry Revenue USD Billion Forecast, by Country 2020 & 2033
- Table 60: Global Wine Packaging Industry Volume K Tons Forecast, by Country 2020 & 2033
Frequently Asked Questions
1. What is the projected Compound Annual Growth Rate (CAGR) of the Wine Packaging Industry?
The projected CAGR is approximately 5.48%.
2. Which companies are prominent players in the Wine Packaging Industry?
Key companies in the market include Encore Glass, Ardagh Group, Tetra Laval International, Liqui-Box Corporation ( Dow Chemical Company), Saverglass SAS, Scholle Corporation, TricorBraun Incorporate, Ball Corporation, G3 Enterprises, Maverick Enterprises, Guala Closures, Owens-Illinois Group, International Paper.
3. What are the main segments of the Wine Packaging Industry?
The market segments include Material Type, Product Type.
4. Can you provide details about the market size?
The market size is estimated to be USD 5.69 USD Billion as of 2022.
5. What are some drivers contributing to market growth?
Innovative Packaging and Attractive Marketing.
6. What are the notable trends driving market growth?
Growing Consumption of Premium Wines.
7. Are there any restraints impacting market growth?
Stringent Government Regulations over Single-Use Plastic-based Packaging.
8. Can you provide examples of recent developments in the market?
December 2022: In the Wine Industry Impacts Awards (WIIA) announced in December 2022, presented by the Wine Industry Suppliers Association (WISA), Orora Glass took out the top prize in the Packaging & Design category for its lightweight sparkling wine bottle. It was described as a fantastic and sustainable packaging alternative for sparkling beverages, 100 grams lighter than the brand's standard sparkling bottle yet having the same diameter, height, and GV rating.
9. What pricing options are available for accessing the report?
Pricing options include single-user, multi-user, and enterprise licenses priced at USD 4750, USD 5250, and USD 8750 respectively.
10. Is the market size provided in terms of value or volume?
The market size is provided in terms of value, measured in USD Billion and volume, measured in K Tons.
11. Are there any specific market keywords associated with the report?
Yes, the market keyword associated with the report is "Wine Packaging Industry," which aids in identifying and referencing the specific market segment covered.
12. How do I determine which pricing option suits my needs best?
The pricing options vary based on user requirements and access needs. Individual users may opt for single-user licenses, while businesses requiring broader access may choose multi-user or enterprise licenses for cost-effective access to the report.
13. Are there any additional resources or data provided in the Wine Packaging Industry report?
While the report offers comprehensive insights, it's advisable to review the specific contents or supplementary materials provided to ascertain if additional resources or data are available.
14. How can I stay updated on further developments or reports in the Wine Packaging Industry?
To stay informed about further developments, trends, and reports in the Wine Packaging Industry, consider subscribing to industry newsletters, following relevant companies and organizations, or regularly checking reputable industry news sources and publications.
Methodology
Step 1 - Identification of Relevant Samples Size from Population Database


Step 2 - Approaches for Defining Global Market Size (Value, Volume* & Price*)

Note*: In applicable scenarios
Step 3 - Data Sources
Primary Research
- Web Analytics
- Survey Reports
- Research Institute
- Latest Research Reports
- Opinion Leaders
Secondary Research
- Annual Reports
- White Paper
- Latest Press Release
- Industry Association
- Paid Database
- Investor Presentations

Step 4 - Data Triangulation
Involves using different sources of information in order to increase the validity of a study
These sources are likely to be stakeholders in a program - participants, other researchers, program staff, other community members, and so on.
Then we put all data in single framework & apply various statistical tools to find out the dynamic on the market.
During the analysis stage, feedback from the stakeholder groups would be compared to determine areas of agreement as well as areas of divergence