

Key Insights
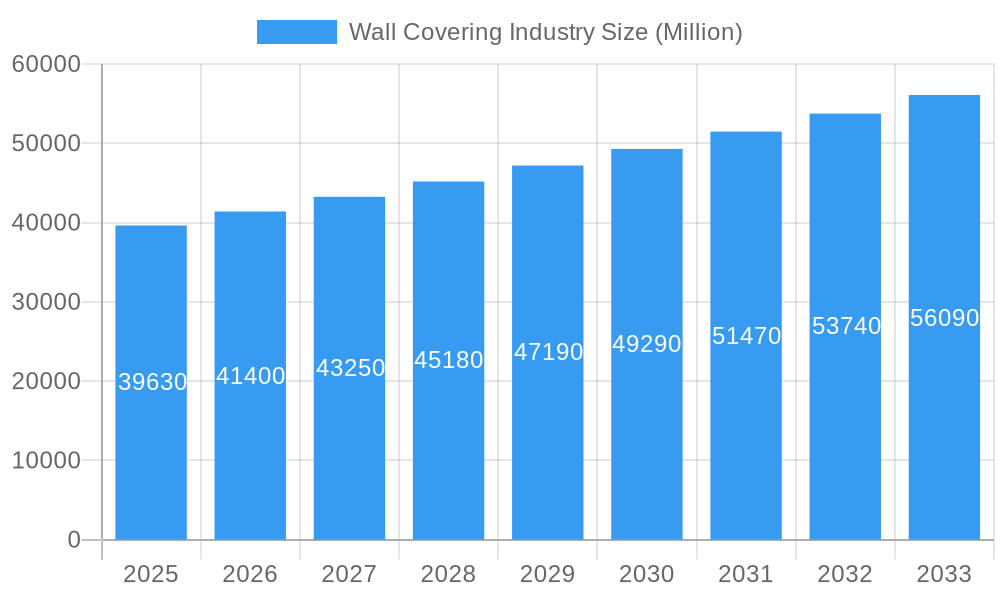
The global wall covering market, valued at $39.63 billion in 2025, is projected to experience robust growth, driven by a compound annual growth rate (CAGR) of 4.47% from 2025 to 2033. This expansion is fueled by several key factors. The increasing preference for aesthetically pleasing and functional interior design in both residential and commercial spaces is a significant driver. Rising disposable incomes, particularly in developing economies, are fueling demand for higher-quality wall coverings, boosting market growth. Furthermore, the burgeoning construction industry, especially in urban areas, contributes significantly to market expansion. Innovative product developments, such as eco-friendly and durable wall coverings, are further enhancing market appeal. The e-commerce segment is also experiencing substantial growth, providing consumers with greater convenience and access to a wider variety of products. While challenges such as fluctuating raw material prices and economic downturns exist, the overall market outlook remains positive, with projected strong growth throughout the forecast period.
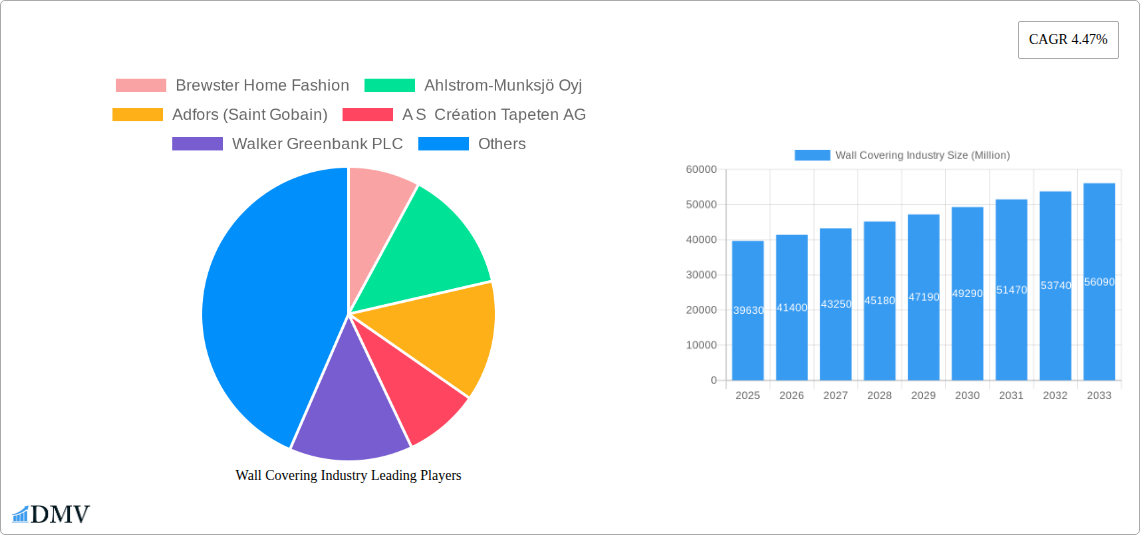
Wall Covering Industry Market Size (In Billion)
The market segmentation reveals interesting dynamics. The residential sector currently holds a larger market share compared to the commercial sector, though both are expected to experience considerable growth. Within product types, wallpaper maintains a dominant position, although tile and metal wall coverings are gaining popularity due to their durability and modern aesthetics. Distribution channels are diversifying, with online retailers witnessing increasing market penetration, alongside traditional channels such as specialty stores and home centers. Geographically, North America and Europe currently dominate the market, but the Asia-Pacific region is anticipated to witness significant growth in the coming years, driven by rapid urbanization and rising construction activity in countries like China and India. Key players in the industry are strategically investing in product innovation, expansion into new markets, and mergers and acquisitions to strengthen their market positions and capitalize on the growth opportunities.
Wall Covering Industry Company Market Share
Wall Covering Industry Market Report: 2019-2033
This comprehensive report provides an in-depth analysis of the global wall covering industry, offering invaluable insights for stakeholders seeking to understand market trends, competitive dynamics, and future growth opportunities. The study period covers 2019-2033, with 2025 as the base and estimated year, and a forecast period of 2025-2033. The report meticulously analyzes the market's evolution, leading players, and key developments, providing a clear roadmap for strategic decision-making. The total market value is predicted to reach xx Million by 2033.
Wall Covering Industry Market Composition & Trends
The global wall covering market is characterized by a moderately concentrated structure, with the leading 10 players collectively holding an estimated 40% of the market share as of 2024. This indicates a dynamic landscape where established brands coexist with a significant number of smaller and regional manufacturers. Innovation remains a key differentiator, primarily driven by the growing demand for sustainable materials such as recycled content, bamboo, and natural fibers. Furthermore, advancements in digital printing technologies are enabling greater customization, intricate designs, and faster production cycles. The regulatory environment is increasingly emphasizing eco-friendly products, pushing manufacturers to adopt sustainable practices and develop low-VOC (Volatile Organic Compound) options. While paints and textured finishes represent substitute products, their competitive pressure is considered moderate due to the aesthetic and functional advantages offered by wall coverings. The primary end-users of wall coverings are the residential and commercial sectors, with the residential segment currently dominating demand, driven by renovations and new construction projects. Mergers and acquisitions (M&A) activity within the industry has been moderate, reflecting a consolidation phase with an average deal value of approximately XX Million over the last five years. This strategic activity is aimed at expanding market reach, acquiring innovative technologies, and strengthening product portfolios.
- Market Share Distribution (2024): Top 10 Players – 40%; Other Market Participants – 60%
- Average M&A Deal Value (2019-2024): XX Million
- Key Innovation Drivers: Advancements in sustainable material sourcing, high-resolution digital printing, and hyper-personalized design capabilities.
- Major End-Users: Residential Sector (estimated 65% market influence), Commercial Sector (estimated 35% market influence) – encompassing hospitality, healthcare, and corporate spaces.
Wall Covering Industry Evolution
The global wall covering market witnessed a Compound Annual Growth Rate (CAGR) of xx% during the historical period (2019-2024). This growth is attributed to increasing disposable incomes, rising urbanization, and a growing preference for aesthetically pleasing interiors. Technological advancements, particularly in digital printing and smart materials, have broadened the range of designs and functionalities available. Consumer demands are shifting towards sustainable, eco-friendly options, prompting manufacturers to develop products with recycled materials and reduced environmental impact. The forecast period (2025-2033) projects continued growth, driven by factors such as expansion in emerging markets and the increasing adoption of online sales channels. The market is expected to reach xx Million by 2033. Demand for innovative designs and sustainable materials will continue to shape the industry's trajectory.
Leading Regions, Countries, or Segments in Wall Covering Industry
The North American region currently holds the largest market share, driven by strong consumer spending and a robust construction industry. Within the segments:
- By Distribution Channel: E-commerce is experiencing rapid growth, while specialty stores retain a significant market share due to personalized service and product expertise. Home centers also represent a substantial market segment.
- By Product Type: Wallpaper continues to dominate, though wall panels are gaining traction due to their ease of installation and durability.
- By Application: The residential sector remains the largest application area, although the commercial sector is witnessing increasing demand driven by refurbishment and new construction projects.
Key Drivers:
- North America: Strong consumer spending, robust construction activity, preference for high-quality products.
- E-commerce: Convenience, wider selection, competitive pricing.
- Wall Panels: Ease of installation, durability, cost-effectiveness.
Wall Covering Industry Product Innovations
Recent innovations include the use of sustainable materials like bamboo and recycled fibers, along with advancements in digital printing technology enabling highly customized designs. Smart wall coverings with integrated technology such as temperature control or sound insulation are emerging, offering enhanced functionalities. These innovations cater to growing consumer demand for both aesthetics and practicality, leading to a more diverse and responsive market.
Propelling Factors for Wall Covering Industry Growth
Several factors fuel the industry's growth:
- Rising Disposable Incomes: Increased spending power in developing economies is driving demand for home improvement and interior design.
- Urbanization: Growth in urban populations creates a greater need for housing and commercial spaces, boosting demand for wall coverings.
- Technological Advancements: Digital printing, sustainable materials, and smart functionalities are enhancing product offerings.
Obstacles in the Wall Covering Industry Market
Despite its growth potential, the wall covering industry faces several significant challenges that impact its operational efficiency and profitability:
- Supply Chain Volatility: Global geopolitical events, trade disputes, and unforeseen disruptions can severely impact the availability and cost of essential raw materials and finished goods, leading to production delays and price fluctuations.
- Raw Material Price Volatility: Fluctuations in the prices of key inputs like paper, vinyl, inks, and adhesives directly affect manufacturing costs. This can erode profit margins if not managed effectively through strategic sourcing and hedging.
- Intense Market Competition: The industry experiences fierce competition from a diverse range of players, including large multinational corporations, specialized niche manufacturers, and emerging low-cost producers. This rivalry exerts continuous pressure on pricing and necessitates constant innovation and differentiation.
- Consumer Preferences and Trends: Rapidly changing consumer tastes and interior design trends require manufacturers to be agile in their product development and marketing efforts. Failure to adapt can lead to product obsolescence.
- Sustainability Demands: While an opportunity, meeting increasingly stringent environmental regulations and consumer demand for truly sustainable products can also be a challenge, requiring significant investment in R&D and new manufacturing processes.
Future Opportunities in Wall Covering Industry
The wall covering industry is poised for significant growth, driven by several promising opportunities:
- Expansion into Emerging Markets: Developing economies, with their burgeoning middle classes and increasing urbanization, represent a substantial untapped market. Rising disposable incomes and a growing demand for aesthetically pleasing and functional home and commercial spaces present a significant growth avenue.
- Development and Promotion of Eco-Conscious Products: The escalating global concern for environmental sustainability fuels a strong demand for wall coverings made from recycled materials, renewable resources, and those with low environmental impact. Manufacturers focusing on certifications and transparent sourcing can gain a competitive edge.
- Integration of Smart and Functional Technologies: There is a growing opportunity to embed smart functionalities into wall coverings, such as integrated lighting, soundproofing capabilities, air purification properties, and even interactive display surfaces. This opens up new premium product categories and applications beyond traditional aesthetics.
- Customization and Personalization: Leveraging digital printing and advanced design software, the industry can offer highly personalized and bespoke wall covering solutions, catering to individual customer needs and niche design preferences in both residential and commercial projects.
- Growth in the Renovation and Remodeling Sector: A significant portion of wall covering demand comes from the renovation and remodeling market, which is expected to remain robust globally, offering consistent opportunities for product upgrades and aesthetic enhancements.
Major Players in the Wall Covering Industry Ecosystem
The wall covering industry ecosystem comprises a diverse range of companies, from global giants to specialized manufacturers. Key players influencing the market include:
- Brewster Home Fashions
- Ahlstrom-Munksjö Oyj
- Adfors (part of Saint Gobain)
- A S Création Tapeten AG
- Walker Greenbank PLC
- Grandeco Wallfashion Group
- Benjamin Moore & Co.
- J Josephson Inc.
- Asian Paints Ltd.
- York Wallcoverings Inc.
Key Developments in Wall Covering Industry Industry
- May 2023: Asian Paints launched its home studio in Chennai, showcasing its 2023 home décor collection, including wallpapers. This expands their retail presence and product offerings.
- August 2022: Sanderson Design Group partnered with Disney to produce Disney-themed wallpapers and textiles, strengthening brand appeal and broadening its product portfolio.
Strategic Wall Covering Industry Market Forecast
The wall covering market is poised for continued growth, driven by ongoing urbanization, rising disposable incomes, and technological advancements. The demand for sustainable and innovative products will be a key driver, creating opportunities for companies that can meet these evolving consumer preferences. The market is projected to reach xx Million by 2033, presenting substantial potential for both established players and new entrants.
Wall Covering Industry Segmentation
-
1. Product Type
- 1.1. Wall Panel
-
1.2. Wall Paper
- 1.2.1. Vinyl Wallpaper
- 1.2.2. Non-woven Wallpaper
- 1.2.3. Paper-based Wallpaper
- 1.2.4. Fabric Wallpaper
- 1.2.5. Other Wallpaper Types
- 1.3. Tile
- 1.4. Metal Wall Covering
- 1.5. Other Product Types
-
2. Application
- 2.1. Commercial
- 2.2. Residential
-
3. Distribution Channel
- 3.1. Specialty Store
- 3.2. Home Center
- 3.3. Building Material Dealer
- 3.4. Furniture Store
- 3.5. Mass Merchandizer
- 3.6. E-commerce
- 3.7. Other Distribution Channels
Wall Covering Industry Segmentation By Geography
-
1. North America
- 1.1. United States
- 1.2. Canada
-
2. Europe
- 2.1. United Kingdom
- 2.2. Germany
- 2.3. France
- 2.4. Spain
- 2.5. Italy
-
3. Asia Pacific
- 3.1. China
- 3.2. India
- 3.3. Japan
- 4. Australia and New Zealand
-
5. Latin America
- 5.1. Brazil
- 5.2. Mexico
- 5.3. Argentina
-
6. Middle East and Africa
- 6.1. Saudi Arabia
- 6.2. United Arab Emirates
- 6.3. South Africa
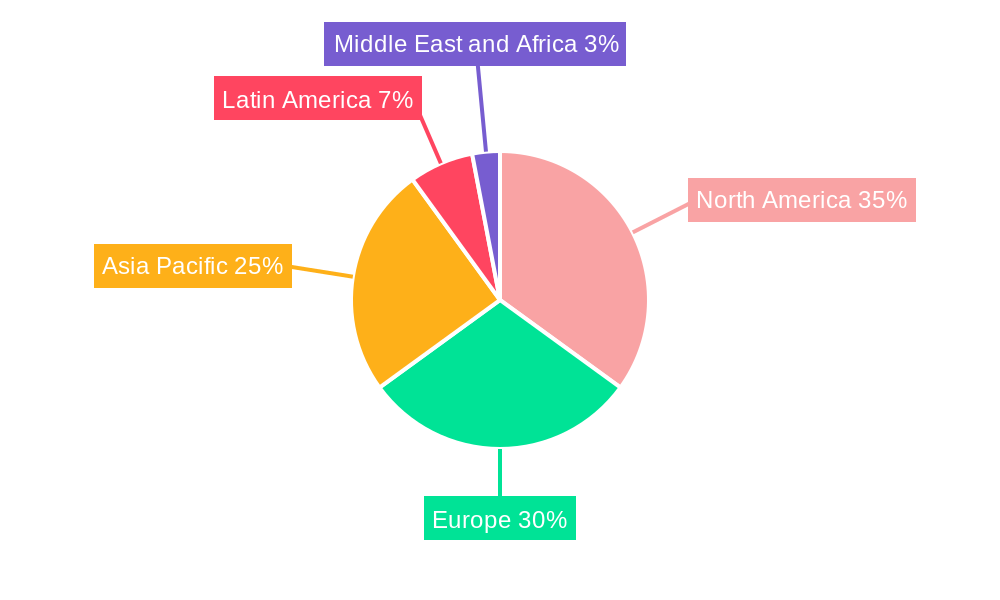
Wall Covering Industry Regional Market Share
Geographic Coverage of Wall Covering Industry
Wall Covering Industry REPORT HIGHLIGHTS
| Aspects | Details |
|---|---|
| Study Period | 2020-2034 |
| Base Year | 2025 |
| Estimated Year | 2026 |
| Forecast Period | 2026-2034 |
| Historical Period | 2020-2025 |
| Growth Rate | CAGR of 4.47% from 2020-2034 |
| Segmentation |
|
Table of Contents
- 1. Introduction
- 1.1. Research Scope
- 1.2. Market Segmentation
- 1.3. Research Objective
- 1.4. Definitions and Assumptions
- 2. Executive Summary
- 2.1. Market Snapshot
- 3. Market Dynamics
- 3.1. Market Drivers
- 3.2. Market Restrains
- 3.3. Market Trends
- 3.4. Market Opportunities
- 4. Market Factor Analysis
- 4.1. Porters Five Forces
- 4.1.1. Bargaining Power of Suppliers
- 4.1.2. Bargaining Power of Buyers
- 4.1.3. Threat of New Entrants
- 4.1.4. Threat of Substitutes
- 4.1.5. Competitive Rivalry
- 4.2. PESTEL analysis
- 4.3. BCG Analysis
- 4.3.1. Stars (High Growth, High Market Share)
- 4.3.2. Cash Cows (Low Growth, High Market Share)
- 4.3.3. Question Mark (High Growth, Low Market Share)
- 4.3.4. Dogs (Low Growth, Low Market Share)
- 4.4. Ansoff Matrix Analysis
- 4.5. Supply Chain Analysis
- 4.6. Regulatory Landscape
- 4.7. Current Market Potential and Opportunity Assessment (TAM–SAM–SOM Framework)
- 4.8. DMV Analyst Note
- 4.1. Porters Five Forces
- 5. Market Analysis, Insights and Forecast 2021-2033
- 5.1. Market Analysis, Insights and Forecast - by Product Type
- 5.1.1. Wall Panel
- 5.1.2. Wall Paper
- 5.1.2.1. Vinyl Wallpaper
- 5.1.2.2. Non-woven Wallpaper
- 5.1.2.3. Paper-based Wallpaper
- 5.1.2.4. Fabric Wallpaper
- 5.1.2.5. Other Wallpaper Types
- 5.1.3. Tile
- 5.1.4. Metal Wall Covering
- 5.1.5. Other Product Types
- 5.2. Market Analysis, Insights and Forecast - by Application
- 5.2.1. Commercial
- 5.2.2. Residential
- 5.3. Market Analysis, Insights and Forecast - by Distribution Channel
- 5.3.1. Specialty Store
- 5.3.2. Home Center
- 5.3.3. Building Material Dealer
- 5.3.4. Furniture Store
- 5.3.5. Mass Merchandizer
- 5.3.6. E-commerce
- 5.3.7. Other Distribution Channels
- 5.4. Market Analysis, Insights and Forecast - by Region
- 5.4.1. North America
- 5.4.2. Europe
- 5.4.3. Asia Pacific
- 5.4.4. Australia and New Zealand
- 5.4.5. Latin America
- 5.4.6. Middle East and Africa
- 5.1. Market Analysis, Insights and Forecast - by Product Type
- 6. Global Wall Covering Industry Analysis, Insights and Forecast, 2021-2033
- 6.1. Market Analysis, Insights and Forecast - by Product Type
- 6.1.1. Wall Panel
- 6.1.2. Wall Paper
- 6.1.2.1. Vinyl Wallpaper
- 6.1.2.2. Non-woven Wallpaper
- 6.1.2.3. Paper-based Wallpaper
- 6.1.2.4. Fabric Wallpaper
- 6.1.2.5. Other Wallpaper Types
- 6.1.3. Tile
- 6.1.4. Metal Wall Covering
- 6.1.5. Other Product Types
- 6.2. Market Analysis, Insights and Forecast - by Application
- 6.2.1. Commercial
- 6.2.2. Residential
- 6.3. Market Analysis, Insights and Forecast - by Distribution Channel
- 6.3.1. Specialty Store
- 6.3.2. Home Center
- 6.3.3. Building Material Dealer
- 6.3.4. Furniture Store
- 6.3.5. Mass Merchandizer
- 6.3.6. E-commerce
- 6.3.7. Other Distribution Channels
- 6.1. Market Analysis, Insights and Forecast - by Product Type
- 7. North America Wall Covering Industry Analysis, Insights and Forecast, 2020-2032
- 7.1. Market Analysis, Insights and Forecast - by Product Type
- 7.1.1. Wall Panel
- 7.1.2. Wall Paper
- 7.1.2.1. Vinyl Wallpaper
- 7.1.2.2. Non-woven Wallpaper
- 7.1.2.3. Paper-based Wallpaper
- 7.1.2.4. Fabric Wallpaper
- 7.1.2.5. Other Wallpaper Types
- 7.1.3. Tile
- 7.1.4. Metal Wall Covering
- 7.1.5. Other Product Types
- 7.2. Market Analysis, Insights and Forecast - by Application
- 7.2.1. Commercial
- 7.2.2. Residential
- 7.3. Market Analysis, Insights and Forecast - by Distribution Channel
- 7.3.1. Specialty Store
- 7.3.2. Home Center
- 7.3.3. Building Material Dealer
- 7.3.4. Furniture Store
- 7.3.5. Mass Merchandizer
- 7.3.6. E-commerce
- 7.3.7. Other Distribution Channels
- 7.1. Market Analysis, Insights and Forecast - by Product Type
- 8. Europe Wall Covering Industry Analysis, Insights and Forecast, 2020-2032
- 8.1. Market Analysis, Insights and Forecast - by Product Type
- 8.1.1. Wall Panel
- 8.1.2. Wall Paper
- 8.1.2.1. Vinyl Wallpaper
- 8.1.2.2. Non-woven Wallpaper
- 8.1.2.3. Paper-based Wallpaper
- 8.1.2.4. Fabric Wallpaper
- 8.1.2.5. Other Wallpaper Types
- 8.1.3. Tile
- 8.1.4. Metal Wall Covering
- 8.1.5. Other Product Types
- 8.2. Market Analysis, Insights and Forecast - by Application
- 8.2.1. Commercial
- 8.2.2. Residential
- 8.3. Market Analysis, Insights and Forecast - by Distribution Channel
- 8.3.1. Specialty Store
- 8.3.2. Home Center
- 8.3.3. Building Material Dealer
- 8.3.4. Furniture Store
- 8.3.5. Mass Merchandizer
- 8.3.6. E-commerce
- 8.3.7. Other Distribution Channels
- 8.1. Market Analysis, Insights and Forecast - by Product Type
- 9. Asia Pacific Wall Covering Industry Analysis, Insights and Forecast, 2020-2032
- 9.1. Market Analysis, Insights and Forecast - by Product Type
- 9.1.1. Wall Panel
- 9.1.2. Wall Paper
- 9.1.2.1. Vinyl Wallpaper
- 9.1.2.2. Non-woven Wallpaper
- 9.1.2.3. Paper-based Wallpaper
- 9.1.2.4. Fabric Wallpaper
- 9.1.2.5. Other Wallpaper Types
- 9.1.3. Tile
- 9.1.4. Metal Wall Covering
- 9.1.5. Other Product Types
- 9.2. Market Analysis, Insights and Forecast - by Application
- 9.2.1. Commercial
- 9.2.2. Residential
- 9.3. Market Analysis, Insights and Forecast - by Distribution Channel
- 9.3.1. Specialty Store
- 9.3.2. Home Center
- 9.3.3. Building Material Dealer
- 9.3.4. Furniture Store
- 9.3.5. Mass Merchandizer
- 9.3.6. E-commerce
- 9.3.7. Other Distribution Channels
- 9.1. Market Analysis, Insights and Forecast - by Product Type
- 10. Australia and New Zealand Wall Covering Industry Analysis, Insights and Forecast, 2020-2032
- 10.1. Market Analysis, Insights and Forecast - by Product Type
- 10.1.1. Wall Panel
- 10.1.2. Wall Paper
- 10.1.2.1. Vinyl Wallpaper
- 10.1.2.2. Non-woven Wallpaper
- 10.1.2.3. Paper-based Wallpaper
- 10.1.2.4. Fabric Wallpaper
- 10.1.2.5. Other Wallpaper Types
- 10.1.3. Tile
- 10.1.4. Metal Wall Covering
- 10.1.5. Other Product Types
- 10.2. Market Analysis, Insights and Forecast - by Application
- 10.2.1. Commercial
- 10.2.2. Residential
- 10.3. Market Analysis, Insights and Forecast - by Distribution Channel
- 10.3.1. Specialty Store
- 10.3.2. Home Center
- 10.3.3. Building Material Dealer
- 10.3.4. Furniture Store
- 10.3.5. Mass Merchandizer
- 10.3.6. E-commerce
- 10.3.7. Other Distribution Channels
- 10.1. Market Analysis, Insights and Forecast - by Product Type
- 11. Latin America Wall Covering Industry Analysis, Insights and Forecast, 2020-2032
- 11.1. Market Analysis, Insights and Forecast - by Product Type
- 11.1.1. Wall Panel
- 11.1.2. Wall Paper
- 11.1.2.1. Vinyl Wallpaper
- 11.1.2.2. Non-woven Wallpaper
- 11.1.2.3. Paper-based Wallpaper
- 11.1.2.4. Fabric Wallpaper
- 11.1.2.5. Other Wallpaper Types
- 11.1.3. Tile
- 11.1.4. Metal Wall Covering
- 11.1.5. Other Product Types
- 11.2. Market Analysis, Insights and Forecast - by Application
- 11.2.1. Commercial
- 11.2.2. Residential
- 11.3. Market Analysis, Insights and Forecast - by Distribution Channel
- 11.3.1. Specialty Store
- 11.3.2. Home Center
- 11.3.3. Building Material Dealer
- 11.3.4. Furniture Store
- 11.3.5. Mass Merchandizer
- 11.3.6. E-commerce
- 11.3.7. Other Distribution Channels
- 11.1. Market Analysis, Insights and Forecast - by Product Type
- 12. Middle East and Africa Wall Covering Industry Analysis, Insights and Forecast, 2020-2032
- 12.1. Market Analysis, Insights and Forecast - by Product Type
- 12.1.1. Wall Panel
- 12.1.2. Wall Paper
- 12.1.2.1. Vinyl Wallpaper
- 12.1.2.2. Non-woven Wallpaper
- 12.1.2.3. Paper-based Wallpaper
- 12.1.2.4. Fabric Wallpaper
- 12.1.2.5. Other Wallpaper Types
- 12.1.3. Tile
- 12.1.4. Metal Wall Covering
- 12.1.5. Other Product Types
- 12.2. Market Analysis, Insights and Forecast - by Application
- 12.2.1. Commercial
- 12.2.2. Residential
- 12.3. Market Analysis, Insights and Forecast - by Distribution Channel
- 12.3.1. Specialty Store
- 12.3.2. Home Center
- 12.3.3. Building Material Dealer
- 12.3.4. Furniture Store
- 12.3.5. Mass Merchandizer
- 12.3.6. E-commerce
- 12.3.7. Other Distribution Channels
- 12.1. Market Analysis, Insights and Forecast - by Product Type
- 13. Competitive Analysis
- 13.1. Company Profiles
- 13.1.1 Brewster Home Fashion
- 13.1.1.1. Company Overview
- 13.1.1.2. Products
- 13.1.1.3. Company Financials
- 13.1.1.4. SWOT Analysis
- 13.1.2 Ahlstrom-Munksjö Oyj
- 13.1.2.1. Company Overview
- 13.1.2.2. Products
- 13.1.2.3. Company Financials
- 13.1.2.4. SWOT Analysis
- 13.1.3 Adfors (Saint Gobain)
- 13.1.3.1. Company Overview
- 13.1.3.2. Products
- 13.1.3.3. Company Financials
- 13.1.3.4. SWOT Analysis
- 13.1.4 A S Création Tapeten AG
- 13.1.4.1. Company Overview
- 13.1.4.2. Products
- 13.1.4.3. Company Financials
- 13.1.4.4. SWOT Analysis
- 13.1.5 Walker Greenbank PLC
- 13.1.5.1. Company Overview
- 13.1.5.2. Products
- 13.1.5.3. Company Financials
- 13.1.5.4. SWOT Analysis
- 13.1.6 Grandeco Wallfashion Group
- 13.1.6.1. Company Overview
- 13.1.6.2. Products
- 13.1.6.3. Company Financials
- 13.1.6.4. SWOT Analysis
- 13.1.7 Benjamin Moore & Co
- 13.1.7.1. Company Overview
- 13.1.7.2. Products
- 13.1.7.3. Company Financials
- 13.1.7.4. SWOT Analysis
- 13.1.8 J Josephson Inc
- 13.1.8.1. Company Overview
- 13.1.8.2. Products
- 13.1.8.3. Company Financials
- 13.1.8.4. SWOT Analysis
- 13.1.9 Asian Paints Ltd
- 13.1.9.1. Company Overview
- 13.1.9.2. Products
- 13.1.9.3. Company Financials
- 13.1.9.4. SWOT Analysis
- 13.1.10 York Wallcoverings Inc
- 13.1.10.1. Company Overview
- 13.1.10.2. Products
- 13.1.10.3. Company Financials
- 13.1.10.4. SWOT Analysis
- 13.1.1 Brewster Home Fashion
- 13.2. Market Entropy
- 13.2.1 Company's Key Areas Served
- 13.2.2 Recent Developments
- 13.3. Company Market Share Analysis 2025
- 13.3.1 Top 5 Companies Market Share Analysis
- 13.3.2 Top 3 Companies Market Share Analysis
- 13.4. List of Potential Customers
- 14. Research Methodology
List of Figures
- Figure 1: Global Wall Covering Industry Revenue Breakdown (Million, %) by Region 2025 & 2033
- Figure 2: North America Wall Covering Industry Revenue (Million), by Product Type 2025 & 2033
- Figure 3: North America Wall Covering Industry Revenue Share (%), by Product Type 2025 & 2033
- Figure 4: North America Wall Covering Industry Revenue (Million), by Application 2025 & 2033
- Figure 5: North America Wall Covering Industry Revenue Share (%), by Application 2025 & 2033
- Figure 6: North America Wall Covering Industry Revenue (Million), by Distribution Channel 2025 & 2033
- Figure 7: North America Wall Covering Industry Revenue Share (%), by Distribution Channel 2025 & 2033
- Figure 8: North America Wall Covering Industry Revenue (Million), by Country 2025 & 2033
- Figure 9: North America Wall Covering Industry Revenue Share (%), by Country 2025 & 2033
- Figure 10: Europe Wall Covering Industry Revenue (Million), by Product Type 2025 & 2033
- Figure 11: Europe Wall Covering Industry Revenue Share (%), by Product Type 2025 & 2033
- Figure 12: Europe Wall Covering Industry Revenue (Million), by Application 2025 & 2033
- Figure 13: Europe Wall Covering Industry Revenue Share (%), by Application 2025 & 2033
- Figure 14: Europe Wall Covering Industry Revenue (Million), by Distribution Channel 2025 & 2033
- Figure 15: Europe Wall Covering Industry Revenue Share (%), by Distribution Channel 2025 & 2033
- Figure 16: Europe Wall Covering Industry Revenue (Million), by Country 2025 & 2033
- Figure 17: Europe Wall Covering Industry Revenue Share (%), by Country 2025 & 2033
- Figure 18: Asia Pacific Wall Covering Industry Revenue (Million), by Product Type 2025 & 2033
- Figure 19: Asia Pacific Wall Covering Industry Revenue Share (%), by Product Type 2025 & 2033
- Figure 20: Asia Pacific Wall Covering Industry Revenue (Million), by Application 2025 & 2033
- Figure 21: Asia Pacific Wall Covering Industry Revenue Share (%), by Application 2025 & 2033
- Figure 22: Asia Pacific Wall Covering Industry Revenue (Million), by Distribution Channel 2025 & 2033
- Figure 23: Asia Pacific Wall Covering Industry Revenue Share (%), by Distribution Channel 2025 & 2033
- Figure 24: Asia Pacific Wall Covering Industry Revenue (Million), by Country 2025 & 2033
- Figure 25: Asia Pacific Wall Covering Industry Revenue Share (%), by Country 2025 & 2033
- Figure 26: Australia and New Zealand Wall Covering Industry Revenue (Million), by Product Type 2025 & 2033
- Figure 27: Australia and New Zealand Wall Covering Industry Revenue Share (%), by Product Type 2025 & 2033
- Figure 28: Australia and New Zealand Wall Covering Industry Revenue (Million), by Application 2025 & 2033
- Figure 29: Australia and New Zealand Wall Covering Industry Revenue Share (%), by Application 2025 & 2033
- Figure 30: Australia and New Zealand Wall Covering Industry Revenue (Million), by Distribution Channel 2025 & 2033
- Figure 31: Australia and New Zealand Wall Covering Industry Revenue Share (%), by Distribution Channel 2025 & 2033
- Figure 32: Australia and New Zealand Wall Covering Industry Revenue (Million), by Country 2025 & 2033
- Figure 33: Australia and New Zealand Wall Covering Industry Revenue Share (%), by Country 2025 & 2033
- Figure 34: Latin America Wall Covering Industry Revenue (Million), by Product Type 2025 & 2033
- Figure 35: Latin America Wall Covering Industry Revenue Share (%), by Product Type 2025 & 2033
- Figure 36: Latin America Wall Covering Industry Revenue (Million), by Application 2025 & 2033
- Figure 37: Latin America Wall Covering Industry Revenue Share (%), by Application 2025 & 2033
- Figure 38: Latin America Wall Covering Industry Revenue (Million), by Distribution Channel 2025 & 2033
- Figure 39: Latin America Wall Covering Industry Revenue Share (%), by Distribution Channel 2025 & 2033
- Figure 40: Latin America Wall Covering Industry Revenue (Million), by Country 2025 & 2033
- Figure 41: Latin America Wall Covering Industry Revenue Share (%), by Country 2025 & 2033
- Figure 42: Middle East and Africa Wall Covering Industry Revenue (Million), by Product Type 2025 & 2033
- Figure 43: Middle East and Africa Wall Covering Industry Revenue Share (%), by Product Type 2025 & 2033
- Figure 44: Middle East and Africa Wall Covering Industry Revenue (Million), by Application 2025 & 2033
- Figure 45: Middle East and Africa Wall Covering Industry Revenue Share (%), by Application 2025 & 2033
- Figure 46: Middle East and Africa Wall Covering Industry Revenue (Million), by Distribution Channel 2025 & 2033
- Figure 47: Middle East and Africa Wall Covering Industry Revenue Share (%), by Distribution Channel 2025 & 2033
- Figure 48: Middle East and Africa Wall Covering Industry Revenue (Million), by Country 2025 & 2033
- Figure 49: Middle East and Africa Wall Covering Industry Revenue Share (%), by Country 2025 & 2033
List of Tables
- Table 1: Global Wall Covering Industry Revenue Million Forecast, by Product Type 2020 & 2033
- Table 2: Global Wall Covering Industry Revenue Million Forecast, by Application 2020 & 2033
- Table 3: Global Wall Covering Industry Revenue Million Forecast, by Distribution Channel 2020 & 2033
- Table 4: Global Wall Covering Industry Revenue Million Forecast, by Region 2020 & 2033
- Table 5: Global Wall Covering Industry Revenue Million Forecast, by Product Type 2020 & 2033
- Table 6: Global Wall Covering Industry Revenue Million Forecast, by Application 2020 & 2033
- Table 7: Global Wall Covering Industry Revenue Million Forecast, by Distribution Channel 2020 & 2033
- Table 8: Global Wall Covering Industry Revenue Million Forecast, by Country 2020 & 2033
- Table 9: United States Wall Covering Industry Revenue (Million) Forecast, by Application 2020 & 2033
- Table 10: Canada Wall Covering Industry Revenue (Million) Forecast, by Application 2020 & 2033
- Table 11: Global Wall Covering Industry Revenue Million Forecast, by Product Type 2020 & 2033
- Table 12: Global Wall Covering Industry Revenue Million Forecast, by Application 2020 & 2033
- Table 13: Global Wall Covering Industry Revenue Million Forecast, by Distribution Channel 2020 & 2033
- Table 14: Global Wall Covering Industry Revenue Million Forecast, by Country 2020 & 2033
- Table 15: United Kingdom Wall Covering Industry Revenue (Million) Forecast, by Application 2020 & 2033
- Table 16: Germany Wall Covering Industry Revenue (Million) Forecast, by Application 2020 & 2033
- Table 17: France Wall Covering Industry Revenue (Million) Forecast, by Application 2020 & 2033
- Table 18: Spain Wall Covering Industry Revenue (Million) Forecast, by Application 2020 & 2033
- Table 19: Italy Wall Covering Industry Revenue (Million) Forecast, by Application 2020 & 2033
- Table 20: Global Wall Covering Industry Revenue Million Forecast, by Product Type 2020 & 2033
- Table 21: Global Wall Covering Industry Revenue Million Forecast, by Application 2020 & 2033
- Table 22: Global Wall Covering Industry Revenue Million Forecast, by Distribution Channel 2020 & 2033
- Table 23: Global Wall Covering Industry Revenue Million Forecast, by Country 2020 & 2033
- Table 24: China Wall Covering Industry Revenue (Million) Forecast, by Application 2020 & 2033
- Table 25: India Wall Covering Industry Revenue (Million) Forecast, by Application 2020 & 2033
- Table 26: Japan Wall Covering Industry Revenue (Million) Forecast, by Application 2020 & 2033
- Table 27: Global Wall Covering Industry Revenue Million Forecast, by Product Type 2020 & 2033
- Table 28: Global Wall Covering Industry Revenue Million Forecast, by Application 2020 & 2033
- Table 29: Global Wall Covering Industry Revenue Million Forecast, by Distribution Channel 2020 & 2033
- Table 30: Global Wall Covering Industry Revenue Million Forecast, by Country 2020 & 2033
- Table 31: Global Wall Covering Industry Revenue Million Forecast, by Product Type 2020 & 2033
- Table 32: Global Wall Covering Industry Revenue Million Forecast, by Application 2020 & 2033
- Table 33: Global Wall Covering Industry Revenue Million Forecast, by Distribution Channel 2020 & 2033
- Table 34: Global Wall Covering Industry Revenue Million Forecast, by Country 2020 & 2033
- Table 35: Brazil Wall Covering Industry Revenue (Million) Forecast, by Application 2020 & 2033
- Table 36: Mexico Wall Covering Industry Revenue (Million) Forecast, by Application 2020 & 2033
- Table 37: Argentina Wall Covering Industry Revenue (Million) Forecast, by Application 2020 & 2033
- Table 38: Global Wall Covering Industry Revenue Million Forecast, by Product Type 2020 & 2033
- Table 39: Global Wall Covering Industry Revenue Million Forecast, by Application 2020 & 2033
- Table 40: Global Wall Covering Industry Revenue Million Forecast, by Distribution Channel 2020 & 2033
- Table 41: Global Wall Covering Industry Revenue Million Forecast, by Country 2020 & 2033
- Table 42: Saudi Arabia Wall Covering Industry Revenue (Million) Forecast, by Application 2020 & 2033
- Table 43: United Arab Emirates Wall Covering Industry Revenue (Million) Forecast, by Application 2020 & 2033
- Table 44: South Africa Wall Covering Industry Revenue (Million) Forecast, by Application 2020 & 2033
Frequently Asked Questions
1. What is the projected Compound Annual Growth Rate (CAGR) of the Wall Covering Industry?
The projected CAGR is approximately 4.47%.
2. Which companies are prominent players in the Wall Covering Industry?
Key companies in the market include Brewster Home Fashion, Ahlstrom-Munksjö Oyj, Adfors (Saint Gobain), A S Création Tapeten AG, Walker Greenbank PLC, Grandeco Wallfashion Group, Benjamin Moore & Co, J Josephson Inc, Asian Paints Ltd, York Wallcoverings Inc.
3. What are the main segments of the Wall Covering Industry?
The market segments include Product Type, Application, Distribution Channel.
4. Can you provide details about the market size?
The market size is estimated to be USD 39.63 Million as of 2022.
5. What are some drivers contributing to market growth?
Increasing Number of Residential Buildings; Availability of Styled Products; Increase in Do-it-yourself (DIY) Trends.
6. What are the notable trends driving market growth?
Wall Panel Segment is Expected Hold Significant Market Share.
7. Are there any restraints impacting market growth?
Limiting Availability and High Cost of Raw Materials.
8. Can you provide examples of recent developments in the market?
May 2023: Asian Paints announced the launch of the homes studio in Chennai and the 2023 collection for home decor. The studio offers a garden selection of fabrics, wallpapers, bedding, and rugs.
9. What pricing options are available for accessing the report?
Pricing options include single-user, multi-user, and enterprise licenses priced at USD 4750, USD 5250, and USD 8750 respectively.
10. Is the market size provided in terms of value or volume?
The market size is provided in terms of value, measured in Million.
11. Are there any specific market keywords associated with the report?
Yes, the market keyword associated with the report is "Wall Covering Industry," which aids in identifying and referencing the specific market segment covered.
12. How do I determine which pricing option suits my needs best?
The pricing options vary based on user requirements and access needs. Individual users may opt for single-user licenses, while businesses requiring broader access may choose multi-user or enterprise licenses for cost-effective access to the report.
13. Are there any additional resources or data provided in the Wall Covering Industry report?
While the report offers comprehensive insights, it's advisable to review the specific contents or supplementary materials provided to ascertain if additional resources or data are available.
14. How can I stay updated on further developments or reports in the Wall Covering Industry?
To stay informed about further developments, trends, and reports in the Wall Covering Industry, consider subscribing to industry newsletters, following relevant companies and organizations, or regularly checking reputable industry news sources and publications.
Methodology
Step 1 - Identification of Relevant Samples Size from Population Database


Step 2 - Approaches for Defining Global Market Size (Value, Volume* & Price*)

Note*: In applicable scenarios
Step 3 - Data Sources
Primary Research
- Web Analytics
- Survey Reports
- Research Institute
- Latest Research Reports
- Opinion Leaders
Secondary Research
- Annual Reports
- White Paper
- Latest Press Release
- Industry Association
- Paid Database
- Investor Presentations

Step 4 - Data Triangulation
Involves using different sources of information in order to increase the validity of a study
These sources are likely to be stakeholders in a program - participants, other researchers, program staff, other community members, and so on.
Then we put all data in single framework & apply various statistical tools to find out the dynamic on the market.
During the analysis stage, feedback from the stakeholder groups would be compared to determine areas of agreement as well as areas of divergence