

Key Insights
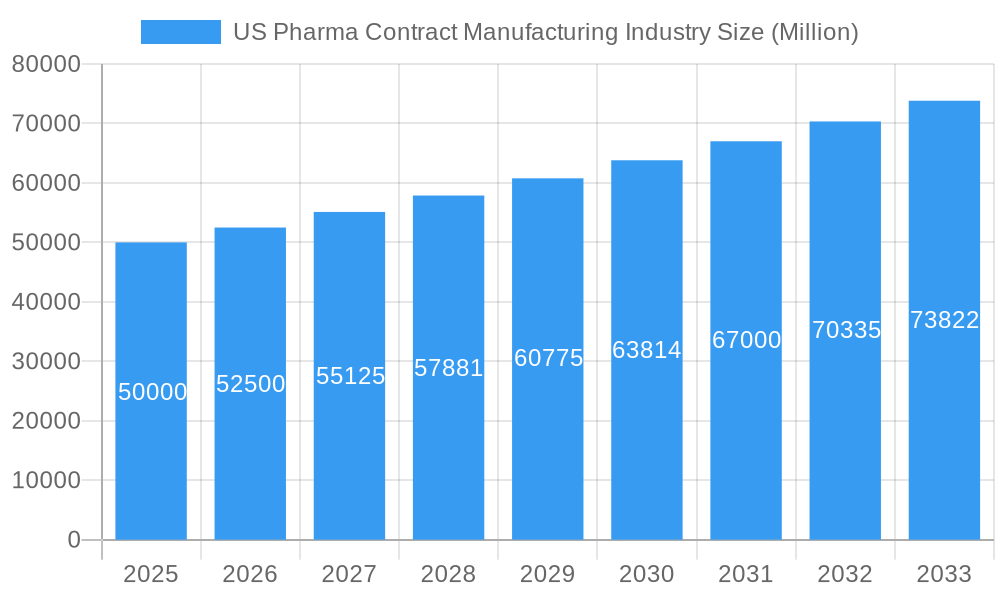
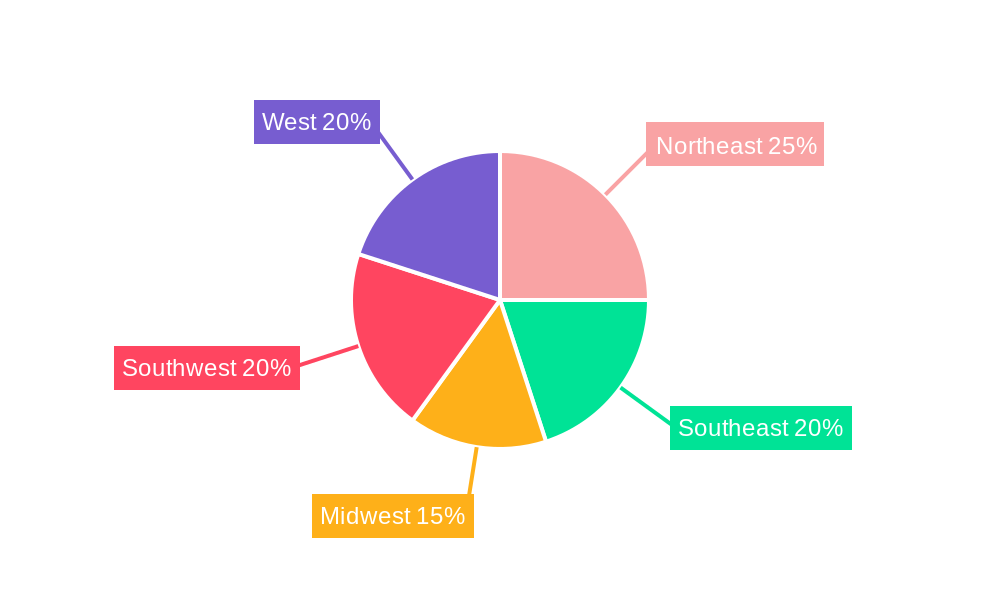
The US pharma contract manufacturing market, valued at approximately $XX million in 2025, is projected to experience robust growth, fueled by a 5% CAGR from 2025 to 2033. This expansion is driven by several key factors. The increasing complexity of drug development, coupled with rising R&D costs, incentivizes pharmaceutical companies to outsource manufacturing processes to specialized contract manufacturers. This allows them to focus on core competencies like research and development and commercialization while leveraging the expertise and economies of scale offered by contract manufacturers. The growing demand for biologics and advanced therapies, such as cell and gene therapies, further contributes to market growth. These therapies often require sophisticated manufacturing capabilities, which contract manufacturers are well-equipped to provide. Furthermore, the increasing prevalence of chronic diseases in the US necessitates a larger volume of pharmaceutical products, leading to higher demand for contract manufacturing services. The market is segmented by service type, including API manufacturing (Active Pharmaceutical Ingredient), high-potency API (HPAPI) and finished dosage formulation (FDF) development and manufacturing, and injectable dose formulation and secondary packaging. Key players such as Thermo Fisher Scientific (Patheon), Siegfried AG, Aenova Group, Lonza, Pfizer CentreSource, Jubilant Life Sciences, Catalent, AbbVie Contract Manufacturing, Boehringer Ingelheim, Recipharm, and Baxter Biopharma Solutions are actively competing within this dynamic landscape. The regional distribution across the United States (Northeast, Southeast, Midwest, Southwest, and West) reflects existing pharmaceutical hubs and infrastructure.
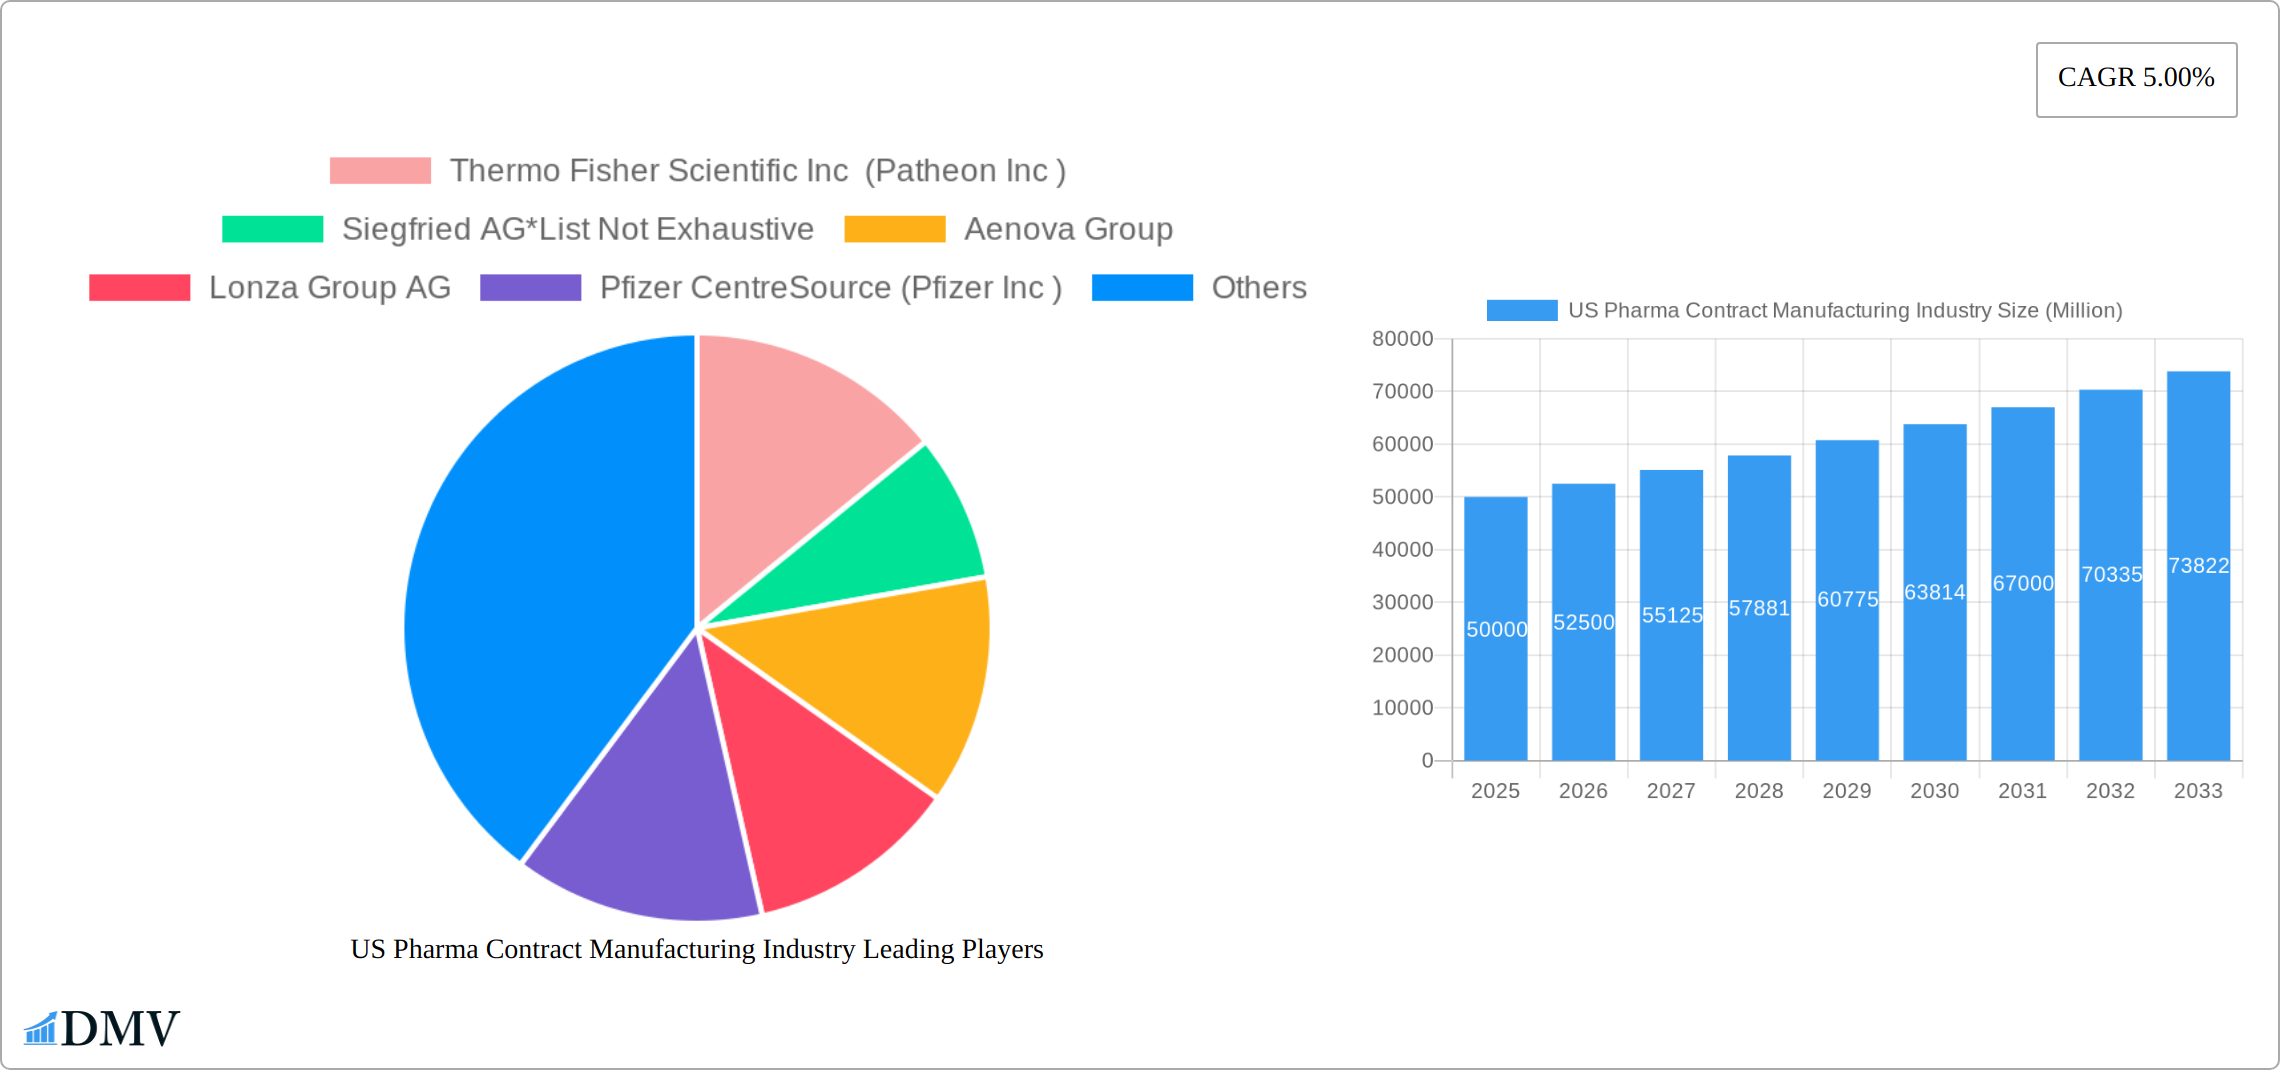
US Pharma Contract Manufacturing Industry Market Size (In Billion)
The competitive landscape is characterized by a mix of large multinational corporations and specialized niche players. The market is witnessing ongoing consolidation through mergers and acquisitions, as companies strive to expand their service offerings and geographic reach. This consolidation trend is expected to continue, shaping the competitive dynamics in the coming years. While regulatory hurdles and potential supply chain disruptions pose challenges, the overall market outlook remains positive, driven by the fundamental factors mentioned above. The strong growth trajectory is expected to continue through 2033, attracting further investment and innovation in the US pharma contract manufacturing sector. This will lead to advancements in technology and efficiency, further improving the capabilities of contract manufacturers to meet the evolving demands of the pharmaceutical industry.
US Pharma Contract Manufacturing Industry Company Market Share
US Pharma Contract Manufacturing Industry: Market Report 2019-2033
This comprehensive report provides an in-depth analysis of the US Pharma Contract Manufacturing industry, offering invaluable insights for stakeholders seeking to navigate this dynamic market. The report covers the period from 2019 to 2033, with a base year of 2025 and a forecast period from 2025 to 2033. It meticulously examines market trends, leading players, technological advancements, and future opportunities, equipping readers with the knowledge necessary to make informed strategic decisions. The total market size in 2025 is estimated at $XX Million.
US Pharma Contract Manufacturing Industry Market Composition & Trends
This section analyzes the competitive landscape, innovation drivers, regulatory environment, and market dynamics of the US Pharma Contract Manufacturing industry. The market is characterized by a moderate level of concentration, with key players such as Thermo Fisher Scientific Inc (Patheon Inc), Siegfried AG, Aenova Group, Lonza Group AG, and Catalent Inc holding significant market share. However, the presence of numerous smaller players fosters competition. Innovation is driven by the need for efficient and cost-effective manufacturing processes, particularly in areas like High Potency API (HPAPI) manufacturing and advanced drug delivery systems. Stringent regulatory requirements from the FDA shape industry practices and necessitate significant investments in compliance. Substitute products are limited, given the specialized nature of pharmaceutical manufacturing. The end-user profile primarily includes pharmaceutical companies, ranging from large multinational corporations to smaller specialty firms. M&A activity has been robust in recent years, with several significant deals exceeding $XX Million.
- Market Share Distribution (2025): Thermo Fisher Scientific Inc (Patheon Inc): XX%; Catalent Inc: XX%; Lonza Group AG: XX%; Others: XX%.
- Top 3 M&A Deals (2019-2024): Deal 1: $XX Million; Deal 2: $XX Million; Deal 3: $XX Million.
US Pharma Contract Manufacturing Industry Industry Evolution
The US Pharma Contract Manufacturing (CMO) industry has witnessed an impressive trajectory of growth and sophistication over the past decade. This expansion is fundamentally driven by the strategic decision of pharmaceutical and biotechnology companies to outsource critical manufacturing processes, allowing them to focus on core competencies like research and development. A significant catalyst for this growth has been the escalating demand for highly specialized manufacturing capabilities, notably for High-Potency Active Pharmaceutical Ingredients (HPAPI) and complex sterile injectables. Technological advancements have also played a pivotal role, reshaping operational efficiencies and production methodologies. The market is poised for continued robust expansion, with projections indicating a Compound Annual Growth Rate (CAGR) of approximately XX% from 2025 to 2033. This sustained growth is further underpinned by the increasing complexity inherent in modern drug development, the surge in biologics and specialty pharmaceuticals, and the widespread adoption of cutting-edge technologies like automation and advanced analytics. Innovations such as continuous manufacturing, which offers enhanced efficiency and cost reduction, and sophisticated Process Analytical Technologies (PAT) are revolutionizing production. Moreover, evolving consumer demands for personalized medicine and novel drug delivery systems are creating new avenues for market expansion. The adoption of continuous manufacturing, a key indicator of technological advancement, has seen a notable increase, rising from an estimated XX% in 2019 to XX% in 2024, with expectations to reach XX% by 2033.
Leading Regions, Countries, or Segments in US Pharma Contract Manufacturing Industry
The Northeast and Southeast regions of the United States dominate the Pharma Contract Manufacturing market, driven by the concentration of pharmaceutical companies and robust regulatory infrastructure. Within the service types, Finished Dosage Formulation (FDF) Development and Manufacturing holds the largest market share, followed by Active Pharmaceutical Ingredient (API) Manufacturing and Injectable Dose Formulation.
- Key Drivers for FDF dominance:
- High demand for diverse dosage forms.
- Significant investment in advanced FDF technologies.
- Strong regulatory support for innovation in drug delivery systems.
- Key Drivers for API dominance:
- Growing demand for complex APIs.
- Increased outsourcing of API manufacturing by pharmaceutical companies.
- Technological advancements in API synthesis and purification.
- Key Drivers for Injectable Formulation dominance:
- Rising prevalence of injectable drugs and biologics.
- Investments in sterile manufacturing facilities and technologies.
- Stringent regulatory compliance for injectable products.
The dominance of these regions and segments is attributable to several factors including established infrastructure, skilled workforce, favorable regulatory environment, and proximity to key pharmaceutical clients.
US Pharma Contract Manufacturing Industry Product Innovations
Recent advancements within the US Pharma Contract Manufacturing sector are singularly focused on elevating operational efficiency, driving down costs, and ensuring the highest standards of product quality. A cornerstone of these innovations is the accelerated development and implementation of continuous manufacturing processes, which significantly improve throughput and consistency. Complementing this are advancements in single-use technologies, offering greater flexibility, reduced contamination risks, and faster changeovers between product campaigns. The integration of advanced analytics and artificial intelligence (AI) is enabling real-time process monitoring and predictive maintenance, leading to enhanced product consistency and a marked reduction in deviations and potential contamination. These integrated innovations contribute to a superior level of product quality and a tangible increase in operational efficiency. The unique selling propositions emerging from these advancements include demonstrably faster turnaround times for product manufacturing, consistently improved product quality, and substantial reductions in overall manufacturing costs. Consequently, pharmaceutical companies are increasingly recognizing and leveraging these benefits, leading to higher adoption rates of contract manufacturing services.
Propelling Factors for US Pharma Contract Manufacturing Industry Growth
The vigorous growth of the US Pharma Contract Manufacturing industry is propelled by a confluence of strategic and technological drivers. Foremost among these are the transformative technological advancements, encompassing the widespread adoption of automation, robotics, and digitalization, which collectively enhance manufacturing efficiency and significantly reduce production costs. Supportive favorable economic conditions, including robust investment cycles and increased capital allocation towards the pharmaceutical sector, further fuel expansion. Moreover, the industry benefits from substantial and sustained investment in Research and Development (R&D) by pharmaceutical innovators, creating a constant pipeline of new drugs requiring manufacturing support. While the stringent regulatory environment in the US presents its own set of challenges, it also serves as a powerful catalyst for innovation. Adherence to these rigorous standards drives the development of sophisticated manufacturing processes and ensures the highest levels of product quality and safety, thereby bolstering market confidence and fostering long-term partnerships.
Obstacles in the US Pharma Contract Manufacturing Industry Market
Despite its robust growth, the US Pharma Contract Manufacturing industry navigates several significant obstacles that warrant strategic attention. The inherently stringent regulatory requirements, while essential for patient safety, invariably increase operational costs and introduce complex compliance demands. Furthermore, the industry remains susceptible to supply chain disruptions, particularly concerning the secure and timely sourcing of critical raw materials, specialized active pharmaceutical ingredients (APIs), and sophisticated manufacturing equipment. These vulnerabilities can have a material impact on production timelines and costs. The market is also characterized by intense competition among a growing number of CMOs, leading to significant pricing pressures as companies vie for contracts. Effectively managing these interconnected challenges is paramount for sustained growth. Failure to adequately address these obstacles could indeed impede the industry's expansion trajectory, potentially impacting the projected market CAGR by an estimated XX% in the forecast period.
Future Opportunities in US Pharma Contract Manufacturing Industry
Emerging opportunities lie in the growth of personalized medicine, cell and gene therapies, and advanced drug delivery systems. The adoption of innovative manufacturing technologies, such as continuous manufacturing and 3D printing, will unlock further opportunities. Expanding into new therapeutic areas and geographic markets will also drive future growth.
Major Players in the US Pharma Contract Manufacturing Industry Ecosystem
- Thermo Fisher Scientific Inc (Patheon Inc)
- Siegfried AG
- Aenova Group
- Lonza Group AG
- Pfizer CentreSource (Pfizer Inc)
- Jubilant Life Sciences Ltd
- Catalent Inc
- AbbVie Contract Manufacturing
- Boehringer Ingelheim Group
- Recipharm AB
- Baxter Biopharma Solutions (Baxter International Inc)
Key Developments in US Pharma Contract Manufacturing Industry Industry
- 2022 Q4: Catalent Inc. announced a substantial expansion of its sterile fill-finish capabilities, reinforcing its position in the high-demand injectables market.
- 2023 Q1: Lonza Group AG made a significant strategic investment of $XX Million to establish a state-of-the-art High-Potency Active Pharmaceutical Ingredient (HPAPI) manufacturing facility, addressing a critical niche in the market.
- 2023 Q2: Thermo Fisher Scientific (through its Patheon brand) strategically acquired a specialized, smaller contract manufacturer with expertise in sterile injectable drug product development and manufacturing, broadening its service portfolio.
- 2023 Q3: Recipharm AB announced a new partnership with a leading biotech firm to scale up the production of a novel biologic therapeutic, highlighting the growing demand for advanced biologics manufacturing.
- 2024 Q1: FUJIFILM Diosynth Biotechnologies unveiled plans for a major expansion of its mRNA manufacturing capacity, reflecting the continued importance of this platform in vaccine and therapeutic development.
Strategic US Pharma Contract Manufacturing Industry Market Forecast
The US Pharma Contract Manufacturing industry is poised for continued growth, driven by sustained demand for pharmaceutical products, advancements in manufacturing technologies, and the outsourcing trend within the pharmaceutical industry. The market’s future trajectory will be shaped by regulatory changes, technological breakthroughs, and strategic partnerships. The projected CAGR of XX% indicates a significant market expansion, presenting lucrative opportunities for both established players and new entrants.
US Pharma Contract Manufacturing Industry Segmentation
-
1. Service Type
-
1.1. Active P
- 1.1.1. Small Molecule
- 1.1.2. Large Molecule
- 1.1.3. High Potency API (HPAPI)
-
1.2. Finished
- 1.2.1. Solid Dose Formulation
- 1.2.2. Liquid Dose Formulation
- 1.2.3. Injectable Dose Formulation
- 1.3. Secondary Packaging
-
1.1. Active P
US Pharma Contract Manufacturing Industry Segmentation By Geography
-
1. North America
- 1.1. United States
- 1.2. Canada
- 1.3. Mexico
-
2. South America
- 2.1. Brazil
- 2.2. Argentina
- 2.3. Rest of South America
-
3. Europe
- 3.1. United Kingdom
- 3.2. Germany
- 3.3. France
- 3.4. Italy
- 3.5. Spain
- 3.6. Russia
- 3.7. Benelux
- 3.8. Nordics
- 3.9. Rest of Europe
-
4. Middle East & Africa
- 4.1. Turkey
- 4.2. Israel
- 4.3. GCC
- 4.4. North Africa
- 4.5. South Africa
- 4.6. Rest of Middle East & Africa
-
5. Asia Pacific
- 5.1. China
- 5.2. India
- 5.3. Japan
- 5.4. South Korea
- 5.5. ASEAN
- 5.6. Oceania
- 5.7. Rest of Asia Pacific
US Pharma Contract Manufacturing Industry Regional Market Share
Geographic Coverage of US Pharma Contract Manufacturing Industry
US Pharma Contract Manufacturing Industry REPORT HIGHLIGHTS
| Aspects | Details |
|---|---|
| Study Period | 2020-2034 |
| Base Year | 2025 |
| Estimated Year | 2026 |
| Forecast Period | 2026-2034 |
| Historical Period | 2020-2025 |
| Growth Rate | CAGR of 5.00% from 2020-2034 |
| Segmentation |
|
Table of Contents
- 1. Introduction
- 1.1. Research Scope
- 1.2. Market Segmentation
- 1.3. Research Objective
- 1.4. Definitions and Assumptions
- 2. Executive Summary
- 2.1. Market Snapshot
- 3. Market Dynamics
- 3.1. Market Drivers
- 3.2. Market Restrains
- 3.3. Market Trends
- 3.4. Market Opportunities
- 4. Market Factor Analysis
- 4.1. Porters Five Forces
- 4.1.1. Bargaining Power of Suppliers
- 4.1.2. Bargaining Power of Buyers
- 4.1.3. Threat of New Entrants
- 4.1.4. Threat of Substitutes
- 4.1.5. Competitive Rivalry
- 4.2. PESTEL analysis
- 4.3. BCG Analysis
- 4.3.1. Stars (High Growth, High Market Share)
- 4.3.2. Cash Cows (Low Growth, High Market Share)
- 4.3.3. Question Mark (High Growth, Low Market Share)
- 4.3.4. Dogs (Low Growth, Low Market Share)
- 4.4. Ansoff Matrix Analysis
- 4.5. Supply Chain Analysis
- 4.6. Regulatory Landscape
- 4.7. Current Market Potential and Opportunity Assessment (TAM–SAM–SOM Framework)
- 4.8. DMV Analyst Note
- 4.1. Porters Five Forces
- 5. Market Analysis, Insights and Forecast 2021-2033
- 5.1. Market Analysis, Insights and Forecast - by Service Type
- 5.1.1. Active P
- 5.1.1.1. Small Molecule
- 5.1.1.2. Large Molecule
- 5.1.1.3. High Potency API (HPAPI)
- 5.1.2. Finished
- 5.1.2.1. Solid Dose Formulation
- 5.1.2.2. Liquid Dose Formulation
- 5.1.2.3. Injectable Dose Formulation
- 5.1.3. Secondary Packaging
- 5.1.1. Active P
- 5.2. Market Analysis, Insights and Forecast - by Region
- 5.2.1. North America
- 5.2.2. South America
- 5.2.3. Europe
- 5.2.4. Middle East & Africa
- 5.2.5. Asia Pacific
- 5.1. Market Analysis, Insights and Forecast - by Service Type
- 6. Global US Pharma Contract Manufacturing Industry Analysis, Insights and Forecast, 2021-2033
- 6.1. Market Analysis, Insights and Forecast - by Service Type
- 6.1.1. Active P
- 6.1.1.1. Small Molecule
- 6.1.1.2. Large Molecule
- 6.1.1.3. High Potency API (HPAPI)
- 6.1.2. Finished
- 6.1.2.1. Solid Dose Formulation
- 6.1.2.2. Liquid Dose Formulation
- 6.1.2.3. Injectable Dose Formulation
- 6.1.3. Secondary Packaging
- 6.1.1. Active P
- 6.1. Market Analysis, Insights and Forecast - by Service Type
- 7. North America US Pharma Contract Manufacturing Industry Analysis, Insights and Forecast, 2020-2032
- 7.1. Market Analysis, Insights and Forecast - by Service Type
- 7.1.1. Active P
- 7.1.1.1. Small Molecule
- 7.1.1.2. Large Molecule
- 7.1.1.3. High Potency API (HPAPI)
- 7.1.2. Finished
- 7.1.2.1. Solid Dose Formulation
- 7.1.2.2. Liquid Dose Formulation
- 7.1.2.3. Injectable Dose Formulation
- 7.1.3. Secondary Packaging
- 7.1.1. Active P
- 7.1. Market Analysis, Insights and Forecast - by Service Type
- 8. South America US Pharma Contract Manufacturing Industry Analysis, Insights and Forecast, 2020-2032
- 8.1. Market Analysis, Insights and Forecast - by Service Type
- 8.1.1. Active P
- 8.1.1.1. Small Molecule
- 8.1.1.2. Large Molecule
- 8.1.1.3. High Potency API (HPAPI)
- 8.1.2. Finished
- 8.1.2.1. Solid Dose Formulation
- 8.1.2.2. Liquid Dose Formulation
- 8.1.2.3. Injectable Dose Formulation
- 8.1.3. Secondary Packaging
- 8.1.1. Active P
- 8.1. Market Analysis, Insights and Forecast - by Service Type
- 9. Europe US Pharma Contract Manufacturing Industry Analysis, Insights and Forecast, 2020-2032
- 9.1. Market Analysis, Insights and Forecast - by Service Type
- 9.1.1. Active P
- 9.1.1.1. Small Molecule
- 9.1.1.2. Large Molecule
- 9.1.1.3. High Potency API (HPAPI)
- 9.1.2. Finished
- 9.1.2.1. Solid Dose Formulation
- 9.1.2.2. Liquid Dose Formulation
- 9.1.2.3. Injectable Dose Formulation
- 9.1.3. Secondary Packaging
- 9.1.1. Active P
- 9.1. Market Analysis, Insights and Forecast - by Service Type
- 10. Middle East & Africa US Pharma Contract Manufacturing Industry Analysis, Insights and Forecast, 2020-2032
- 10.1. Market Analysis, Insights and Forecast - by Service Type
- 10.1.1. Active P
- 10.1.1.1. Small Molecule
- 10.1.1.2. Large Molecule
- 10.1.1.3. High Potency API (HPAPI)
- 10.1.2. Finished
- 10.1.2.1. Solid Dose Formulation
- 10.1.2.2. Liquid Dose Formulation
- 10.1.2.3. Injectable Dose Formulation
- 10.1.3. Secondary Packaging
- 10.1.1. Active P
- 10.1. Market Analysis, Insights and Forecast - by Service Type
- 11. Asia Pacific US Pharma Contract Manufacturing Industry Analysis, Insights and Forecast, 2020-2032
- 11.1. Market Analysis, Insights and Forecast - by Service Type
- 11.1.1. Active P
- 11.1.1.1. Small Molecule
- 11.1.1.2. Large Molecule
- 11.1.1.3. High Potency API (HPAPI)
- 11.1.2. Finished
- 11.1.2.1. Solid Dose Formulation
- 11.1.2.2. Liquid Dose Formulation
- 11.1.2.3. Injectable Dose Formulation
- 11.1.3. Secondary Packaging
- 11.1.1. Active P
- 11.1. Market Analysis, Insights and Forecast - by Service Type
- 12. Competitive Analysis
- 12.1. Company Profiles
- 12.1.1 Thermo Fisher Scientific Inc (Patheon Inc )
- 12.1.1.1. Company Overview
- 12.1.1.2. Products
- 12.1.1.3. Company Financials
- 12.1.1.4. SWOT Analysis
- 12.1.2 Siegfried AG*List Not Exhaustive
- 12.1.2.1. Company Overview
- 12.1.2.2. Products
- 12.1.2.3. Company Financials
- 12.1.2.4. SWOT Analysis
- 12.1.3 Aenova Group
- 12.1.3.1. Company Overview
- 12.1.3.2. Products
- 12.1.3.3. Company Financials
- 12.1.3.4. SWOT Analysis
- 12.1.4 Lonza Group AG
- 12.1.4.1. Company Overview
- 12.1.4.2. Products
- 12.1.4.3. Company Financials
- 12.1.4.4. SWOT Analysis
- 12.1.5 Pfizer CentreSource (Pfizer Inc )
- 12.1.5.1. Company Overview
- 12.1.5.2. Products
- 12.1.5.3. Company Financials
- 12.1.5.4. SWOT Analysis
- 12.1.6 Jubilant Life Sciences Ltd
- 12.1.6.1. Company Overview
- 12.1.6.2. Products
- 12.1.6.3. Company Financials
- 12.1.6.4. SWOT Analysis
- 12.1.7 Catalent Inc
- 12.1.7.1. Company Overview
- 12.1.7.2. Products
- 12.1.7.3. Company Financials
- 12.1.7.4. SWOT Analysis
- 12.1.8 AbbVie Contract Manufacturing
- 12.1.8.1. Company Overview
- 12.1.8.2. Products
- 12.1.8.3. Company Financials
- 12.1.8.4. SWOT Analysis
- 12.1.9 Boehringer Ingelheim Group
- 12.1.9.1. Company Overview
- 12.1.9.2. Products
- 12.1.9.3. Company Financials
- 12.1.9.4. SWOT Analysis
- 12.1.10 Recipharm AB
- 12.1.10.1. Company Overview
- 12.1.10.2. Products
- 12.1.10.3. Company Financials
- 12.1.10.4. SWOT Analysis
- 12.1.11 Baxter Biopharma Solutions (Baxter International Inc )
- 12.1.11.1. Company Overview
- 12.1.11.2. Products
- 12.1.11.3. Company Financials
- 12.1.11.4. SWOT Analysis
- 12.1.1 Thermo Fisher Scientific Inc (Patheon Inc )
- 12.2. Market Entropy
- 12.2.1 Company's Key Areas Served
- 12.2.2 Recent Developments
- 12.3. Company Market Share Analysis 2025
- 12.3.1 Top 5 Companies Market Share Analysis
- 12.3.2 Top 3 Companies Market Share Analysis
- 12.4. List of Potential Customers
- 13. Research Methodology
List of Figures
- Figure 1: Global US Pharma Contract Manufacturing Industry Revenue Breakdown (Million, %) by Region 2025 & 2033
- Figure 2: North America US Pharma Contract Manufacturing Industry Revenue (Million), by Service Type 2025 & 2033
- Figure 3: North America US Pharma Contract Manufacturing Industry Revenue Share (%), by Service Type 2025 & 2033
- Figure 4: North America US Pharma Contract Manufacturing Industry Revenue (Million), by Country 2025 & 2033
- Figure 5: North America US Pharma Contract Manufacturing Industry Revenue Share (%), by Country 2025 & 2033
- Figure 6: South America US Pharma Contract Manufacturing Industry Revenue (Million), by Service Type 2025 & 2033
- Figure 7: South America US Pharma Contract Manufacturing Industry Revenue Share (%), by Service Type 2025 & 2033
- Figure 8: South America US Pharma Contract Manufacturing Industry Revenue (Million), by Country 2025 & 2033
- Figure 9: South America US Pharma Contract Manufacturing Industry Revenue Share (%), by Country 2025 & 2033
- Figure 10: Europe US Pharma Contract Manufacturing Industry Revenue (Million), by Service Type 2025 & 2033
- Figure 11: Europe US Pharma Contract Manufacturing Industry Revenue Share (%), by Service Type 2025 & 2033
- Figure 12: Europe US Pharma Contract Manufacturing Industry Revenue (Million), by Country 2025 & 2033
- Figure 13: Europe US Pharma Contract Manufacturing Industry Revenue Share (%), by Country 2025 & 2033
- Figure 14: Middle East & Africa US Pharma Contract Manufacturing Industry Revenue (Million), by Service Type 2025 & 2033
- Figure 15: Middle East & Africa US Pharma Contract Manufacturing Industry Revenue Share (%), by Service Type 2025 & 2033
- Figure 16: Middle East & Africa US Pharma Contract Manufacturing Industry Revenue (Million), by Country 2025 & 2033
- Figure 17: Middle East & Africa US Pharma Contract Manufacturing Industry Revenue Share (%), by Country 2025 & 2033
- Figure 18: Asia Pacific US Pharma Contract Manufacturing Industry Revenue (Million), by Service Type 2025 & 2033
- Figure 19: Asia Pacific US Pharma Contract Manufacturing Industry Revenue Share (%), by Service Type 2025 & 2033
- Figure 20: Asia Pacific US Pharma Contract Manufacturing Industry Revenue (Million), by Country 2025 & 2033
- Figure 21: Asia Pacific US Pharma Contract Manufacturing Industry Revenue Share (%), by Country 2025 & 2033
List of Tables
- Table 1: Global US Pharma Contract Manufacturing Industry Revenue Million Forecast, by Service Type 2020 & 2033
- Table 2: Global US Pharma Contract Manufacturing Industry Revenue Million Forecast, by Region 2020 & 2033
- Table 3: Global US Pharma Contract Manufacturing Industry Revenue Million Forecast, by Service Type 2020 & 2033
- Table 4: Global US Pharma Contract Manufacturing Industry Revenue Million Forecast, by Country 2020 & 2033
- Table 5: United States US Pharma Contract Manufacturing Industry Revenue (Million) Forecast, by Application 2020 & 2033
- Table 6: Canada US Pharma Contract Manufacturing Industry Revenue (Million) Forecast, by Application 2020 & 2033
- Table 7: Mexico US Pharma Contract Manufacturing Industry Revenue (Million) Forecast, by Application 2020 & 2033
- Table 8: Global US Pharma Contract Manufacturing Industry Revenue Million Forecast, by Service Type 2020 & 2033
- Table 9: Global US Pharma Contract Manufacturing Industry Revenue Million Forecast, by Country 2020 & 2033
- Table 10: Brazil US Pharma Contract Manufacturing Industry Revenue (Million) Forecast, by Application 2020 & 2033
- Table 11: Argentina US Pharma Contract Manufacturing Industry Revenue (Million) Forecast, by Application 2020 & 2033
- Table 12: Rest of South America US Pharma Contract Manufacturing Industry Revenue (Million) Forecast, by Application 2020 & 2033
- Table 13: Global US Pharma Contract Manufacturing Industry Revenue Million Forecast, by Service Type 2020 & 2033
- Table 14: Global US Pharma Contract Manufacturing Industry Revenue Million Forecast, by Country 2020 & 2033
- Table 15: United Kingdom US Pharma Contract Manufacturing Industry Revenue (Million) Forecast, by Application 2020 & 2033
- Table 16: Germany US Pharma Contract Manufacturing Industry Revenue (Million) Forecast, by Application 2020 & 2033
- Table 17: France US Pharma Contract Manufacturing Industry Revenue (Million) Forecast, by Application 2020 & 2033
- Table 18: Italy US Pharma Contract Manufacturing Industry Revenue (Million) Forecast, by Application 2020 & 2033
- Table 19: Spain US Pharma Contract Manufacturing Industry Revenue (Million) Forecast, by Application 2020 & 2033
- Table 20: Russia US Pharma Contract Manufacturing Industry Revenue (Million) Forecast, by Application 2020 & 2033
- Table 21: Benelux US Pharma Contract Manufacturing Industry Revenue (Million) Forecast, by Application 2020 & 2033
- Table 22: Nordics US Pharma Contract Manufacturing Industry Revenue (Million) Forecast, by Application 2020 & 2033
- Table 23: Rest of Europe US Pharma Contract Manufacturing Industry Revenue (Million) Forecast, by Application 2020 & 2033
- Table 24: Global US Pharma Contract Manufacturing Industry Revenue Million Forecast, by Service Type 2020 & 2033
- Table 25: Global US Pharma Contract Manufacturing Industry Revenue Million Forecast, by Country 2020 & 2033
- Table 26: Turkey US Pharma Contract Manufacturing Industry Revenue (Million) Forecast, by Application 2020 & 2033
- Table 27: Israel US Pharma Contract Manufacturing Industry Revenue (Million) Forecast, by Application 2020 & 2033
- Table 28: GCC US Pharma Contract Manufacturing Industry Revenue (Million) Forecast, by Application 2020 & 2033
- Table 29: North Africa US Pharma Contract Manufacturing Industry Revenue (Million) Forecast, by Application 2020 & 2033
- Table 30: South Africa US Pharma Contract Manufacturing Industry Revenue (Million) Forecast, by Application 2020 & 2033
- Table 31: Rest of Middle East & Africa US Pharma Contract Manufacturing Industry Revenue (Million) Forecast, by Application 2020 & 2033
- Table 32: Global US Pharma Contract Manufacturing Industry Revenue Million Forecast, by Service Type 2020 & 2033
- Table 33: Global US Pharma Contract Manufacturing Industry Revenue Million Forecast, by Country 2020 & 2033
- Table 34: China US Pharma Contract Manufacturing Industry Revenue (Million) Forecast, by Application 2020 & 2033
- Table 35: India US Pharma Contract Manufacturing Industry Revenue (Million) Forecast, by Application 2020 & 2033
- Table 36: Japan US Pharma Contract Manufacturing Industry Revenue (Million) Forecast, by Application 2020 & 2033
- Table 37: South Korea US Pharma Contract Manufacturing Industry Revenue (Million) Forecast, by Application 2020 & 2033
- Table 38: ASEAN US Pharma Contract Manufacturing Industry Revenue (Million) Forecast, by Application 2020 & 2033
- Table 39: Oceania US Pharma Contract Manufacturing Industry Revenue (Million) Forecast, by Application 2020 & 2033
- Table 40: Rest of Asia Pacific US Pharma Contract Manufacturing Industry Revenue (Million) Forecast, by Application 2020 & 2033
Frequently Asked Questions
1. What is the projected Compound Annual Growth Rate (CAGR) of the US Pharma Contract Manufacturing Industry?
The projected CAGR is approximately 5.00%.
2. Which companies are prominent players in the US Pharma Contract Manufacturing Industry?
Key companies in the market include Thermo Fisher Scientific Inc (Patheon Inc ), Siegfried AG*List Not Exhaustive, Aenova Group, Lonza Group AG, Pfizer CentreSource (Pfizer Inc ), Jubilant Life Sciences Ltd, Catalent Inc, AbbVie Contract Manufacturing, Boehringer Ingelheim Group, Recipharm AB, Baxter Biopharma Solutions (Baxter International Inc ).
3. What are the main segments of the US Pharma Contract Manufacturing Industry?
The market segments include Service Type.
4. Can you provide details about the market size?
The market size is estimated to be USD XX Million as of 2022.
5. What are some drivers contributing to market growth?
; Increasing Emphasis on Drug Discovery and Outsourcing of Manufacturing; Strong R&D Investments.
6. What are the notable trends driving market growth?
Increasing Demand of API to Witness Significant Market Growth.
7. Are there any restraints impacting market growth?
Increasing Lead Time and Logistics Costs; Stringent Regulatory Requirements; Capacity Utilization Issues Affecting the Profitability of CMOs.
8. Can you provide examples of recent developments in the market?
N/A
9. What pricing options are available for accessing the report?
Pricing options include single-user, multi-user, and enterprise licenses priced at USD 3800, USD 4500, and USD 5800 respectively.
10. Is the market size provided in terms of value or volume?
The market size is provided in terms of value, measured in Million.
11. Are there any specific market keywords associated with the report?
Yes, the market keyword associated with the report is "US Pharma Contract Manufacturing Industry," which aids in identifying and referencing the specific market segment covered.
12. How do I determine which pricing option suits my needs best?
The pricing options vary based on user requirements and access needs. Individual users may opt for single-user licenses, while businesses requiring broader access may choose multi-user or enterprise licenses for cost-effective access to the report.
13. Are there any additional resources or data provided in the US Pharma Contract Manufacturing Industry report?
While the report offers comprehensive insights, it's advisable to review the specific contents or supplementary materials provided to ascertain if additional resources or data are available.
14. How can I stay updated on further developments or reports in the US Pharma Contract Manufacturing Industry?
To stay informed about further developments, trends, and reports in the US Pharma Contract Manufacturing Industry, consider subscribing to industry newsletters, following relevant companies and organizations, or regularly checking reputable industry news sources and publications.
Methodology
Step 1 - Identification of Relevant Samples Size from Population Database


Step 2 - Approaches for Defining Global Market Size (Value, Volume* & Price*)

Note*: In applicable scenarios
Step 3 - Data Sources
Primary Research
- Web Analytics
- Survey Reports
- Research Institute
- Latest Research Reports
- Opinion Leaders
Secondary Research
- Annual Reports
- White Paper
- Latest Press Release
- Industry Association
- Paid Database
- Investor Presentations

Step 4 - Data Triangulation
Involves using different sources of information in order to increase the validity of a study
These sources are likely to be stakeholders in a program - participants, other researchers, program staff, other community members, and so on.
Then we put all data in single framework & apply various statistical tools to find out the dynamic on the market.
During the analysis stage, feedback from the stakeholder groups would be compared to determine areas of agreement as well as areas of divergence