

Key Insights
The U.S. beverage packaging market is poised for significant expansion, driven by escalating demand for convenient, sustainable, and visually appealing packaging solutions. The market, valued at $42.16 billion in 2025, is projected to achieve a Compound Annual Growth Rate (CAGR) of 6.57% from 2025 to 2033. Key growth catalysts include the surging popularity of ready-to-drink (RTD) beverages, the expanding e-commerce sector necessitating resilient packaging, and a pronounced consumer preference for eco-friendly materials such as recyclable and biodegradable options. The growing emphasis on health and wellness also shapes packaging choices, with a rising demand for transparent designs that highlight natural ingredients. Dominant segments, including plastic bottles for water and energy drinks, alongside aluminum cans for alcoholic beverages, are expected to spearhead this market growth. Nevertheless, challenges persist, such as volatile raw material costs, concerns regarding plastic waste, and the imperative for continuous innovation to align with evolving consumer sustainability expectations.
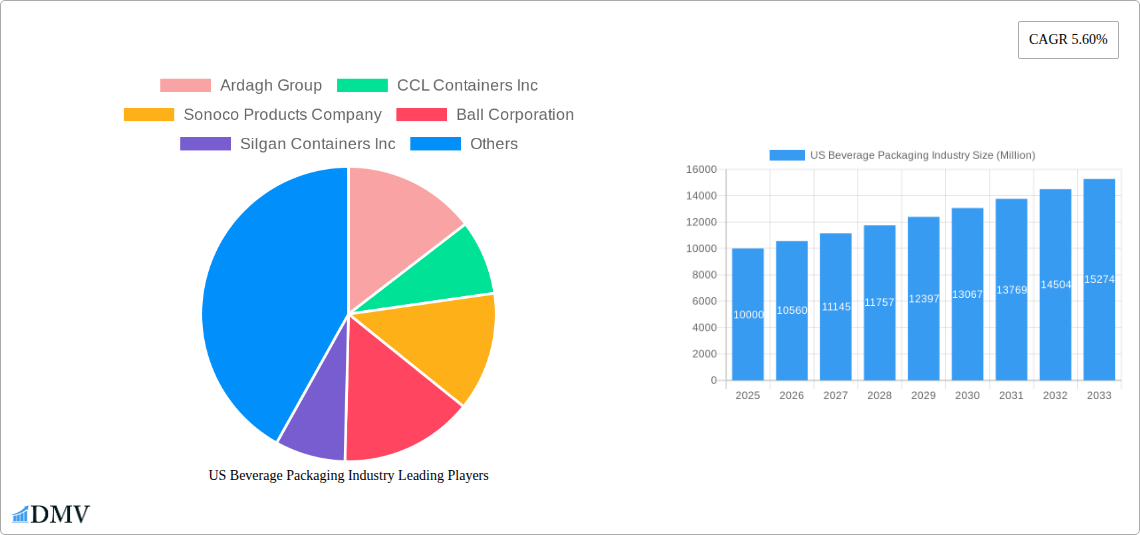
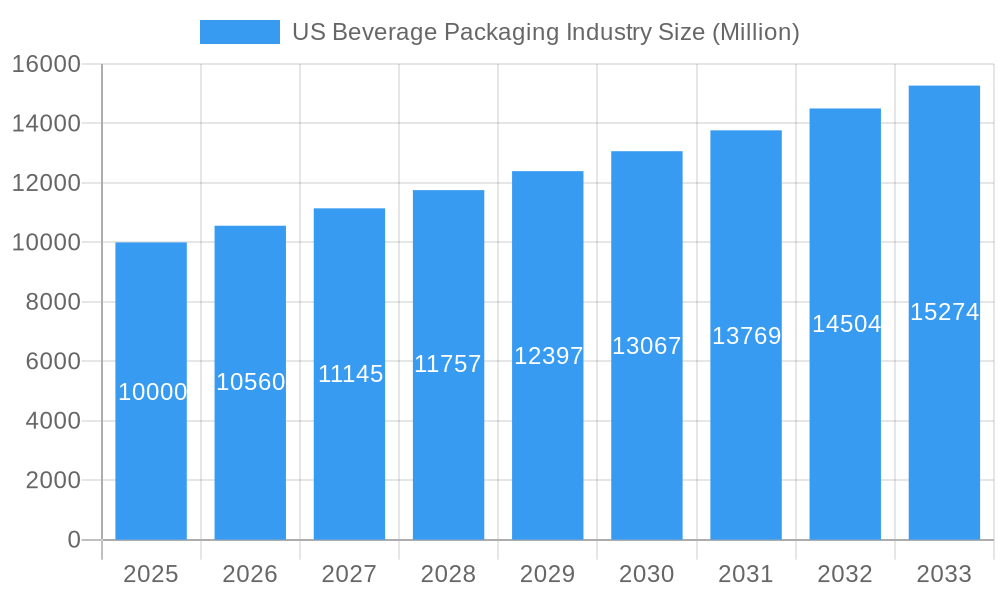
US Beverage Packaging Industry Market Size (In Billion)
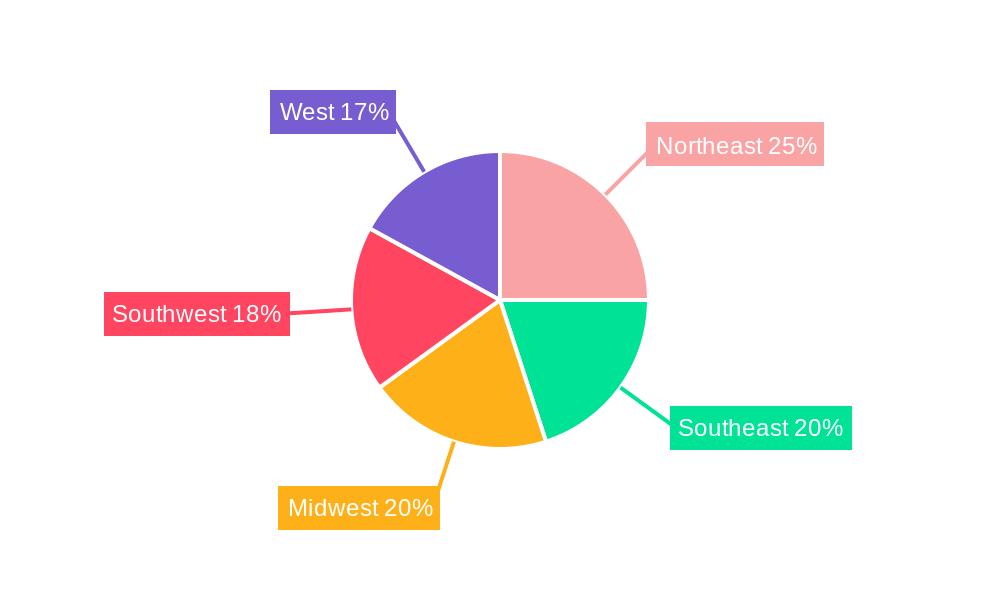
The competitive arena is characterized by leading entities such as Ardagh Group, Ball Corporation, and Amcor Limited, all actively investing in research and development to advance packaging technologies and broaden their product offerings. Regional dynamics within the U.S. market are noteworthy, with areas like the Northeast and West anticipated to exhibit accelerated growth, attributed to higher population density and disposable income levels. The market's future trajectory will be intrinsically linked to ongoing advancements in sustainable materials, the implementation of effective waste management strategies, and the adaptability of packaging manufacturers to shifting consumer preferences and regulatory mandates. This includes increased incorporation of recycled content, the development of lighter-weight packaging designs, and the exploration of alternative materials like plant-based plastics and paperboard substitutes. Furthermore, companies are prioritizing supply chain optimization and the reduction of their overall carbon footprint to satisfy heightened sustainability demands.
US Beverage Packaging Industry Company Market Share
US Beverage Packaging Industry: A Comprehensive Market Report (2019-2033)
This insightful report provides a comprehensive analysis of the US beverage packaging industry, offering a detailed overview of market trends, leading players, and future growth prospects. With a study period spanning 2019-2033, a base year of 2025, and a forecast period of 2025-2033, this report is an invaluable resource for stakeholders seeking to understand and capitalize on opportunities within this dynamic sector. The market is valued at xx Million in 2025 and is projected to reach xx Million by 2033.
US Beverage Packaging Industry Market Composition & Trends
This section delves into the competitive landscape of the US beverage packaging market, evaluating market concentration, innovation drivers, regulatory influences, substitute products, end-user profiles, and mergers & acquisitions (M&A) activity. The market exhibits a moderately concentrated structure, with key players holding significant market share. Analysis includes the distribution of market share among leading companies such as Ball Corporation, Amcor Limited, and Crown Holdings Inc., revealing their competitive strategies and market dominance. Innovation in sustainable materials like recycled plastics and plant-based alternatives is a key trend. Regulatory changes regarding plastic waste and recyclability significantly influence packaging choices. The report also examines the impact of substitute products and analyzes end-user preferences across various beverage segments. Finally, it details recent M&A activity, including deal values (xx Million in total for the period 2019-2024), offering insights into industry consolidation and strategic partnerships.
- Market Share Distribution: Ball Corporation (18%), Amcor Limited (15%), Crown Holdings Inc. (12%), others (55%). (These are estimated values).
- M&A Deal Values (2019-2024): xx Million
- Key Regulatory Changes: Focus on reducing plastic waste, increasing recyclability.
- Emerging Substitute Products: Bio-based polymers, compostable materials.
US Beverage Packaging Industry Industry Evolution
This section analyzes the historical and projected growth trajectories of the US beverage packaging market, focusing on technological advancements and evolving consumer preferences. From 2019 to 2024, the market experienced a Compound Annual Growth Rate (CAGR) of xx%, driven by factors such as increasing beverage consumption, the rise of e-commerce, and a growing demand for convenient packaging formats. Technological advancements, including lightweighting, improved barrier properties, and smart packaging solutions, are reshaping the industry. Consumer preference shifts towards sustainability, eco-friendly materials, and convenient packaging formats (e.g., single-serve pouches and on-the-go containers) are also major influences. The report projects a CAGR of xx% from 2025 to 2033, driven by ongoing technological advancements and expanding consumer demand.
Leading Regions, Countries, or Segments in US Beverage Packaging Industry
This section identifies the dominant regions, countries, and segments within the US beverage packaging market. Analysis includes breakdowns by material (plastic, metal, glass, paperboard), product type (bottles, cans, pouches, cartons, beer kegs), and application (alcoholic beverages, milk, energy drinks, other applications). The report pinpoints the leading segments and provides in-depth analysis of the factors driving their dominance.
By Material: Metal packaging (cans) holds a significant market share, driven by its suitability for carbonated drinks and alcoholic beverages. This is followed by plastic and paperboard.
By Product Type: Cans dominate due to their versatility and suitability for various beverages. Bottles maintain a strong presence in certain segments (e.g., milk, juice).
By Application: Alcoholic beverages and carbonated soft drinks represent the largest applications, reflecting the high demand for these products.
Key Drivers: Investment in advanced manufacturing technologies, increasing consumer demand for convenience and sustainability, and favorable regulatory environments are significant drivers in the key segments.
US Beverage Packaging Industry Product Innovations
The US beverage packaging industry witnesses continuous innovation in materials, designs, and functionalities. Lightweighting technologies reduce material usage and transportation costs, while improved barrier properties enhance product shelf life. Smart packaging solutions, including integrated sensors and RFID tags, provide real-time tracking and enhance supply chain efficiency. These advancements cater to growing consumer demands for sustainability and convenience. Unique selling propositions include eco-friendly materials, customized designs, and enhanced functionality.
Propelling Factors for US Beverage Packaging Industry Growth
Several factors fuel the growth of the US beverage packaging market. Technological advancements, including automation and lightweighting, enhance efficiency and reduce costs. Economic growth and rising disposable incomes lead to increased beverage consumption. Favorable government regulations promoting recyclability and sustainable packaging drive the adoption of eco-friendly options. The expanding e-commerce sector creates demand for protective and tamper-evident packaging solutions.
Obstacles in the US Beverage Packaging Industry Market
Despite its growth potential, the US beverage packaging industry faces certain challenges. Stringent environmental regulations increase compliance costs. Fluctuations in raw material prices impact profitability. Intense competition from both domestic and international players creates pricing pressure. Supply chain disruptions caused by geopolitical events and pandemics can severely impact operations.
Future Opportunities in US Beverage Packaging Industry
Future opportunities lie in the development of sustainable packaging solutions, such as biodegradable and compostable materials. The growing demand for convenient and personalized packaging presents further opportunities. Expanding into new beverage segments and exploring new markets (e.g., functional beverages and ready-to-drink cocktails) offers significant potential. Investing in smart packaging technology creates opportunities for improved supply chain efficiency and enhanced consumer engagement.
Major Players in the US Beverage Packaging Industry Ecosystem
- Ardagh Group
- CCL Containers Inc
- Sonoco Products Company
- Ball Corporation [Ball Corporation]
- Silgan Containers Inc [Silgan Containers Inc]
- Amcor Limited [Amcor Limited]
- Berry Global Inc [Berry Global Inc]
- Berlin Packaging
- Westroc
- Crown Holdings Inc [Crown Holdings Inc]
- Owens-Illinois Inc [Owens-Illinois Inc]
Key Developments in US Beverage Packaging Industry Industry
- July 2021: Ball Corporation announces significant expansion of manufacturing capacity with new facilities in the UK and Russia, driven by increasing demand for aluminum cans.
- September 2021: Crown Holdings Inc. announces a new aluminum beverage can manufacturing facility in Mesquite, Nevada, to meet growing demand in the Southwestern US.
Strategic US Beverage Packaging Industry Market Forecast
The US beverage packaging market is poised for robust growth in the coming years, driven by increasing beverage consumption, technological innovation, and a growing focus on sustainability. Opportunities exist in developing innovative and eco-friendly packaging solutions, leveraging smart packaging technologies, and expanding into new beverage segments. The market's potential is significant, with projected substantial growth in the forecast period.
US Beverage Packaging Industry Segmentation
-
1. Material
- 1.1. Plastic
- 1.2. Metal
- 1.3. Glass
- 1.4. Paperboard
-
2. Product Type
- 2.1. Bottles
- 2.2. Cans
- 2.3. Pouches
- 2.4. Cartons
- 2.5. Beer kegs
-
3. Application
- 3.1. Alcoholic Beverages
- 3.2. Milk
- 3.3. Energy Drinks
- 3.4. Other applications
US Beverage Packaging Industry Segmentation By Geography
-
1. North America
- 1.1. United States
- 1.2. Canada
- 1.3. Mexico
-
2. South America
- 2.1. Brazil
- 2.2. Argentina
- 2.3. Rest of South America
-
3. Europe
- 3.1. United Kingdom
- 3.2. Germany
- 3.3. France
- 3.4. Italy
- 3.5. Spain
- 3.6. Russia
- 3.7. Benelux
- 3.8. Nordics
- 3.9. Rest of Europe
-
4. Middle East & Africa
- 4.1. Turkey
- 4.2. Israel
- 4.3. GCC
- 4.4. North Africa
- 4.5. South Africa
- 4.6. Rest of Middle East & Africa
-
5. Asia Pacific
- 5.1. China
- 5.2. India
- 5.3. Japan
- 5.4. South Korea
- 5.5. ASEAN
- 5.6. Oceania
- 5.7. Rest of Asia Pacific
US Beverage Packaging Industry Regional Market Share
Geographic Coverage of US Beverage Packaging Industry
US Beverage Packaging Industry REPORT HIGHLIGHTS
| Aspects | Details |
|---|---|
| Study Period | 2020-2034 |
| Base Year | 2025 |
| Estimated Year | 2026 |
| Forecast Period | 2026-2034 |
| Historical Period | 2020-2025 |
| Growth Rate | CAGR of 6.57% from 2020-2034 |
| Segmentation |
|
Table of Contents
- 1. Introduction
- 1.1. Research Scope
- 1.2. Market Segmentation
- 1.3. Research Objective
- 1.4. Definitions and Assumptions
- 2. Executive Summary
- 2.1. Market Snapshot
- 3. Market Dynamics
- 3.1. Market Drivers
- 3.2. Market Restrains
- 3.3. Market Trends
- 3.4. Market Opportunities
- 4. Market Factor Analysis
- 4.1. Porters Five Forces
- 4.1.1. Bargaining Power of Suppliers
- 4.1.2. Bargaining Power of Buyers
- 4.1.3. Threat of New Entrants
- 4.1.4. Threat of Substitutes
- 4.1.5. Competitive Rivalry
- 4.2. PESTEL analysis
- 4.3. BCG Analysis
- 4.3.1. Stars (High Growth, High Market Share)
- 4.3.2. Cash Cows (Low Growth, High Market Share)
- 4.3.3. Question Mark (High Growth, Low Market Share)
- 4.3.4. Dogs (Low Growth, Low Market Share)
- 4.4. Ansoff Matrix Analysis
- 4.5. Supply Chain Analysis
- 4.6. Regulatory Landscape
- 4.7. Current Market Potential and Opportunity Assessment (TAM–SAM–SOM Framework)
- 4.8. DMV Analyst Note
- 4.1. Porters Five Forces
- 5. Market Analysis, Insights and Forecast 2021-2033
- 5.1. Market Analysis, Insights and Forecast - by Material
- 5.1.1. Plastic
- 5.1.2. Metal
- 5.1.3. Glass
- 5.1.4. Paperboard
- 5.2. Market Analysis, Insights and Forecast - by Product Type
- 5.2.1. Bottles
- 5.2.2. Cans
- 5.2.3. Pouches
- 5.2.4. Cartons
- 5.2.5. Beer kegs
- 5.3. Market Analysis, Insights and Forecast - by Application
- 5.3.1. Alcoholic Beverages
- 5.3.2. Milk
- 5.3.3. Energy Drinks
- 5.3.4. Other applications
- 5.4. Market Analysis, Insights and Forecast - by Region
- 5.4.1. North America
- 5.4.2. South America
- 5.4.3. Europe
- 5.4.4. Middle East & Africa
- 5.4.5. Asia Pacific
- 5.1. Market Analysis, Insights and Forecast - by Material
- 6. Global US Beverage Packaging Industry Analysis, Insights and Forecast, 2021-2033
- 6.1. Market Analysis, Insights and Forecast - by Material
- 6.1.1. Plastic
- 6.1.2. Metal
- 6.1.3. Glass
- 6.1.4. Paperboard
- 6.2. Market Analysis, Insights and Forecast - by Product Type
- 6.2.1. Bottles
- 6.2.2. Cans
- 6.2.3. Pouches
- 6.2.4. Cartons
- 6.2.5. Beer kegs
- 6.3. Market Analysis, Insights and Forecast - by Application
- 6.3.1. Alcoholic Beverages
- 6.3.2. Milk
- 6.3.3. Energy Drinks
- 6.3.4. Other applications
- 6.1. Market Analysis, Insights and Forecast - by Material
- 7. North America US Beverage Packaging Industry Analysis, Insights and Forecast, 2020-2032
- 7.1. Market Analysis, Insights and Forecast - by Material
- 7.1.1. Plastic
- 7.1.2. Metal
- 7.1.3. Glass
- 7.1.4. Paperboard
- 7.2. Market Analysis, Insights and Forecast - by Product Type
- 7.2.1. Bottles
- 7.2.2. Cans
- 7.2.3. Pouches
- 7.2.4. Cartons
- 7.2.5. Beer kegs
- 7.3. Market Analysis, Insights and Forecast - by Application
- 7.3.1. Alcoholic Beverages
- 7.3.2. Milk
- 7.3.3. Energy Drinks
- 7.3.4. Other applications
- 7.1. Market Analysis, Insights and Forecast - by Material
- 8. South America US Beverage Packaging Industry Analysis, Insights and Forecast, 2020-2032
- 8.1. Market Analysis, Insights and Forecast - by Material
- 8.1.1. Plastic
- 8.1.2. Metal
- 8.1.3. Glass
- 8.1.4. Paperboard
- 8.2. Market Analysis, Insights and Forecast - by Product Type
- 8.2.1. Bottles
- 8.2.2. Cans
- 8.2.3. Pouches
- 8.2.4. Cartons
- 8.2.5. Beer kegs
- 8.3. Market Analysis, Insights and Forecast - by Application
- 8.3.1. Alcoholic Beverages
- 8.3.2. Milk
- 8.3.3. Energy Drinks
- 8.3.4. Other applications
- 8.1. Market Analysis, Insights and Forecast - by Material
- 9. Europe US Beverage Packaging Industry Analysis, Insights and Forecast, 2020-2032
- 9.1. Market Analysis, Insights and Forecast - by Material
- 9.1.1. Plastic
- 9.1.2. Metal
- 9.1.3. Glass
- 9.1.4. Paperboard
- 9.2. Market Analysis, Insights and Forecast - by Product Type
- 9.2.1. Bottles
- 9.2.2. Cans
- 9.2.3. Pouches
- 9.2.4. Cartons
- 9.2.5. Beer kegs
- 9.3. Market Analysis, Insights and Forecast - by Application
- 9.3.1. Alcoholic Beverages
- 9.3.2. Milk
- 9.3.3. Energy Drinks
- 9.3.4. Other applications
- 9.1. Market Analysis, Insights and Forecast - by Material
- 10. Middle East & Africa US Beverage Packaging Industry Analysis, Insights and Forecast, 2020-2032
- 10.1. Market Analysis, Insights and Forecast - by Material
- 10.1.1. Plastic
- 10.1.2. Metal
- 10.1.3. Glass
- 10.1.4. Paperboard
- 10.2. Market Analysis, Insights and Forecast - by Product Type
- 10.2.1. Bottles
- 10.2.2. Cans
- 10.2.3. Pouches
- 10.2.4. Cartons
- 10.2.5. Beer kegs
- 10.3. Market Analysis, Insights and Forecast - by Application
- 10.3.1. Alcoholic Beverages
- 10.3.2. Milk
- 10.3.3. Energy Drinks
- 10.3.4. Other applications
- 10.1. Market Analysis, Insights and Forecast - by Material
- 11. Asia Pacific US Beverage Packaging Industry Analysis, Insights and Forecast, 2020-2032
- 11.1. Market Analysis, Insights and Forecast - by Material
- 11.1.1. Plastic
- 11.1.2. Metal
- 11.1.3. Glass
- 11.1.4. Paperboard
- 11.2. Market Analysis, Insights and Forecast - by Product Type
- 11.2.1. Bottles
- 11.2.2. Cans
- 11.2.3. Pouches
- 11.2.4. Cartons
- 11.2.5. Beer kegs
- 11.3. Market Analysis, Insights and Forecast - by Application
- 11.3.1. Alcoholic Beverages
- 11.3.2. Milk
- 11.3.3. Energy Drinks
- 11.3.4. Other applications
- 11.1. Market Analysis, Insights and Forecast - by Material
- 12. Competitive Analysis
- 12.1. Company Profiles
- 12.1.1 Ardagh Group
- 12.1.1.1. Company Overview
- 12.1.1.2. Products
- 12.1.1.3. Company Financials
- 12.1.1.4. SWOT Analysis
- 12.1.2 CCL Containers Inc
- 12.1.2.1. Company Overview
- 12.1.2.2. Products
- 12.1.2.3. Company Financials
- 12.1.2.4. SWOT Analysis
- 12.1.3 Sonoco Products Company
- 12.1.3.1. Company Overview
- 12.1.3.2. Products
- 12.1.3.3. Company Financials
- 12.1.3.4. SWOT Analysis
- 12.1.4 Ball Corporation
- 12.1.4.1. Company Overview
- 12.1.4.2. Products
- 12.1.4.3. Company Financials
- 12.1.4.4. SWOT Analysis
- 12.1.5 Silgan Containers Inc
- 12.1.5.1. Company Overview
- 12.1.5.2. Products
- 12.1.5.3. Company Financials
- 12.1.5.4. SWOT Analysis
- 12.1.6 Amcor Limited
- 12.1.6.1. Company Overview
- 12.1.6.2. Products
- 12.1.6.3. Company Financials
- 12.1.6.4. SWOT Analysis
- 12.1.7 Berry Global Inc
- 12.1.7.1. Company Overview
- 12.1.7.2. Products
- 12.1.7.3. Company Financials
- 12.1.7.4. SWOT Analysis
- 12.1.8 Berlin Packaging
- 12.1.8.1. Company Overview
- 12.1.8.2. Products
- 12.1.8.3. Company Financials
- 12.1.8.4. SWOT Analysis
- 12.1.9 Westroc
- 12.1.9.1. Company Overview
- 12.1.9.2. Products
- 12.1.9.3. Company Financials
- 12.1.9.4. SWOT Analysis
- 12.1.10 Crown Holdings Inc
- 12.1.10.1. Company Overview
- 12.1.10.2. Products
- 12.1.10.3. Company Financials
- 12.1.10.4. SWOT Analysis
- 12.1.11 Owens-illinois Inc
- 12.1.11.1. Company Overview
- 12.1.11.2. Products
- 12.1.11.3. Company Financials
- 12.1.11.4. SWOT Analysis
- 12.1.1 Ardagh Group
- 12.2. Market Entropy
- 12.2.1 Company's Key Areas Served
- 12.2.2 Recent Developments
- 12.3. Company Market Share Analysis 2025
- 12.3.1 Top 5 Companies Market Share Analysis
- 12.3.2 Top 3 Companies Market Share Analysis
- 12.4. List of Potential Customers
- 13. Research Methodology
List of Figures
- Figure 1: Global US Beverage Packaging Industry Revenue Breakdown (billion, %) by Region 2025 & 2033
- Figure 2: North America US Beverage Packaging Industry Revenue (billion), by Material 2025 & 2033
- Figure 3: North America US Beverage Packaging Industry Revenue Share (%), by Material 2025 & 2033
- Figure 4: North America US Beverage Packaging Industry Revenue (billion), by Product Type 2025 & 2033
- Figure 5: North America US Beverage Packaging Industry Revenue Share (%), by Product Type 2025 & 2033
- Figure 6: North America US Beverage Packaging Industry Revenue (billion), by Application 2025 & 2033
- Figure 7: North America US Beverage Packaging Industry Revenue Share (%), by Application 2025 & 2033
- Figure 8: North America US Beverage Packaging Industry Revenue (billion), by Country 2025 & 2033
- Figure 9: North America US Beverage Packaging Industry Revenue Share (%), by Country 2025 & 2033
- Figure 10: South America US Beverage Packaging Industry Revenue (billion), by Material 2025 & 2033
- Figure 11: South America US Beverage Packaging Industry Revenue Share (%), by Material 2025 & 2033
- Figure 12: South America US Beverage Packaging Industry Revenue (billion), by Product Type 2025 & 2033
- Figure 13: South America US Beverage Packaging Industry Revenue Share (%), by Product Type 2025 & 2033
- Figure 14: South America US Beverage Packaging Industry Revenue (billion), by Application 2025 & 2033
- Figure 15: South America US Beverage Packaging Industry Revenue Share (%), by Application 2025 & 2033
- Figure 16: South America US Beverage Packaging Industry Revenue (billion), by Country 2025 & 2033
- Figure 17: South America US Beverage Packaging Industry Revenue Share (%), by Country 2025 & 2033
- Figure 18: Europe US Beverage Packaging Industry Revenue (billion), by Material 2025 & 2033
- Figure 19: Europe US Beverage Packaging Industry Revenue Share (%), by Material 2025 & 2033
- Figure 20: Europe US Beverage Packaging Industry Revenue (billion), by Product Type 2025 & 2033
- Figure 21: Europe US Beverage Packaging Industry Revenue Share (%), by Product Type 2025 & 2033
- Figure 22: Europe US Beverage Packaging Industry Revenue (billion), by Application 2025 & 2033
- Figure 23: Europe US Beverage Packaging Industry Revenue Share (%), by Application 2025 & 2033
- Figure 24: Europe US Beverage Packaging Industry Revenue (billion), by Country 2025 & 2033
- Figure 25: Europe US Beverage Packaging Industry Revenue Share (%), by Country 2025 & 2033
- Figure 26: Middle East & Africa US Beverage Packaging Industry Revenue (billion), by Material 2025 & 2033
- Figure 27: Middle East & Africa US Beverage Packaging Industry Revenue Share (%), by Material 2025 & 2033
- Figure 28: Middle East & Africa US Beverage Packaging Industry Revenue (billion), by Product Type 2025 & 2033
- Figure 29: Middle East & Africa US Beverage Packaging Industry Revenue Share (%), by Product Type 2025 & 2033
- Figure 30: Middle East & Africa US Beverage Packaging Industry Revenue (billion), by Application 2025 & 2033
- Figure 31: Middle East & Africa US Beverage Packaging Industry Revenue Share (%), by Application 2025 & 2033
- Figure 32: Middle East & Africa US Beverage Packaging Industry Revenue (billion), by Country 2025 & 2033
- Figure 33: Middle East & Africa US Beverage Packaging Industry Revenue Share (%), by Country 2025 & 2033
- Figure 34: Asia Pacific US Beverage Packaging Industry Revenue (billion), by Material 2025 & 2033
- Figure 35: Asia Pacific US Beverage Packaging Industry Revenue Share (%), by Material 2025 & 2033
- Figure 36: Asia Pacific US Beverage Packaging Industry Revenue (billion), by Product Type 2025 & 2033
- Figure 37: Asia Pacific US Beverage Packaging Industry Revenue Share (%), by Product Type 2025 & 2033
- Figure 38: Asia Pacific US Beverage Packaging Industry Revenue (billion), by Application 2025 & 2033
- Figure 39: Asia Pacific US Beverage Packaging Industry Revenue Share (%), by Application 2025 & 2033
- Figure 40: Asia Pacific US Beverage Packaging Industry Revenue (billion), by Country 2025 & 2033
- Figure 41: Asia Pacific US Beverage Packaging Industry Revenue Share (%), by Country 2025 & 2033
List of Tables
- Table 1: Global US Beverage Packaging Industry Revenue billion Forecast, by Material 2020 & 2033
- Table 2: Global US Beverage Packaging Industry Revenue billion Forecast, by Product Type 2020 & 2033
- Table 3: Global US Beverage Packaging Industry Revenue billion Forecast, by Application 2020 & 2033
- Table 4: Global US Beverage Packaging Industry Revenue billion Forecast, by Region 2020 & 2033
- Table 5: Global US Beverage Packaging Industry Revenue billion Forecast, by Material 2020 & 2033
- Table 6: Global US Beverage Packaging Industry Revenue billion Forecast, by Product Type 2020 & 2033
- Table 7: Global US Beverage Packaging Industry Revenue billion Forecast, by Application 2020 & 2033
- Table 8: Global US Beverage Packaging Industry Revenue billion Forecast, by Country 2020 & 2033
- Table 9: United States US Beverage Packaging Industry Revenue (billion) Forecast, by Application 2020 & 2033
- Table 10: Canada US Beverage Packaging Industry Revenue (billion) Forecast, by Application 2020 & 2033
- Table 11: Mexico US Beverage Packaging Industry Revenue (billion) Forecast, by Application 2020 & 2033
- Table 12: Global US Beverage Packaging Industry Revenue billion Forecast, by Material 2020 & 2033
- Table 13: Global US Beverage Packaging Industry Revenue billion Forecast, by Product Type 2020 & 2033
- Table 14: Global US Beverage Packaging Industry Revenue billion Forecast, by Application 2020 & 2033
- Table 15: Global US Beverage Packaging Industry Revenue billion Forecast, by Country 2020 & 2033
- Table 16: Brazil US Beverage Packaging Industry Revenue (billion) Forecast, by Application 2020 & 2033
- Table 17: Argentina US Beverage Packaging Industry Revenue (billion) Forecast, by Application 2020 & 2033
- Table 18: Rest of South America US Beverage Packaging Industry Revenue (billion) Forecast, by Application 2020 & 2033
- Table 19: Global US Beverage Packaging Industry Revenue billion Forecast, by Material 2020 & 2033
- Table 20: Global US Beverage Packaging Industry Revenue billion Forecast, by Product Type 2020 & 2033
- Table 21: Global US Beverage Packaging Industry Revenue billion Forecast, by Application 2020 & 2033
- Table 22: Global US Beverage Packaging Industry Revenue billion Forecast, by Country 2020 & 2033
- Table 23: United Kingdom US Beverage Packaging Industry Revenue (billion) Forecast, by Application 2020 & 2033
- Table 24: Germany US Beverage Packaging Industry Revenue (billion) Forecast, by Application 2020 & 2033
- Table 25: France US Beverage Packaging Industry Revenue (billion) Forecast, by Application 2020 & 2033
- Table 26: Italy US Beverage Packaging Industry Revenue (billion) Forecast, by Application 2020 & 2033
- Table 27: Spain US Beverage Packaging Industry Revenue (billion) Forecast, by Application 2020 & 2033
- Table 28: Russia US Beverage Packaging Industry Revenue (billion) Forecast, by Application 2020 & 2033
- Table 29: Benelux US Beverage Packaging Industry Revenue (billion) Forecast, by Application 2020 & 2033
- Table 30: Nordics US Beverage Packaging Industry Revenue (billion) Forecast, by Application 2020 & 2033
- Table 31: Rest of Europe US Beverage Packaging Industry Revenue (billion) Forecast, by Application 2020 & 2033
- Table 32: Global US Beverage Packaging Industry Revenue billion Forecast, by Material 2020 & 2033
- Table 33: Global US Beverage Packaging Industry Revenue billion Forecast, by Product Type 2020 & 2033
- Table 34: Global US Beverage Packaging Industry Revenue billion Forecast, by Application 2020 & 2033
- Table 35: Global US Beverage Packaging Industry Revenue billion Forecast, by Country 2020 & 2033
- Table 36: Turkey US Beverage Packaging Industry Revenue (billion) Forecast, by Application 2020 & 2033
- Table 37: Israel US Beverage Packaging Industry Revenue (billion) Forecast, by Application 2020 & 2033
- Table 38: GCC US Beverage Packaging Industry Revenue (billion) Forecast, by Application 2020 & 2033
- Table 39: North Africa US Beverage Packaging Industry Revenue (billion) Forecast, by Application 2020 & 2033
- Table 40: South Africa US Beverage Packaging Industry Revenue (billion) Forecast, by Application 2020 & 2033
- Table 41: Rest of Middle East & Africa US Beverage Packaging Industry Revenue (billion) Forecast, by Application 2020 & 2033
- Table 42: Global US Beverage Packaging Industry Revenue billion Forecast, by Material 2020 & 2033
- Table 43: Global US Beverage Packaging Industry Revenue billion Forecast, by Product Type 2020 & 2033
- Table 44: Global US Beverage Packaging Industry Revenue billion Forecast, by Application 2020 & 2033
- Table 45: Global US Beverage Packaging Industry Revenue billion Forecast, by Country 2020 & 2033
- Table 46: China US Beverage Packaging Industry Revenue (billion) Forecast, by Application 2020 & 2033
- Table 47: India US Beverage Packaging Industry Revenue (billion) Forecast, by Application 2020 & 2033
- Table 48: Japan US Beverage Packaging Industry Revenue (billion) Forecast, by Application 2020 & 2033
- Table 49: South Korea US Beverage Packaging Industry Revenue (billion) Forecast, by Application 2020 & 2033
- Table 50: ASEAN US Beverage Packaging Industry Revenue (billion) Forecast, by Application 2020 & 2033
- Table 51: Oceania US Beverage Packaging Industry Revenue (billion) Forecast, by Application 2020 & 2033
- Table 52: Rest of Asia Pacific US Beverage Packaging Industry Revenue (billion) Forecast, by Application 2020 & 2033
Frequently Asked Questions
1. What is the projected Compound Annual Growth Rate (CAGR) of the US Beverage Packaging Industry?
The projected CAGR is approximately 6.57%.
2. Which companies are prominent players in the US Beverage Packaging Industry?
Key companies in the market include Ardagh Group, CCL Containers Inc, Sonoco Products Company, Ball Corporation, Silgan Containers Inc, Amcor Limited, Berry Global Inc, Berlin Packaging, Westroc, Crown Holdings Inc, Owens-illinois Inc.
3. What are the main segments of the US Beverage Packaging Industry?
The market segments include Material, Product Type, Application.
4. Can you provide details about the market size?
The market size is estimated to be USD 42.16 billion as of 2022.
5. What are some drivers contributing to market growth?
Growing Demand for Bottled Beverages is Driving the Market in the Wine Industry; Increased Integration in the Premium Packaging Market Further Drives the Growth.
6. What are the notable trends driving market growth?
Alcohol Beverages to hold significant market share.
7. Are there any restraints impacting market growth?
People's Attitude Towards Sustainable Forms of Packaging.
8. Can you provide examples of recent developments in the market?
July 2021 - Ball Corporation is planning to significantly increase its manufacturing capacity, with new cutting-edge facilities in the UK and Russia. With an increasing consumer call for more sustainable purchasing options and a growing number of new brands and beverage categories choosing cans, demand for aluminum packaging is rapidly expanding around the world.
9. What pricing options are available for accessing the report?
Pricing options include single-user, multi-user, and enterprise licenses priced at USD 3800, USD 4500, and USD 5800 respectively.
10. Is the market size provided in terms of value or volume?
The market size is provided in terms of value, measured in billion.
11. Are there any specific market keywords associated with the report?
Yes, the market keyword associated with the report is "US Beverage Packaging Industry," which aids in identifying and referencing the specific market segment covered.
12. How do I determine which pricing option suits my needs best?
The pricing options vary based on user requirements and access needs. Individual users may opt for single-user licenses, while businesses requiring broader access may choose multi-user or enterprise licenses for cost-effective access to the report.
13. Are there any additional resources or data provided in the US Beverage Packaging Industry report?
While the report offers comprehensive insights, it's advisable to review the specific contents or supplementary materials provided to ascertain if additional resources or data are available.
14. How can I stay updated on further developments or reports in the US Beverage Packaging Industry?
To stay informed about further developments, trends, and reports in the US Beverage Packaging Industry, consider subscribing to industry newsletters, following relevant companies and organizations, or regularly checking reputable industry news sources and publications.
Methodology
Step 1 - Identification of Relevant Samples Size from Population Database


Step 2 - Approaches for Defining Global Market Size (Value, Volume* & Price*)

Note*: In applicable scenarios
Step 3 - Data Sources
Primary Research
- Web Analytics
- Survey Reports
- Research Institute
- Latest Research Reports
- Opinion Leaders
Secondary Research
- Annual Reports
- White Paper
- Latest Press Release
- Industry Association
- Paid Database
- Investor Presentations

Step 4 - Data Triangulation
Involves using different sources of information in order to increase the validity of a study
These sources are likely to be stakeholders in a program - participants, other researchers, program staff, other community members, and so on.
Then we put all data in single framework & apply various statistical tools to find out the dynamic on the market.
During the analysis stage, feedback from the stakeholder groups would be compared to determine areas of agreement as well as areas of divergence