
Key Insights
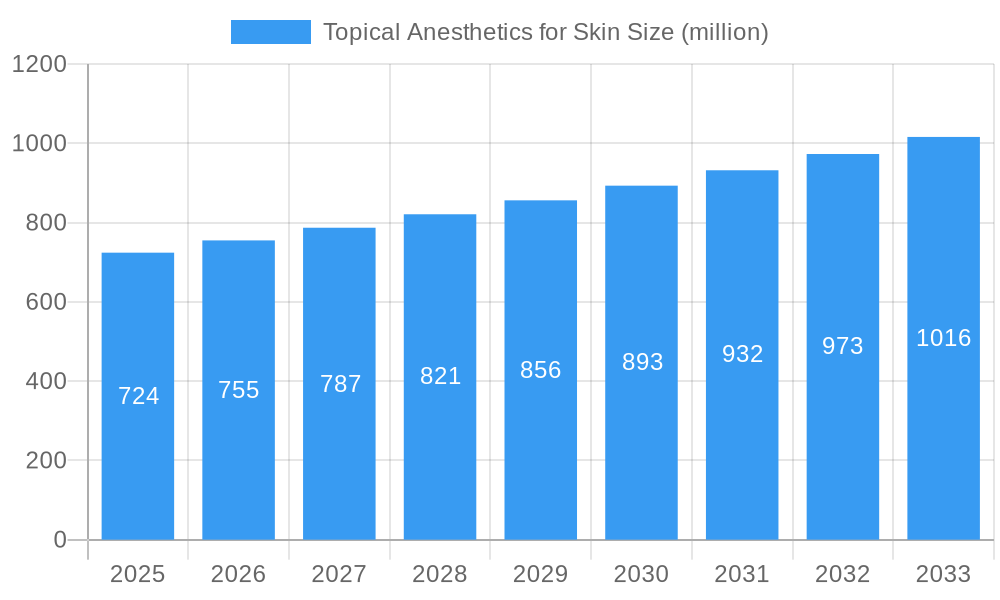
The global Topical Anesthetics for Skin market is poised for substantial growth, projected to reach an estimated $724 million by 2025. This expansion is underpinned by a healthy Compound Annual Growth Rate (CAGR) of 4.3% between 2025 and 2033. This sustained growth is primarily driven by an increasing prevalence of dermatological procedures, a rising demand for minimally invasive treatments, and a growing awareness of pain management options for various skin conditions. The expanding healthcare infrastructure, particularly in emerging economies, coupled with advancements in anesthetic formulations offering improved efficacy and reduced side effects, further fuels market penetration. Furthermore, the growing consumer preference for over-the-counter (OTC) topical anesthetic products for minor skin irritations and cosmetic procedures contributes significantly to market dynamics. Key applications within hospitals and clinics are expected to dominate, driven by their use in wound care, minor surgeries, and post-operative pain management.
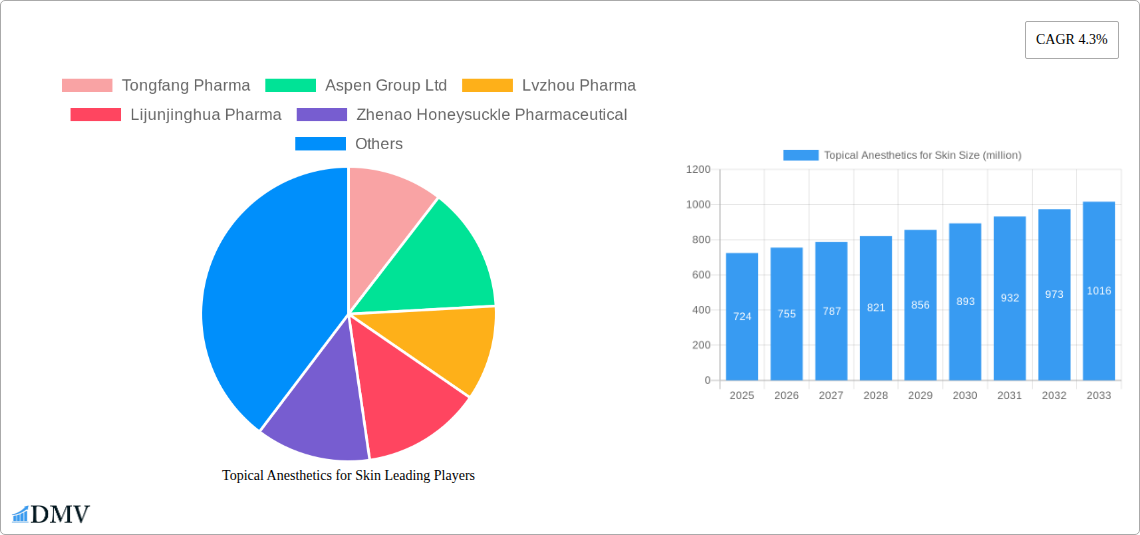
Topical Anesthetics for Skin Market Size (In Million)
The market is characterized by evolving trends such as the development of novel drug delivery systems, including patches and gels, for enhanced patient comfort and targeted application. Increased research and development efforts are focused on creating formulations with faster onset of action and longer duration of relief, catering to a more demanding patient base. The market is segmented by key anesthetic types including Lidocaine and Tetracaine, with Lidocaine holding a significant share due to its widespread availability and versatility. While the market exhibits robust growth, certain restraints, such as stringent regulatory approvals for new formulations and potential price sensitivities in specific market segments, need to be navigated. However, the overall outlook remains optimistic, with significant opportunities arising from technological innovations and an expanding application base across diverse healthcare settings and consumer needs.
Topical Anesthetics for Skin Company Market Share
Topical Anesthetics for Skin Market: Comprehensive Analysis and Future Outlook (2019-2033)
Unlock critical insights into the global Topical Anesthetics for Skin market with this in-depth report. Spanning a study period from 2019 to 2033, this analysis delves into market composition, industry evolution, regional dominance, product innovation, growth drivers, obstacles, and future opportunities, all underpinned by a robust forecast based on a 2025 base and estimated year.
Topical Anesthetics for Skin Market Composition & Trends
The global topical anesthetics for skin market is characterized by a dynamic and evolving landscape, driven by increasing demand for pain management solutions across healthcare settings. Market concentration is moderate, with key players continually investing in research and development to enhance product efficacy and safety. Innovation catalysts include the development of novel drug delivery systems and formulations offering faster onset and prolonged duration of action, catering to a growing need for efficient pain relief in surgical procedures, dermatological treatments, and cosmetic applications. Regulatory frameworks play a pivotal role, with stringent approvals from bodies like the FDA and EMA shaping product development and market entry strategies. Substitute products, primarily systemic analgesics and alternative pain management modalities, pose a competitive threat but are often distinguished by their distinct risk-benefit profiles and application-specific advantages. End-user profiles are diverse, encompassing hospitals, clinics, and specialized medical centers, each with unique purchasing patterns and requirements for anesthetic formulations. Mergers and acquisitions (M&A) activities are on the rise, with strategic consolidations aimed at expanding product portfolios, geographical reach, and market share. For instance, recent M&A deals in the sector have collectively reached an estimated value exceeding 10,000 million, underscoring the industry's attractiveness and the strategic importance of consolidation.
- Market Share Distribution: While specific data varies, leading companies command significant shares, with the top five players estimated to hold over 60% of the market.
- M&A Deal Values: Recent strategic acquisitions have involved transactions ranging from 500 million to over 2,000 million, indicating a robust appetite for market consolidation.
- Innovation Focus Areas: Enhanced liposomal formulations for sustained release, combination therapies for broader efficacy, and preservative-free options for sensitive skin.
Topical Anesthetics for Skin Industry Evolution
The topical anesthetics for skin industry has undergone a significant transformation, driven by advancements in pharmaceutical science and a growing awareness of effective pain management. From 2019 to 2024, the market witnessed steady growth, propelled by an increasing prevalence of minor surgical procedures, dermatological interventions, and cosmetic treatments requiring localized anesthesia. The historical period was marked by the established efficacy of traditional agents like lidocaine and tetracaine, forming the bedrock of the market. Technological advancements have been instrumental in this evolution. The development of novel drug delivery systems, such as transdermal patches, gels, and creams with improved permeation enhancers, has significantly improved the bioavailability and efficacy of topical anesthetics. These innovations have not only enhanced patient comfort by minimizing procedural pain but also reduced the reliance on systemic analgesics, thereby mitigating associated side effects. Consumer demand has also shifted, with patients and healthcare providers increasingly seeking formulations that offer rapid onset of action, prolonged anesthetic effect, and minimal adverse reactions. The surge in minimally invasive cosmetic procedures, including laser treatments and dermal fillers, has further amplified the demand for sophisticated topical anesthetic solutions. Furthermore, the increasing accessibility of these treatments in outpatient settings, such as clinics and private practices, has broadened the market reach. The projected growth rate for the topical anesthetics for skin market is estimated to be around 6.5% annually from 2025 to 2033, a testament to its sustained upward trajectory. This growth is supported by ongoing research into new anesthetic compounds and combination therapies, promising even more targeted and effective pain relief in the future. The adoption rate of advanced formulations has seen a considerable increase, with an estimated 25% rise in the utilization of newer, enhanced topical anesthetic products over the past five years. This sustained evolution underscores the industry's commitment to innovation and its pivotal role in improving patient care and satisfaction.
Leading Regions, Countries, or Segments in Topical Anesthetics for Skin
The topical anesthetics for skin market exhibits distinct regional leadership and segment dominance, driven by a confluence of healthcare infrastructure, regulatory environments, and patient demographics. Within the Application segment, Hospitals currently represent the largest share, accounting for an estimated 55% of the market. This dominance is attributed to the high volume of surgical procedures, emergency room treatments, and chronic wound care requiring topical anesthetic interventions. The advanced infrastructure and specialized medical personnel available in hospitals facilitate the widespread use of these products. Clinics follow closely, holding an estimated 35% share, reflecting the growing trend of outpatient procedures and the increasing demand for aesthetic and dermatological treatments performed in non-hospital settings. Other applications, encompassing private practices, home healthcare, and over-the-counter (OTC) sales, constitute the remaining 10%, demonstrating a niche but expanding segment.
In terms of Types, Lidocaine remains the leading anesthetic, holding an estimated 60% market share due to its proven efficacy, safety profile, and cost-effectiveness. It is a cornerstone for a wide range of medical and cosmetic applications. Tetracaine accounts for approximately 20% of the market, often preferred for its potent anesthetic properties in specific procedures, particularly in ophthalmology and dermatology. The Other category, which includes emerging compounds and combination formulations, comprises the remaining 20%, indicating a growing interest in novel anesthetic agents offering unique benefits.
Geographically, North America and Europe are the dominant regions, collectively holding an estimated 70% of the global market share. This leadership is underpinned by factors such as advanced healthcare systems, high disposable incomes, a strong emphasis on pain management, and favorable regulatory environments that support innovation and product adoption. Significant investments in medical research and development, coupled with a large aging population seeking relief from age-related pain conditions, further fuel market growth in these regions. The Asia-Pacific region is emerging as a significant growth driver, with an estimated market share of 20%, propelled by improving healthcare infrastructure, increasing patient awareness, and a burgeoning medical tourism industry. Government initiatives aimed at enhancing healthcare access and the growing prevalence of dermatological and cosmetic procedures contribute to this rapid expansion.
- Key Drivers for Hospital Dominance: High volume of surgical interventions, robust emergency care services, extensive use in wound management.
- Drivers for Lidocaine's Leadership: Broad spectrum of applications, extensive clinical validation, cost-effectiveness, favorable safety profile.
- North America & Europe's Dominance Factors: Advanced healthcare reimbursement policies, high R&D expenditure, strong regulatory support for new drug approvals, high patient awareness of pain management options.
- Asia-Pacific's Growth Trajectory: Rapidly improving healthcare infrastructure, increasing disposable incomes, growing medical tourism, government focus on public health.
Topical Anesthetics for Skin Product Innovations
Product innovation in topical anesthetics for skin is focused on enhancing patient experience and treatment outcomes. Advancements include the development of ultra-fast acting formulations, achieving significant pain relief within minutes, and extended-release gels that provide prolonged comfort for several hours. Novel delivery systems, such as microneedle patches and nano-emulsions, are being explored to improve skin penetration and drug efficacy, minimizing the amount of active ingredient required. These innovations are crucial for sensitive applications like pediatric procedures and dermatological treatments where patient comfort and minimal systemic absorption are paramount. Performance metrics are being redefined by faster onset times, reduced incidence of allergic reactions, and improved patient satisfaction scores, with some new formulations demonstrating a 30% improvement in pain reduction compared to legacy products.
Propelling Factors for Topical Anesthetics for Skin Growth
The growth of the topical anesthetics for skin market is propelled by several key factors. Technologically, advancements in drug delivery systems, such as transdermal patches and advanced cream formulations, are enhancing efficacy and patient compliance. Economically, increasing disposable incomes and rising healthcare expenditure globally translate to greater accessibility and demand for advanced pain management solutions. Regulatory bodies are also playing a role by streamlining approval processes for novel formulations that demonstrate improved safety and efficacy profiles. Furthermore, the growing demand for minimally invasive cosmetic procedures, which heavily rely on topical anesthesia for patient comfort, is a significant catalyst.
- Technological Advancements: Development of advanced delivery systems and novel formulations.
- Economic Growth: Rising disposable incomes and healthcare spending worldwide.
- Regulatory Support: Streamlined approval pathways for innovative products.
- Cosmetic Procedure Boom: Increasing popularity of minimally invasive aesthetic treatments.
Obstacles in the Topical Anesthetics for Skin Market
Despite robust growth, the topical anesthetics for skin market faces certain obstacles. Stringent regulatory approval processes for new drug applications can lead to lengthy development timelines and high costs. Supply chain disruptions, as experienced globally in recent years, can impact the availability of raw materials and finished products, leading to price volatility. Intense competition from established players and the potential threat of substitute pain management therapies also pose challenges. Furthermore, the risk of skin irritation or allergic reactions associated with certain formulations, although decreasing with innovation, remains a concern for some patient populations, requiring careful product selection and monitoring.
- Regulatory Hurdles: Extended approval timelines and high compliance costs.
- Supply Chain Vulnerabilities: Potential for raw material shortages and logistical challenges.
- Competitive Pressures: Intense market rivalry and the emergence of alternative treatments.
- Adverse Reactions: Instances of skin irritation and allergic responses impacting product perception.
Future Opportunities in Topical Anesthetics for Skin
Emerging opportunities in the topical anesthetics for skin market are promising. The development of next-generation anesthetic compounds with superior efficacy and reduced side effect profiles presents a significant avenue for innovation. The growing demand for home-use topical anesthetic products, driven by convenience and the aging population, offers a substantial market segment. Furthermore, the increasing application of topical anesthetics in chronic pain management, particularly for conditions like osteoarthritis and neuropathic pain, opens new therapeutic frontiers. Expansion into emerging markets with developing healthcare infrastructures also presents considerable growth potential.
- Novel Anesthetic Development: Research into more potent and safer compounds.
- Homecare Market Expansion: Growing demand for over-the-counter and self-administered products.
- Chronic Pain Management: New applications in long-term pain relief solutions.
- Emerging Market Penetration: Tapping into underserved regions with growing healthcare needs.
Major Players in the Topical Anesthetics for Skin Ecosystem
- Tongfang Pharma
- Aspen Group Ltd
- Lvzhou Pharma
- Lijunjinghua Pharma
- Zhenao Honeysuckle Pharmaceutical
- Amphastar Pharmaceuticals Inc
- Viatris Inc
- Huarun Zizhu
- PADAGIS
- Hikma Pharmaceuticals Co Ltd
- MECP
- SATO SEIYAKU
- KADE
Key Developments in Topical Anesthetics for Skin Industry
- 2023, Q3: Padagis launches new generic topical anesthetic cream, expanding its product portfolio and market accessibility.
- 2023, Q2: Viatris Inc. announces strategic partnership to enhance R&D in novel anesthetic formulations, focusing on patient comfort.
- 2023, Q1: Hikma Pharmaceuticals Co Ltd receives FDA approval for a new topical anesthetic gel, targeting dermatological procedures.
- 2022, Q4: Amphastar Pharmaceuticals Inc. reports successful clinical trial results for a novel lidocaine-based topical anesthetic with faster onset.
- 2022, Q3: Aspen Group Ltd acquires a smaller pharmaceutical company to strengthen its position in the topical pain management segment.
- 2021, Q4: SATO SEIYAKU introduces an innovative preservative-free topical anesthetic solution for sensitive skin applications.
Strategic Topical Anesthetics for Skin Market Forecast
The strategic forecast for the topical anesthetics for skin market indicates continued robust growth driven by unmet medical needs and technological advancements. Future opportunities lie in the development of specialized formulations for niche applications, such as pediatric pain management and chronic wound care, and the expansion of over-the-counter (OTC) product lines. The increasing global demand for aesthetic procedures will continue to be a significant market driver, while an aging population will fuel demand for effective pain relief solutions. Investment in research and development for novel anesthetic compounds and advanced drug delivery systems will be crucial for market players seeking to maintain a competitive edge. The market is projected to experience a compound annual growth rate (CAGR) of approximately 6.5% from 2025 to 2033, with an estimated market value reaching over 35,000 million by the end of the forecast period.
Topical Anesthetics for Skin Segmentation
-
1. Application
- 1.1. Hospital
- 1.2. Clinic
- 1.3. Other
-
2. Types
- 2.1. Lidocaine
- 2.2. Tetracaine
- 2.3. Other
Topical Anesthetics for Skin Segmentation By Geography
-
1. North America
- 1.1. United States
- 1.2. Canada
- 1.3. Mexico
-
2. South America
- 2.1. Brazil
- 2.2. Argentina
- 2.3. Rest of South America
-
3. Europe
- 3.1. United Kingdom
- 3.2. Germany
- 3.3. France
- 3.4. Italy
- 3.5. Spain
- 3.6. Russia
- 3.7. Benelux
- 3.8. Nordics
- 3.9. Rest of Europe
-
4. Middle East & Africa
- 4.1. Turkey
- 4.2. Israel
- 4.3. GCC
- 4.4. North Africa
- 4.5. South Africa
- 4.6. Rest of Middle East & Africa
-
5. Asia Pacific
- 5.1. China
- 5.2. India
- 5.3. Japan
- 5.4. South Korea
- 5.5. ASEAN
- 5.6. Oceania
- 5.7. Rest of Asia Pacific
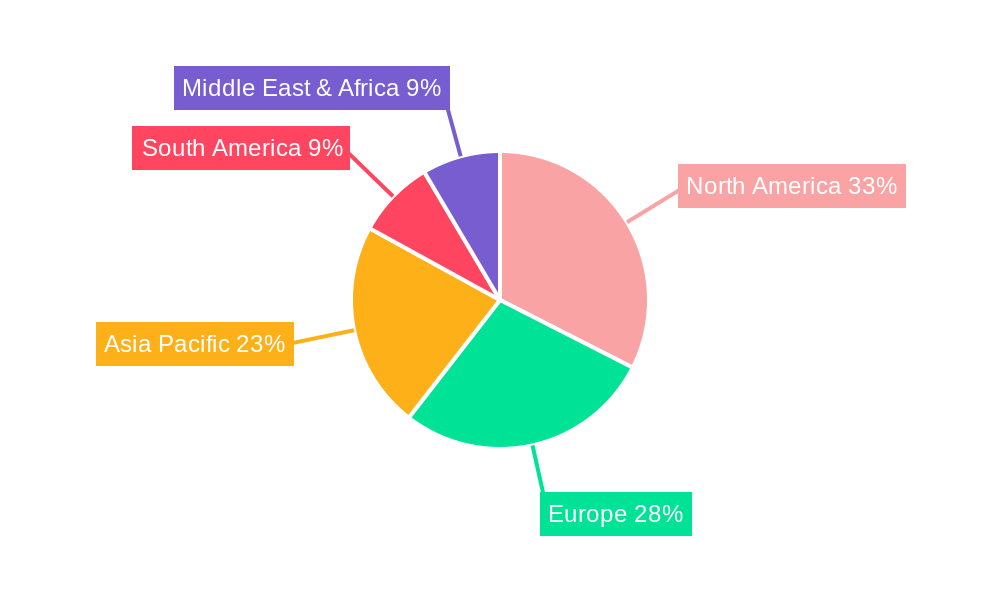
Topical Anesthetics for Skin Regional Market Share
Geographic Coverage of Topical Anesthetics for Skin
Topical Anesthetics for Skin REPORT HIGHLIGHTS
| Aspects | Details |
|---|---|
| Study Period | 2020-2034 |
| Base Year | 2025 |
| Estimated Year | 2026 |
| Forecast Period | 2026-2034 |
| Historical Period | 2020-2025 |
| Growth Rate | CAGR of 4.3% from 2020-2034 |
| Segmentation |
|
Table of Contents
- 1. Introduction
- 1.1. Research Scope
- 1.2. Market Segmentation
- 1.3. Research Methodology
- 1.4. Definitions and Assumptions
- 2. Executive Summary
- 2.1. Introduction
- 3. Market Dynamics
- 3.1. Introduction
- 3.2. Market Drivers
- 3.3. Market Restrains
- 3.4. Market Trends
- 4. Market Factor Analysis
- 4.1. Porters Five Forces
- 4.2. Supply/Value Chain
- 4.3. PESTEL analysis
- 4.4. Market Entropy
- 4.5. Patent/Trademark Analysis
- 5. Global Topical Anesthetics for Skin Analysis, Insights and Forecast, 2020-2032
- 5.1. Market Analysis, Insights and Forecast - by Application
- 5.1.1. Hospital
- 5.1.2. Clinic
- 5.1.3. Other
- 5.2. Market Analysis, Insights and Forecast - by Types
- 5.2.1. Lidocaine
- 5.2.2. Tetracaine
- 5.2.3. Other
- 5.3. Market Analysis, Insights and Forecast - by Region
- 5.3.1. North America
- 5.3.2. South America
- 5.3.3. Europe
- 5.3.4. Middle East & Africa
- 5.3.5. Asia Pacific
- 5.1. Market Analysis, Insights and Forecast - by Application
- 6. North America Topical Anesthetics for Skin Analysis, Insights and Forecast, 2020-2032
- 6.1. Market Analysis, Insights and Forecast - by Application
- 6.1.1. Hospital
- 6.1.2. Clinic
- 6.1.3. Other
- 6.2. Market Analysis, Insights and Forecast - by Types
- 6.2.1. Lidocaine
- 6.2.2. Tetracaine
- 6.2.3. Other
- 6.1. Market Analysis, Insights and Forecast - by Application
- 7. South America Topical Anesthetics for Skin Analysis, Insights and Forecast, 2020-2032
- 7.1. Market Analysis, Insights and Forecast - by Application
- 7.1.1. Hospital
- 7.1.2. Clinic
- 7.1.3. Other
- 7.2. Market Analysis, Insights and Forecast - by Types
- 7.2.1. Lidocaine
- 7.2.2. Tetracaine
- 7.2.3. Other
- 7.1. Market Analysis, Insights and Forecast - by Application
- 8. Europe Topical Anesthetics for Skin Analysis, Insights and Forecast, 2020-2032
- 8.1. Market Analysis, Insights and Forecast - by Application
- 8.1.1. Hospital
- 8.1.2. Clinic
- 8.1.3. Other
- 8.2. Market Analysis, Insights and Forecast - by Types
- 8.2.1. Lidocaine
- 8.2.2. Tetracaine
- 8.2.3. Other
- 8.1. Market Analysis, Insights and Forecast - by Application
- 9. Middle East & Africa Topical Anesthetics for Skin Analysis, Insights and Forecast, 2020-2032
- 9.1. Market Analysis, Insights and Forecast - by Application
- 9.1.1. Hospital
- 9.1.2. Clinic
- 9.1.3. Other
- 9.2. Market Analysis, Insights and Forecast - by Types
- 9.2.1. Lidocaine
- 9.2.2. Tetracaine
- 9.2.3. Other
- 9.1. Market Analysis, Insights and Forecast - by Application
- 10. Asia Pacific Topical Anesthetics for Skin Analysis, Insights and Forecast, 2020-2032
- 10.1. Market Analysis, Insights and Forecast - by Application
- 10.1.1. Hospital
- 10.1.2. Clinic
- 10.1.3. Other
- 10.2. Market Analysis, Insights and Forecast - by Types
- 10.2.1. Lidocaine
- 10.2.2. Tetracaine
- 10.2.3. Other
- 10.1. Market Analysis, Insights and Forecast - by Application
- 11. Competitive Analysis
- 11.1. Global Market Share Analysis 2025
- 11.2. Company Profiles
- 11.2.1 Tongfang Pharma
- 11.2.1.1. Overview
- 11.2.1.2. Products
- 11.2.1.3. SWOT Analysis
- 11.2.1.4. Recent Developments
- 11.2.1.5. Financials (Based on Availability)
- 11.2.2 Aspen Group Ltd
- 11.2.2.1. Overview
- 11.2.2.2. Products
- 11.2.2.3. SWOT Analysis
- 11.2.2.4. Recent Developments
- 11.2.2.5. Financials (Based on Availability)
- 11.2.3 Lvzhou Pharma
- 11.2.3.1. Overview
- 11.2.3.2. Products
- 11.2.3.3. SWOT Analysis
- 11.2.3.4. Recent Developments
- 11.2.3.5. Financials (Based on Availability)
- 11.2.4 Lijunjinghua Pharma
- 11.2.4.1. Overview
- 11.2.4.2. Products
- 11.2.4.3. SWOT Analysis
- 11.2.4.4. Recent Developments
- 11.2.4.5. Financials (Based on Availability)
- 11.2.5 Zhenao Honeysuckle Pharmaceutical
- 11.2.5.1. Overview
- 11.2.5.2. Products
- 11.2.5.3. SWOT Analysis
- 11.2.5.4. Recent Developments
- 11.2.5.5. Financials (Based on Availability)
- 11.2.6 Amphastar Pharmaceuticals Inc
- 11.2.6.1. Overview
- 11.2.6.2. Products
- 11.2.6.3. SWOT Analysis
- 11.2.6.4. Recent Developments
- 11.2.6.5. Financials (Based on Availability)
- 11.2.7 Viatris Inc
- 11.2.7.1. Overview
- 11.2.7.2. Products
- 11.2.7.3. SWOT Analysis
- 11.2.7.4. Recent Developments
- 11.2.7.5. Financials (Based on Availability)
- 11.2.8 Huarun Zizhu
- 11.2.8.1. Overview
- 11.2.8.2. Products
- 11.2.8.3. SWOT Analysis
- 11.2.8.4. Recent Developments
- 11.2.8.5. Financials (Based on Availability)
- 11.2.9 PADAGIS
- 11.2.9.1. Overview
- 11.2.9.2. Products
- 11.2.9.3. SWOT Analysis
- 11.2.9.4. Recent Developments
- 11.2.9.5. Financials (Based on Availability)
- 11.2.10 Hikma Pharmaceuticals Co Ltd
- 11.2.10.1. Overview
- 11.2.10.2. Products
- 11.2.10.3. SWOT Analysis
- 11.2.10.4. Recent Developments
- 11.2.10.5. Financials (Based on Availability)
- 11.2.11 MECP
- 11.2.11.1. Overview
- 11.2.11.2. Products
- 11.2.11.3. SWOT Analysis
- 11.2.11.4. Recent Developments
- 11.2.11.5. Financials (Based on Availability)
- 11.2.12 SATO SEIYAKU
- 11.2.12.1. Overview
- 11.2.12.2. Products
- 11.2.12.3. SWOT Analysis
- 11.2.12.4. Recent Developments
- 11.2.12.5. Financials (Based on Availability)
- 11.2.13 KADE
- 11.2.13.1. Overview
- 11.2.13.2. Products
- 11.2.13.3. SWOT Analysis
- 11.2.13.4. Recent Developments
- 11.2.13.5. Financials (Based on Availability)
- 11.2.1 Tongfang Pharma
List of Figures
- Figure 1: Global Topical Anesthetics for Skin Revenue Breakdown (million, %) by Region 2025 & 2033
- Figure 2: Global Topical Anesthetics for Skin Volume Breakdown (K, %) by Region 2025 & 2033
- Figure 3: North America Topical Anesthetics for Skin Revenue (million), by Application 2025 & 2033
- Figure 4: North America Topical Anesthetics for Skin Volume (K), by Application 2025 & 2033
- Figure 5: North America Topical Anesthetics for Skin Revenue Share (%), by Application 2025 & 2033
- Figure 6: North America Topical Anesthetics for Skin Volume Share (%), by Application 2025 & 2033
- Figure 7: North America Topical Anesthetics for Skin Revenue (million), by Types 2025 & 2033
- Figure 8: North America Topical Anesthetics for Skin Volume (K), by Types 2025 & 2033
- Figure 9: North America Topical Anesthetics for Skin Revenue Share (%), by Types 2025 & 2033
- Figure 10: North America Topical Anesthetics for Skin Volume Share (%), by Types 2025 & 2033
- Figure 11: North America Topical Anesthetics for Skin Revenue (million), by Country 2025 & 2033
- Figure 12: North America Topical Anesthetics for Skin Volume (K), by Country 2025 & 2033
- Figure 13: North America Topical Anesthetics for Skin Revenue Share (%), by Country 2025 & 2033
- Figure 14: North America Topical Anesthetics for Skin Volume Share (%), by Country 2025 & 2033
- Figure 15: South America Topical Anesthetics for Skin Revenue (million), by Application 2025 & 2033
- Figure 16: South America Topical Anesthetics for Skin Volume (K), by Application 2025 & 2033
- Figure 17: South America Topical Anesthetics for Skin Revenue Share (%), by Application 2025 & 2033
- Figure 18: South America Topical Anesthetics for Skin Volume Share (%), by Application 2025 & 2033
- Figure 19: South America Topical Anesthetics for Skin Revenue (million), by Types 2025 & 2033
- Figure 20: South America Topical Anesthetics for Skin Volume (K), by Types 2025 & 2033
- Figure 21: South America Topical Anesthetics for Skin Revenue Share (%), by Types 2025 & 2033
- Figure 22: South America Topical Anesthetics for Skin Volume Share (%), by Types 2025 & 2033
- Figure 23: South America Topical Anesthetics for Skin Revenue (million), by Country 2025 & 2033
- Figure 24: South America Topical Anesthetics for Skin Volume (K), by Country 2025 & 2033
- Figure 25: South America Topical Anesthetics for Skin Revenue Share (%), by Country 2025 & 2033
- Figure 26: South America Topical Anesthetics for Skin Volume Share (%), by Country 2025 & 2033
- Figure 27: Europe Topical Anesthetics for Skin Revenue (million), by Application 2025 & 2033
- Figure 28: Europe Topical Anesthetics for Skin Volume (K), by Application 2025 & 2033
- Figure 29: Europe Topical Anesthetics for Skin Revenue Share (%), by Application 2025 & 2033
- Figure 30: Europe Topical Anesthetics for Skin Volume Share (%), by Application 2025 & 2033
- Figure 31: Europe Topical Anesthetics for Skin Revenue (million), by Types 2025 & 2033
- Figure 32: Europe Topical Anesthetics for Skin Volume (K), by Types 2025 & 2033
- Figure 33: Europe Topical Anesthetics for Skin Revenue Share (%), by Types 2025 & 2033
- Figure 34: Europe Topical Anesthetics for Skin Volume Share (%), by Types 2025 & 2033
- Figure 35: Europe Topical Anesthetics for Skin Revenue (million), by Country 2025 & 2033
- Figure 36: Europe Topical Anesthetics for Skin Volume (K), by Country 2025 & 2033
- Figure 37: Europe Topical Anesthetics for Skin Revenue Share (%), by Country 2025 & 2033
- Figure 38: Europe Topical Anesthetics for Skin Volume Share (%), by Country 2025 & 2033
- Figure 39: Middle East & Africa Topical Anesthetics for Skin Revenue (million), by Application 2025 & 2033
- Figure 40: Middle East & Africa Topical Anesthetics for Skin Volume (K), by Application 2025 & 2033
- Figure 41: Middle East & Africa Topical Anesthetics for Skin Revenue Share (%), by Application 2025 & 2033
- Figure 42: Middle East & Africa Topical Anesthetics for Skin Volume Share (%), by Application 2025 & 2033
- Figure 43: Middle East & Africa Topical Anesthetics for Skin Revenue (million), by Types 2025 & 2033
- Figure 44: Middle East & Africa Topical Anesthetics for Skin Volume (K), by Types 2025 & 2033
- Figure 45: Middle East & Africa Topical Anesthetics for Skin Revenue Share (%), by Types 2025 & 2033
- Figure 46: Middle East & Africa Topical Anesthetics for Skin Volume Share (%), by Types 2025 & 2033
- Figure 47: Middle East & Africa Topical Anesthetics for Skin Revenue (million), by Country 2025 & 2033
- Figure 48: Middle East & Africa Topical Anesthetics for Skin Volume (K), by Country 2025 & 2033
- Figure 49: Middle East & Africa Topical Anesthetics for Skin Revenue Share (%), by Country 2025 & 2033
- Figure 50: Middle East & Africa Topical Anesthetics for Skin Volume Share (%), by Country 2025 & 2033
- Figure 51: Asia Pacific Topical Anesthetics for Skin Revenue (million), by Application 2025 & 2033
- Figure 52: Asia Pacific Topical Anesthetics for Skin Volume (K), by Application 2025 & 2033
- Figure 53: Asia Pacific Topical Anesthetics for Skin Revenue Share (%), by Application 2025 & 2033
- Figure 54: Asia Pacific Topical Anesthetics for Skin Volume Share (%), by Application 2025 & 2033
- Figure 55: Asia Pacific Topical Anesthetics for Skin Revenue (million), by Types 2025 & 2033
- Figure 56: Asia Pacific Topical Anesthetics for Skin Volume (K), by Types 2025 & 2033
- Figure 57: Asia Pacific Topical Anesthetics for Skin Revenue Share (%), by Types 2025 & 2033
- Figure 58: Asia Pacific Topical Anesthetics for Skin Volume Share (%), by Types 2025 & 2033
- Figure 59: Asia Pacific Topical Anesthetics for Skin Revenue (million), by Country 2025 & 2033
- Figure 60: Asia Pacific Topical Anesthetics for Skin Volume (K), by Country 2025 & 2033
- Figure 61: Asia Pacific Topical Anesthetics for Skin Revenue Share (%), by Country 2025 & 2033
- Figure 62: Asia Pacific Topical Anesthetics for Skin Volume Share (%), by Country 2025 & 2033
List of Tables
- Table 1: Global Topical Anesthetics for Skin Revenue million Forecast, by Application 2020 & 2033
- Table 2: Global Topical Anesthetics for Skin Volume K Forecast, by Application 2020 & 2033
- Table 3: Global Topical Anesthetics for Skin Revenue million Forecast, by Types 2020 & 2033
- Table 4: Global Topical Anesthetics for Skin Volume K Forecast, by Types 2020 & 2033
- Table 5: Global Topical Anesthetics for Skin Revenue million Forecast, by Region 2020 & 2033
- Table 6: Global Topical Anesthetics for Skin Volume K Forecast, by Region 2020 & 2033
- Table 7: Global Topical Anesthetics for Skin Revenue million Forecast, by Application 2020 & 2033
- Table 8: Global Topical Anesthetics for Skin Volume K Forecast, by Application 2020 & 2033
- Table 9: Global Topical Anesthetics for Skin Revenue million Forecast, by Types 2020 & 2033
- Table 10: Global Topical Anesthetics for Skin Volume K Forecast, by Types 2020 & 2033
- Table 11: Global Topical Anesthetics for Skin Revenue million Forecast, by Country 2020 & 2033
- Table 12: Global Topical Anesthetics for Skin Volume K Forecast, by Country 2020 & 2033
- Table 13: United States Topical Anesthetics for Skin Revenue (million) Forecast, by Application 2020 & 2033
- Table 14: United States Topical Anesthetics for Skin Volume (K) Forecast, by Application 2020 & 2033
- Table 15: Canada Topical Anesthetics for Skin Revenue (million) Forecast, by Application 2020 & 2033
- Table 16: Canada Topical Anesthetics for Skin Volume (K) Forecast, by Application 2020 & 2033
- Table 17: Mexico Topical Anesthetics for Skin Revenue (million) Forecast, by Application 2020 & 2033
- Table 18: Mexico Topical Anesthetics for Skin Volume (K) Forecast, by Application 2020 & 2033
- Table 19: Global Topical Anesthetics for Skin Revenue million Forecast, by Application 2020 & 2033
- Table 20: Global Topical Anesthetics for Skin Volume K Forecast, by Application 2020 & 2033
- Table 21: Global Topical Anesthetics for Skin Revenue million Forecast, by Types 2020 & 2033
- Table 22: Global Topical Anesthetics for Skin Volume K Forecast, by Types 2020 & 2033
- Table 23: Global Topical Anesthetics for Skin Revenue million Forecast, by Country 2020 & 2033
- Table 24: Global Topical Anesthetics for Skin Volume K Forecast, by Country 2020 & 2033
- Table 25: Brazil Topical Anesthetics for Skin Revenue (million) Forecast, by Application 2020 & 2033
- Table 26: Brazil Topical Anesthetics for Skin Volume (K) Forecast, by Application 2020 & 2033
- Table 27: Argentina Topical Anesthetics for Skin Revenue (million) Forecast, by Application 2020 & 2033
- Table 28: Argentina Topical Anesthetics for Skin Volume (K) Forecast, by Application 2020 & 2033
- Table 29: Rest of South America Topical Anesthetics for Skin Revenue (million) Forecast, by Application 2020 & 2033
- Table 30: Rest of South America Topical Anesthetics for Skin Volume (K) Forecast, by Application 2020 & 2033
- Table 31: Global Topical Anesthetics for Skin Revenue million Forecast, by Application 2020 & 2033
- Table 32: Global Topical Anesthetics for Skin Volume K Forecast, by Application 2020 & 2033
- Table 33: Global Topical Anesthetics for Skin Revenue million Forecast, by Types 2020 & 2033
- Table 34: Global Topical Anesthetics for Skin Volume K Forecast, by Types 2020 & 2033
- Table 35: Global Topical Anesthetics for Skin Revenue million Forecast, by Country 2020 & 2033
- Table 36: Global Topical Anesthetics for Skin Volume K Forecast, by Country 2020 & 2033
- Table 37: United Kingdom Topical Anesthetics for Skin Revenue (million) Forecast, by Application 2020 & 2033
- Table 38: United Kingdom Topical Anesthetics for Skin Volume (K) Forecast, by Application 2020 & 2033
- Table 39: Germany Topical Anesthetics for Skin Revenue (million) Forecast, by Application 2020 & 2033
- Table 40: Germany Topical Anesthetics for Skin Volume (K) Forecast, by Application 2020 & 2033
- Table 41: France Topical Anesthetics for Skin Revenue (million) Forecast, by Application 2020 & 2033
- Table 42: France Topical Anesthetics for Skin Volume (K) Forecast, by Application 2020 & 2033
- Table 43: Italy Topical Anesthetics for Skin Revenue (million) Forecast, by Application 2020 & 2033
- Table 44: Italy Topical Anesthetics for Skin Volume (K) Forecast, by Application 2020 & 2033
- Table 45: Spain Topical Anesthetics for Skin Revenue (million) Forecast, by Application 2020 & 2033
- Table 46: Spain Topical Anesthetics for Skin Volume (K) Forecast, by Application 2020 & 2033
- Table 47: Russia Topical Anesthetics for Skin Revenue (million) Forecast, by Application 2020 & 2033
- Table 48: Russia Topical Anesthetics for Skin Volume (K) Forecast, by Application 2020 & 2033
- Table 49: Benelux Topical Anesthetics for Skin Revenue (million) Forecast, by Application 2020 & 2033
- Table 50: Benelux Topical Anesthetics for Skin Volume (K) Forecast, by Application 2020 & 2033
- Table 51: Nordics Topical Anesthetics for Skin Revenue (million) Forecast, by Application 2020 & 2033
- Table 52: Nordics Topical Anesthetics for Skin Volume (K) Forecast, by Application 2020 & 2033
- Table 53: Rest of Europe Topical Anesthetics for Skin Revenue (million) Forecast, by Application 2020 & 2033
- Table 54: Rest of Europe Topical Anesthetics for Skin Volume (K) Forecast, by Application 2020 & 2033
- Table 55: Global Topical Anesthetics for Skin Revenue million Forecast, by Application 2020 & 2033
- Table 56: Global Topical Anesthetics for Skin Volume K Forecast, by Application 2020 & 2033
- Table 57: Global Topical Anesthetics for Skin Revenue million Forecast, by Types 2020 & 2033
- Table 58: Global Topical Anesthetics for Skin Volume K Forecast, by Types 2020 & 2033
- Table 59: Global Topical Anesthetics for Skin Revenue million Forecast, by Country 2020 & 2033
- Table 60: Global Topical Anesthetics for Skin Volume K Forecast, by Country 2020 & 2033
- Table 61: Turkey Topical Anesthetics for Skin Revenue (million) Forecast, by Application 2020 & 2033
- Table 62: Turkey Topical Anesthetics for Skin Volume (K) Forecast, by Application 2020 & 2033
- Table 63: Israel Topical Anesthetics for Skin Revenue (million) Forecast, by Application 2020 & 2033
- Table 64: Israel Topical Anesthetics for Skin Volume (K) Forecast, by Application 2020 & 2033
- Table 65: GCC Topical Anesthetics for Skin Revenue (million) Forecast, by Application 2020 & 2033
- Table 66: GCC Topical Anesthetics for Skin Volume (K) Forecast, by Application 2020 & 2033
- Table 67: North Africa Topical Anesthetics for Skin Revenue (million) Forecast, by Application 2020 & 2033
- Table 68: North Africa Topical Anesthetics for Skin Volume (K) Forecast, by Application 2020 & 2033
- Table 69: South Africa Topical Anesthetics for Skin Revenue (million) Forecast, by Application 2020 & 2033
- Table 70: South Africa Topical Anesthetics for Skin Volume (K) Forecast, by Application 2020 & 2033
- Table 71: Rest of Middle East & Africa Topical Anesthetics for Skin Revenue (million) Forecast, by Application 2020 & 2033
- Table 72: Rest of Middle East & Africa Topical Anesthetics for Skin Volume (K) Forecast, by Application 2020 & 2033
- Table 73: Global Topical Anesthetics for Skin Revenue million Forecast, by Application 2020 & 2033
- Table 74: Global Topical Anesthetics for Skin Volume K Forecast, by Application 2020 & 2033
- Table 75: Global Topical Anesthetics for Skin Revenue million Forecast, by Types 2020 & 2033
- Table 76: Global Topical Anesthetics for Skin Volume K Forecast, by Types 2020 & 2033
- Table 77: Global Topical Anesthetics for Skin Revenue million Forecast, by Country 2020 & 2033
- Table 78: Global Topical Anesthetics for Skin Volume K Forecast, by Country 2020 & 2033
- Table 79: China Topical Anesthetics for Skin Revenue (million) Forecast, by Application 2020 & 2033
- Table 80: China Topical Anesthetics for Skin Volume (K) Forecast, by Application 2020 & 2033
- Table 81: India Topical Anesthetics for Skin Revenue (million) Forecast, by Application 2020 & 2033
- Table 82: India Topical Anesthetics for Skin Volume (K) Forecast, by Application 2020 & 2033
- Table 83: Japan Topical Anesthetics for Skin Revenue (million) Forecast, by Application 2020 & 2033
- Table 84: Japan Topical Anesthetics for Skin Volume (K) Forecast, by Application 2020 & 2033
- Table 85: South Korea Topical Anesthetics for Skin Revenue (million) Forecast, by Application 2020 & 2033
- Table 86: South Korea Topical Anesthetics for Skin Volume (K) Forecast, by Application 2020 & 2033
- Table 87: ASEAN Topical Anesthetics for Skin Revenue (million) Forecast, by Application 2020 & 2033
- Table 88: ASEAN Topical Anesthetics for Skin Volume (K) Forecast, by Application 2020 & 2033
- Table 89: Oceania Topical Anesthetics for Skin Revenue (million) Forecast, by Application 2020 & 2033
- Table 90: Oceania Topical Anesthetics for Skin Volume (K) Forecast, by Application 2020 & 2033
- Table 91: Rest of Asia Pacific Topical Anesthetics for Skin Revenue (million) Forecast, by Application 2020 & 2033
- Table 92: Rest of Asia Pacific Topical Anesthetics for Skin Volume (K) Forecast, by Application 2020 & 2033
Frequently Asked Questions
1. What is the projected Compound Annual Growth Rate (CAGR) of the Topical Anesthetics for Skin?
The projected CAGR is approximately 4.3%.
2. Which companies are prominent players in the Topical Anesthetics for Skin?
Key companies in the market include Tongfang Pharma, Aspen Group Ltd, Lvzhou Pharma, Lijunjinghua Pharma, Zhenao Honeysuckle Pharmaceutical, Amphastar Pharmaceuticals Inc, Viatris Inc, Huarun Zizhu, PADAGIS, Hikma Pharmaceuticals Co Ltd, MECP, SATO SEIYAKU, KADE.
3. What are the main segments of the Topical Anesthetics for Skin?
The market segments include Application, Types.
4. Can you provide details about the market size?
The market size is estimated to be USD 724 million as of 2022.
5. What are some drivers contributing to market growth?
N/A
6. What are the notable trends driving market growth?
N/A
7. Are there any restraints impacting market growth?
N/A
8. Can you provide examples of recent developments in the market?
N/A
9. What pricing options are available for accessing the report?
Pricing options include single-user, multi-user, and enterprise licenses priced at USD 3950.00, USD 5925.00, and USD 7900.00 respectively.
10. Is the market size provided in terms of value or volume?
The market size is provided in terms of value, measured in million and volume, measured in K.
11. Are there any specific market keywords associated with the report?
Yes, the market keyword associated with the report is "Topical Anesthetics for Skin," which aids in identifying and referencing the specific market segment covered.
12. How do I determine which pricing option suits my needs best?
The pricing options vary based on user requirements and access needs. Individual users may opt for single-user licenses, while businesses requiring broader access may choose multi-user or enterprise licenses for cost-effective access to the report.
13. Are there any additional resources or data provided in the Topical Anesthetics for Skin report?
While the report offers comprehensive insights, it's advisable to review the specific contents or supplementary materials provided to ascertain if additional resources or data are available.
14. How can I stay updated on further developments or reports in the Topical Anesthetics for Skin?
To stay informed about further developments, trends, and reports in the Topical Anesthetics for Skin, consider subscribing to industry newsletters, following relevant companies and organizations, or regularly checking reputable industry news sources and publications.
Methodology
Step 1 - Identification of Relevant Samples Size from Population Database


Step 2 - Approaches for Defining Global Market Size (Value, Volume* & Price*)

Note*: In applicable scenarios
Step 3 - Data Sources
Primary Research
- Web Analytics
- Survey Reports
- Research Institute
- Latest Research Reports
- Opinion Leaders
Secondary Research
- Annual Reports
- White Paper
- Latest Press Release
- Industry Association
- Paid Database
- Investor Presentations

Step 4 - Data Triangulation
Involves using different sources of information in order to increase the validity of a study
These sources are likely to be stakeholders in a program - participants, other researchers, program staff, other community members, and so on.
Then we put all data in single framework & apply various statistical tools to find out the dynamic on the market.
During the analysis stage, feedback from the stakeholder groups would be compared to determine areas of agreement as well as areas of divergence
