

Key Insights
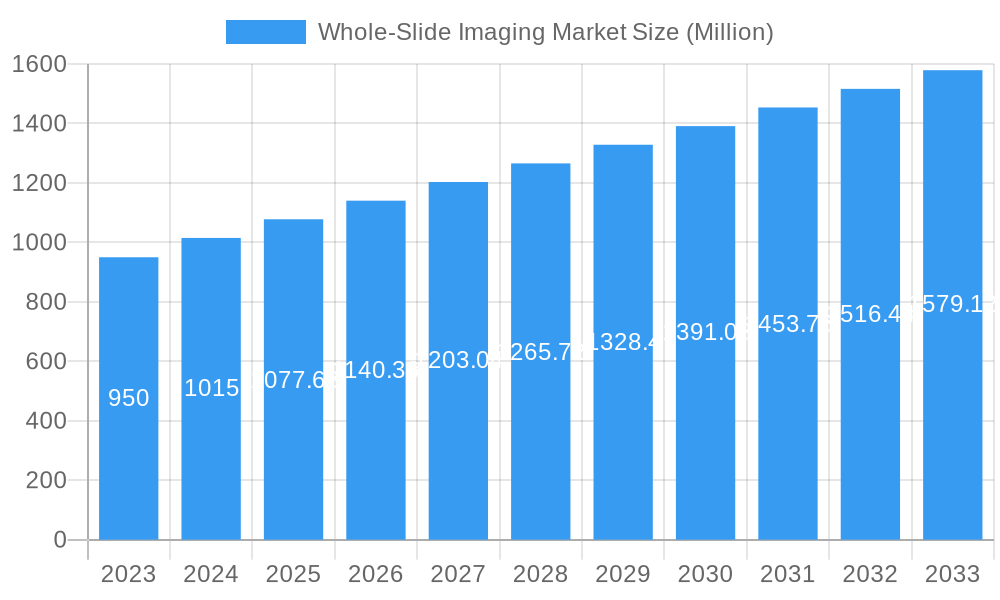
The Whole-Slide Imaging (WSI) market is poised for significant expansion, projected to reach $1.21 Billion by 2025, with a robust Compound Annual Growth Rate (CAGR) of 6.39% through 2033. This growth is primarily fueled by the increasing demand for digitized pathology workflows, enhanced diagnostic accuracy, and the growing adoption of artificial intelligence (AI) and machine learning (ML) in medical imaging. The technological advancements in scanners, IT infrastructure, and sophisticated image management systems are critical enablers, facilitating seamless integration and analysis of whole slide images. The application segment is witnessing substantial traction, particularly in telepathology, driven by the need for remote consultations and expert opinions, and in cytopathology and hematopathology, where detailed cellular analysis is paramount. Immunohistochemistry also represents a key application area, benefiting from the precision and consistency offered by WSI.
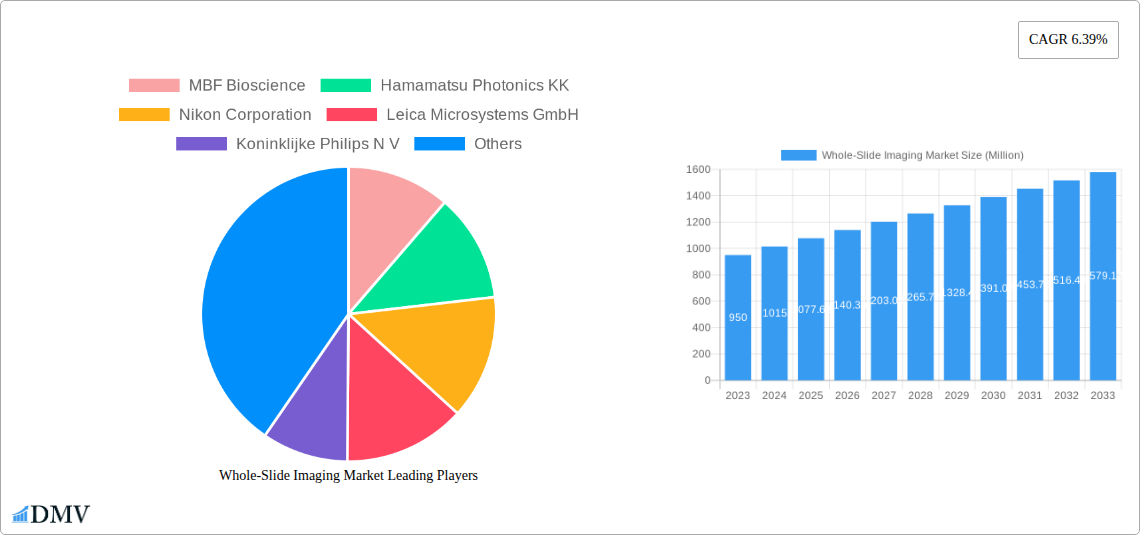
Whole-Slide Imaging Market Market Size (In Million)
The market's expansion is further supported by increasing investments in advanced healthcare infrastructure by academic institutions and research organizations, recognizing the transformative potential of WSI in accelerating drug discovery, clinical trials, and personalized medicine. While the market exhibits strong growth drivers, certain restraints like the high initial investment for WSI systems and the need for extensive training and skilled personnel can pose challenges. However, the long-term outlook remains exceptionally positive, with ongoing innovations in WSI technology and its integration with digital pathology solutions expected to overcome these hurdles. The global WSI market is characterized by a competitive landscape with key players like MBF Bioscience, Hamamatsu Photonics KK, and Nikon Corporation continually innovating to capture market share. Geographically, North America and Europe are expected to lead the market in the coming years due to well-established healthcare systems and early adoption of advanced imaging technologies, followed closely by the Asia Pacific region, which presents a rapidly growing opportunity.
Whole-Slide Imaging Market Company Market Share
Gain an unparalleled understanding of the dynamic Whole-Slide Imaging Market with this in-depth report. Covering the period from 2019 to 2033, with a base year of 2025 and a comprehensive forecast period of 2025–2033, this analysis delves into market composition, industry evolution, regional dominance, product innovations, growth drivers, obstacles, and future opportunities. Essential for stakeholders, researchers, and decision-makers, this report provides actionable insights into the digital pathology revolution. The global Whole-Slide Imaging Market is projected to reach $XX Million by 2033, exhibiting a robust CAGR of XX% during the forecast period.
Whole-Slide Imaging Market Market Composition & Trends
The Whole-Slide Imaging Market is characterized by a dynamic landscape with a moderate to high degree of concentration, driven by continuous innovation and strategic acquisitions. Key players are investing heavily in research and development to enhance scanner resolution, speed, and AI-driven analysis capabilities, thereby fueling market growth. Regulatory bodies are gradually streamlining approvals for digital pathology solutions, paving the way for wider adoption in diagnostic settings. Substitute products, such as traditional microscopy, are facing increasing pressure from the efficiency and data management benefits offered by WSI. End-user profiles are diversifying, with academic institutions and research laboratories leading adoption, followed by an expanding segment of clinical diagnostic centers. Mergers and acquisitions are a significant trend, with deal values in the range of $XX Million to $XX Million seen in recent years, aimed at consolidating market share and expanding product portfolios.
- Market Concentration: Dominated by a few key players, but with emerging innovators contributing to a competitive ecosystem.
- Innovation Catalysts: Advancements in AI for image analysis, increased scanner throughput, and cloud-based data management solutions.
- Regulatory Landscapes: Evolving approval processes for digital pathology tools, impacting market entry and adoption timelines.
- Substitute Products: Traditional microscopy, facing obsolescence due to the superior data handling and accessibility of WSI.
- End-User Profiles: Academic & Research Institutions (XX% share), Clinical Laboratories (XX% share), Pharmaceutical & Biotechnology Companies (XX% share), Others (XX% share).
- M&A Activities: Strategic acquisitions and partnerships to enhance technological capabilities and market reach, with average deal values around $XX Million.
Whole-Slide Imaging Market Industry Evolution
The Whole-Slide Imaging Market has witnessed a remarkable evolution, driven by the transformative power of digital pathology. From its nascent stages, the industry has progressed towards sophisticated, AI-integrated solutions that are revolutionizing diagnostics and research. The market growth trajectory has been consistently upward, propelled by the increasing demand for faster, more accurate, and accessible pathological analysis. Technological advancements have been at the forefront of this evolution, with scanners achieving higher resolutions, faster scanning speeds, and improved color fidelity. The development of robust IT infrastructure, including secure cloud storage and efficient image management systems, has been crucial in handling the massive datasets generated by whole slide images. Shifting consumer demands, particularly from the healthcare sector, have emphasized the need for improved workflow efficiencies, remote diagnostic capabilities, and enhanced collaboration among pathologists. Adoption metrics show a significant increase in the number of labs transitioning to digital workflows, with an estimated XX% adoption rate in leading research institutions and a steady rise in clinical settings. The market is projected to grow at a Compound Annual Growth Rate (CAGR) of XX% during the historical period (2019-2024) and is expected to maintain this momentum through the forecast period.
The transition from glass slides to digital images has unlocked unprecedented opportunities in areas like telepathology, enabling remote consultations and expert opinions, thereby democratizing access to specialized pathology services. Cytopathology and Immunohistochemistry applications are particularly benefiting from WSI's quantitative analysis capabilities, allowing for more precise grading and biomarker assessment. Hematopathology has also seen significant advancements with the application of AI algorithms for automated cell counting and classification. The increasing volume of data generated by WSI necessitates sophisticated Image Management Systems (IMS) and robust IT Infrastructure, leading to significant investments in these segments. The demand for advanced Viewer software that allows for intuitive navigation and annotation of large WSI files further underscores the technological sophistication of the market.
Leading Regions, Countries, or Segments in Whole-Slide Imaging Market
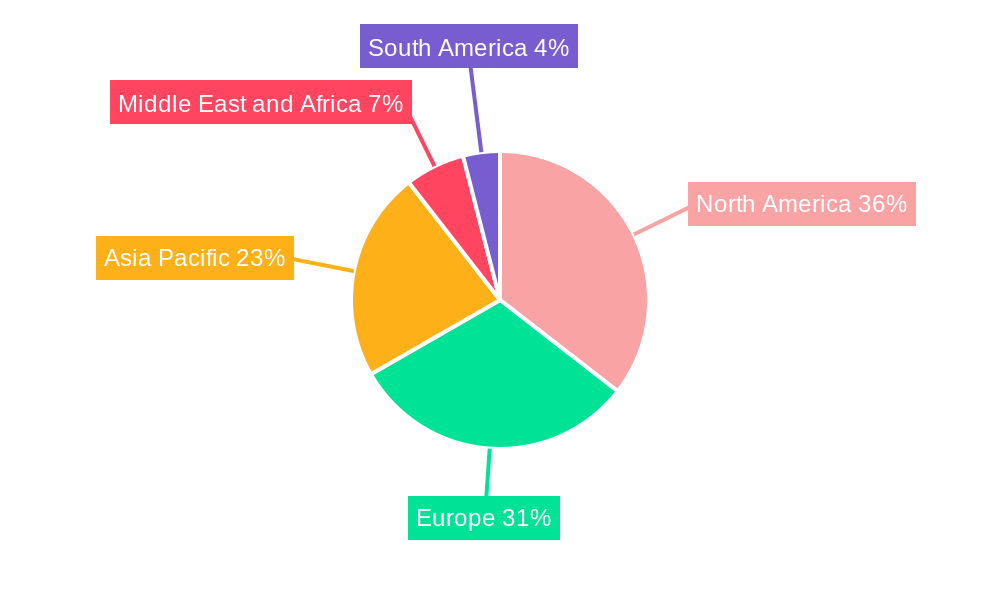
North America currently dominates the Whole-Slide Imaging Market, driven by substantial investments in healthcare infrastructure, a high prevalence of chronic diseases requiring pathological diagnosis, and a strong presence of leading research institutions and pharmaceutical companies. The United States, in particular, is a key contributor due to its advanced healthcare system and proactive adoption of innovative technologies. Furthermore, stringent regulatory frameworks, while posing initial challenges, have also fostered the development of high-quality, compliant digital pathology solutions.
- Dominant Region: North America (XX% Market Share)
- Key Drivers in North America:
- Investment Trends: Significant funding from government agencies and private investors in digital health and AI-driven diagnostics.
- Regulatory Support: FDA's evolving guidelines for digital pathology aiding market access.
- Academic & Research Excellence: Leading universities and research centers driving innovation and adoption.
- Healthcare Expenditure: High per capita healthcare spending facilitating technology adoption.
- Key Drivers in North America:
The Scanners segment is a primary driver of market growth within the technology domain, with continuous innovation in resolution, speed, and throughput. Companies are developing scanners capable of high-volume throughput to meet the demands of large pathology departments.
- Technology Segment Dominance: Scanners (XX% Market Share)
- Key Drivers: Need for rapid and high-resolution imaging, development of automated scanning processes, and integration with AI analysis software.
In terms of applications, Telepathology is experiencing rapid expansion due to its ability to facilitate remote consultations, improve turnaround times, and enhance access to specialist expertise, especially in underserved areas.
- Application Segment Dominance: Telepathology (XX% Market Share)
- Key Drivers: Increasing demand for remote diagnostics, collaboration among geographically dispersed medical professionals, and improved patient care accessibility.
Among end-users, Academic Institutes lead in WSI adoption due to their focus on research, education, and the exploration of new diagnostic methodologies.
- End User Segment Dominance: Academic Institute (XX% Market Share)
- Key Drivers: Emphasis on research and development, training future pathologists in digital workflows, and pioneering new applications of WSI.
Whole-Slide Imaging Market Product Innovations
The Whole-Slide Imaging Market is witnessing a surge in product innovations focused on enhancing diagnostic accuracy, efficiency, and workflow integration. Recent advancements include the development of AI-powered algorithms for automated tumor detection, grading, and biomarker quantification, significantly reducing pathologist workload and improving consistency. Novel scanning technologies offer faster acquisition times and higher pixel densities, capturing intricate cellular details with unprecedented clarity. Integration with cloud-based platforms facilitates seamless data sharing and collaborative analysis, enabling global access to pathology expertise. These innovations not only streamline diagnostic processes but also unlock new research avenues in precision medicine and drug discovery.
Propelling Factors for Whole-Slide Imaging Market Growth
The Whole-Slide Imaging Market is propelled by several key factors, including the growing demand for accurate and efficient diagnostic tools, the accelerating adoption of AI in healthcare for image analysis, and increasing government initiatives to promote digital health solutions. Technological advancements in scanner resolution and speed, coupled with the development of advanced image management systems, are enhancing the utility and accessibility of WSI. Furthermore, the rising incidence of chronic diseases and cancer worldwide necessitates faster and more reliable diagnostic methods, which WSI effectively addresses.
- Technological Advancements: High-resolution scanners, AI-powered analysis, cloud-based storage.
- Economic Influences: Cost-effectiveness of digital workflows in the long run, return on investment through improved efficiency.
- Regulatory Support: Evolving guidelines promoting digital pathology adoption.
- Disease Prevalence: Increasing global burden of cancer and other diseases requiring pathological diagnosis.
Obstacles in the Whole-Slide Imaging Market Market
Despite its immense potential, the Whole-Slide Imaging Market faces several obstacles. High initial investment costs for scanners and IT infrastructure can be a deterrent for smaller laboratories. Regulatory hurdles and the need for robust data security and privacy protocols also pose challenges. Interoperability issues between different software and hardware systems can hinder seamless integration into existing laboratory workflows. Furthermore, the digital divide and the need for extensive training for pathologists to adapt to new digital tools are significant barriers to widespread adoption.
- Regulatory Challenges: Navigating complex approval processes for digital pathology devices and software.
- Supply Chain Disruptions: Potential for bottlenecks in the availability of specialized components and scanners.
- Competitive Pressures: Intense competition among existing players and new entrants impacting pricing strategies.
- Implementation Costs: Significant upfront investment required for hardware, software, and IT infrastructure.
Future Opportunities in Whole-Slide Imaging Market
The future of the Whole-Slide Imaging Market is brimming with opportunities. The expanding integration of artificial intelligence for predictive diagnostics and personalized medicine presents a significant growth avenue. The increasing adoption of WSI in drug discovery and clinical trials, particularly in the pharmaceutical and biotechnology sectors, is expected to drive market expansion. Emerging economies, with their growing healthcare needs and increasing focus on digitalization, represent untapped markets. Furthermore, the development of integrated digital pathology platforms that encompass the entire workflow from slide scanning to reporting will create new opportunities for service providers and technology developers.
- New Markets: Expansion into emerging economies with growing healthcare needs.
- Technologies: Advancements in AI for predictive analytics and personalized medicine.
- Consumer Trends: Increased demand for remote diagnostics and collaborative pathology platforms.
- Application Expansion: Growing use in pharmaceutical R&D, clinical trials, and forensic pathology.
Major Players in the Whole-Slide Imaging Market Ecosystem
- MBF Bioscience
- Hamamatsu Photonics KK
- Nikon Corporation
- Leica Microsystems GmbH
- Koninklijke Philips N V
- 3Dhistech
- Visiopharm
- Indica Labs
- Molecular Machines & Industries
- Mikroscan Technologies Inc
- Olympus Corporation
- Akoya Biosciences
Key Developments in Whole-Slide Imaging Market Industry
- March 2023: Pramana, Inc., an AI-enabled health tech company modernizing the pathology sector, collaborated with PathPresenter to accelerate the enterprise adoption of digital pathology workflows. The goal of this collaboration is to ensure a seamless user experience for the labs adopting Pramana's Digital Pathology as a Service solution for whole slide image generation, as well as PathPresenter's image management/image viewing platform.
- March 2023: Hamamatsu, a manufacturer of photonics devices, including whole slide scanners for digital pathology, entered into a multi-year distribution agreement with Siemens Healthineers. Under the agreement, Hamamatsu is likely to provide NanoZoomer with whole slide scanners to support Siemens Healthineer's expansion into digital pathology in the Americas and Europe.
Strategic Whole-Slide Imaging Market Market Forecast
The Whole-Slide Imaging Market is poised for substantial growth, driven by the increasing demand for precision diagnostics and the accelerating integration of AI in pathology. Future opportunities lie in the expansion of WSI applications in drug discovery, personalized medicine, and emerging markets. Continued innovation in scanner technology and image analysis software will further enhance the value proposition of digital pathology. Strategic collaborations and partnerships will play a crucial role in market expansion, facilitating the development of integrated solutions and broader adoption. The market's growth catalysts are robust, indicating a promising future with significant potential for technological advancements and improved patient outcomes.
Whole-Slide Imaging Market Segmentation
-
1. Technology
- 1.1. Scanners
- 1.2. IT Infrastructure
- 1.3. Viewer
- 1.4. Image Management System
-
2. Application
- 2.1. Telepathology
- 2.2. Cytopathology
- 2.3. Immunohistochemistry
- 2.4. Hematopathology
-
3. End User
- 3.1. Academic Institute
- 3.2. Research
- 3.3. Others
Whole-Slide Imaging Market Segmentation By Geography
-
1. North America
- 1.1. United States
- 1.2. Canada
- 1.3. Mexico
-
2. Europe
- 2.1. Germany
- 2.2. United Kingdom
- 2.3. France
- 2.4. Italy
- 2.5. Spain
- 2.6. Rest of Europe
-
3. Asia Pacific
- 3.1. China
- 3.2. Japan
- 3.3. India
- 3.4. Australia
- 3.5. South korea
- 3.6. Rest of Asia Pacific
-
4. Middle East and Africa
- 4.1. GCC
- 4.2. South Africa
- 4.3. Rest of Middle East and Africa
-
5. South America
- 5.1. Brazil
- 5.2. Argentina
- 5.3. Rest of South America
Whole-Slide Imaging Market Regional Market Share
Geographic Coverage of Whole-Slide Imaging Market
Whole-Slide Imaging Market REPORT HIGHLIGHTS
| Aspects | Details |
|---|---|
| Study Period | 2020-2034 |
| Base Year | 2025 |
| Estimated Year | 2026 |
| Forecast Period | 2026-2034 |
| Historical Period | 2020-2025 |
| Growth Rate | CAGR of 6.39% from 2020-2034 |
| Segmentation |
|
Table of Contents
- 1. Introduction
- 1.1. Research Scope
- 1.2. Market Segmentation
- 1.3. Research Objective
- 1.4. Definitions and Assumptions
- 2. Executive Summary
- 2.1. Market Snapshot
- 3. Market Dynamics
- 3.1. Market Drivers
- 3.2. Market Restrains
- 3.3. Market Trends
- 3.4. Market Opportunities
- 4. Market Factor Analysis
- 4.1. Porters Five Forces
- 4.1.1. Bargaining Power of Suppliers
- 4.1.2. Bargaining Power of Buyers
- 4.1.3. Threat of New Entrants
- 4.1.4. Threat of Substitutes
- 4.1.5. Competitive Rivalry
- 4.2. PESTEL analysis
- 4.3. BCG Analysis
- 4.3.1. Stars (High Growth, High Market Share)
- 4.3.2. Cash Cows (Low Growth, High Market Share)
- 4.3.3. Question Mark (High Growth, Low Market Share)
- 4.3.4. Dogs (Low Growth, Low Market Share)
- 4.4. Ansoff Matrix Analysis
- 4.5. Supply Chain Analysis
- 4.6. Regulatory Landscape
- 4.7. Current Market Potential and Opportunity Assessment (TAM–SAM–SOM Framework)
- 4.8. DMV Analyst Note
- 4.1. Porters Five Forces
- 5. Market Analysis, Insights and Forecast 2021-2033
- 5.1. Market Analysis, Insights and Forecast - by Technology
- 5.1.1. Scanners
- 5.1.2. IT Infrastructure
- 5.1.3. Viewer
- 5.1.4. Image Management System
- 5.2. Market Analysis, Insights and Forecast - by Application
- 5.2.1. Telepathology
- 5.2.2. Cytopathology
- 5.2.3. Immunohistochemistry
- 5.2.4. Hematopathology
- 5.3. Market Analysis, Insights and Forecast - by End User
- 5.3.1. Academic Institute
- 5.3.2. Research
- 5.3.3. Others
- 5.4. Market Analysis, Insights and Forecast - by Region
- 5.4.1. North America
- 5.4.2. Europe
- 5.4.3. Asia Pacific
- 5.4.4. Middle East and Africa
- 5.4.5. South America
- 5.1. Market Analysis, Insights and Forecast - by Technology
- 6. Global Whole-Slide Imaging Market Analysis, Insights and Forecast, 2021-2033
- 6.1. Market Analysis, Insights and Forecast - by Technology
- 6.1.1. Scanners
- 6.1.2. IT Infrastructure
- 6.1.3. Viewer
- 6.1.4. Image Management System
- 6.2. Market Analysis, Insights and Forecast - by Application
- 6.2.1. Telepathology
- 6.2.2. Cytopathology
- 6.2.3. Immunohistochemistry
- 6.2.4. Hematopathology
- 6.3. Market Analysis, Insights and Forecast - by End User
- 6.3.1. Academic Institute
- 6.3.2. Research
- 6.3.3. Others
- 6.1. Market Analysis, Insights and Forecast - by Technology
- 7. North America Whole-Slide Imaging Market Analysis, Insights and Forecast, 2020-2032
- 7.1. Market Analysis, Insights and Forecast - by Technology
- 7.1.1. Scanners
- 7.1.2. IT Infrastructure
- 7.1.3. Viewer
- 7.1.4. Image Management System
- 7.2. Market Analysis, Insights and Forecast - by Application
- 7.2.1. Telepathology
- 7.2.2. Cytopathology
- 7.2.3. Immunohistochemistry
- 7.2.4. Hematopathology
- 7.3. Market Analysis, Insights and Forecast - by End User
- 7.3.1. Academic Institute
- 7.3.2. Research
- 7.3.3. Others
- 7.1. Market Analysis, Insights and Forecast - by Technology
- 8. Europe Whole-Slide Imaging Market Analysis, Insights and Forecast, 2020-2032
- 8.1. Market Analysis, Insights and Forecast - by Technology
- 8.1.1. Scanners
- 8.1.2. IT Infrastructure
- 8.1.3. Viewer
- 8.1.4. Image Management System
- 8.2. Market Analysis, Insights and Forecast - by Application
- 8.2.1. Telepathology
- 8.2.2. Cytopathology
- 8.2.3. Immunohistochemistry
- 8.2.4. Hematopathology
- 8.3. Market Analysis, Insights and Forecast - by End User
- 8.3.1. Academic Institute
- 8.3.2. Research
- 8.3.3. Others
- 8.1. Market Analysis, Insights and Forecast - by Technology
- 9. Asia Pacific Whole-Slide Imaging Market Analysis, Insights and Forecast, 2020-2032
- 9.1. Market Analysis, Insights and Forecast - by Technology
- 9.1.1. Scanners
- 9.1.2. IT Infrastructure
- 9.1.3. Viewer
- 9.1.4. Image Management System
- 9.2. Market Analysis, Insights and Forecast - by Application
- 9.2.1. Telepathology
- 9.2.2. Cytopathology
- 9.2.3. Immunohistochemistry
- 9.2.4. Hematopathology
- 9.3. Market Analysis, Insights and Forecast - by End User
- 9.3.1. Academic Institute
- 9.3.2. Research
- 9.3.3. Others
- 9.1. Market Analysis, Insights and Forecast - by Technology
- 10. Middle East and Africa Whole-Slide Imaging Market Analysis, Insights and Forecast, 2020-2032
- 10.1. Market Analysis, Insights and Forecast - by Technology
- 10.1.1. Scanners
- 10.1.2. IT Infrastructure
- 10.1.3. Viewer
- 10.1.4. Image Management System
- 10.2. Market Analysis, Insights and Forecast - by Application
- 10.2.1. Telepathology
- 10.2.2. Cytopathology
- 10.2.3. Immunohistochemistry
- 10.2.4. Hematopathology
- 10.3. Market Analysis, Insights and Forecast - by End User
- 10.3.1. Academic Institute
- 10.3.2. Research
- 10.3.3. Others
- 10.1. Market Analysis, Insights and Forecast - by Technology
- 11. South America Whole-Slide Imaging Market Analysis, Insights and Forecast, 2020-2032
- 11.1. Market Analysis, Insights and Forecast - by Technology
- 11.1.1. Scanners
- 11.1.2. IT Infrastructure
- 11.1.3. Viewer
- 11.1.4. Image Management System
- 11.2. Market Analysis, Insights and Forecast - by Application
- 11.2.1. Telepathology
- 11.2.2. Cytopathology
- 11.2.3. Immunohistochemistry
- 11.2.4. Hematopathology
- 11.3. Market Analysis, Insights and Forecast - by End User
- 11.3.1. Academic Institute
- 11.3.2. Research
- 11.3.3. Others
- 11.1. Market Analysis, Insights and Forecast - by Technology
- 12. Competitive Analysis
- 12.1. Company Profiles
- 12.1.1 MBF Bioscience
- 12.1.1.1. Company Overview
- 12.1.1.2. Products
- 12.1.1.3. Company Financials
- 12.1.1.4. SWOT Analysis
- 12.1.2 Hamamatsu Photonics KK
- 12.1.2.1. Company Overview
- 12.1.2.2. Products
- 12.1.2.3. Company Financials
- 12.1.2.4. SWOT Analysis
- 12.1.3 Nikon Corporation
- 12.1.3.1. Company Overview
- 12.1.3.2. Products
- 12.1.3.3. Company Financials
- 12.1.3.4. SWOT Analysis
- 12.1.4 Leica Microsystems GmbH
- 12.1.4.1. Company Overview
- 12.1.4.2. Products
- 12.1.4.3. Company Financials
- 12.1.4.4. SWOT Analysis
- 12.1.5 Koninklijke Philips N V
- 12.1.5.1. Company Overview
- 12.1.5.2. Products
- 12.1.5.3. Company Financials
- 12.1.5.4. SWOT Analysis
- 12.1.6 3Dhistech
- 12.1.6.1. Company Overview
- 12.1.6.2. Products
- 12.1.6.3. Company Financials
- 12.1.6.4. SWOT Analysis
- 12.1.7 Visiopharm
- 12.1.7.1. Company Overview
- 12.1.7.2. Products
- 12.1.7.3. Company Financials
- 12.1.7.4. SWOT Analysis
- 12.1.8 Indica Labs
- 12.1.8.1. Company Overview
- 12.1.8.2. Products
- 12.1.8.3. Company Financials
- 12.1.8.4. SWOT Analysis
- 12.1.9 Molecular Machines & Industries
- 12.1.9.1. Company Overview
- 12.1.9.2. Products
- 12.1.9.3. Company Financials
- 12.1.9.4. SWOT Analysis
- 12.1.10 Mikroscan Technologies Inc
- 12.1.10.1. Company Overview
- 12.1.10.2. Products
- 12.1.10.3. Company Financials
- 12.1.10.4. SWOT Analysis
- 12.1.11 Olympus Corporation
- 12.1.11.1. Company Overview
- 12.1.11.2. Products
- 12.1.11.3. Company Financials
- 12.1.11.4. SWOT Analysis
- 12.1.12 Akoya Biosciences
- 12.1.12.1. Company Overview
- 12.1.12.2. Products
- 12.1.12.3. Company Financials
- 12.1.12.4. SWOT Analysis
- 12.1.1 MBF Bioscience
- 12.2. Market Entropy
- 12.2.1 Company's Key Areas Served
- 12.2.2 Recent Developments
- 12.3. Company Market Share Analysis 2025
- 12.3.1 Top 5 Companies Market Share Analysis
- 12.3.2 Top 3 Companies Market Share Analysis
- 12.4. List of Potential Customers
- 13. Research Methodology
List of Figures
- Figure 1: Global Whole-Slide Imaging Market Revenue Breakdown (Million, %) by Region 2025 & 2033
- Figure 2: Global Whole-Slide Imaging Market Volume Breakdown (K Unit, %) by Region 2025 & 2033
- Figure 3: North America Whole-Slide Imaging Market Revenue (Million), by Technology 2025 & 2033
- Figure 4: North America Whole-Slide Imaging Market Volume (K Unit), by Technology 2025 & 2033
- Figure 5: North America Whole-Slide Imaging Market Revenue Share (%), by Technology 2025 & 2033
- Figure 6: North America Whole-Slide Imaging Market Volume Share (%), by Technology 2025 & 2033
- Figure 7: North America Whole-Slide Imaging Market Revenue (Million), by Application 2025 & 2033
- Figure 8: North America Whole-Slide Imaging Market Volume (K Unit), by Application 2025 & 2033
- Figure 9: North America Whole-Slide Imaging Market Revenue Share (%), by Application 2025 & 2033
- Figure 10: North America Whole-Slide Imaging Market Volume Share (%), by Application 2025 & 2033
- Figure 11: North America Whole-Slide Imaging Market Revenue (Million), by End User 2025 & 2033
- Figure 12: North America Whole-Slide Imaging Market Volume (K Unit), by End User 2025 & 2033
- Figure 13: North America Whole-Slide Imaging Market Revenue Share (%), by End User 2025 & 2033
- Figure 14: North America Whole-Slide Imaging Market Volume Share (%), by End User 2025 & 2033
- Figure 15: North America Whole-Slide Imaging Market Revenue (Million), by Country 2025 & 2033
- Figure 16: North America Whole-Slide Imaging Market Volume (K Unit), by Country 2025 & 2033
- Figure 17: North America Whole-Slide Imaging Market Revenue Share (%), by Country 2025 & 2033
- Figure 18: North America Whole-Slide Imaging Market Volume Share (%), by Country 2025 & 2033
- Figure 19: Europe Whole-Slide Imaging Market Revenue (Million), by Technology 2025 & 2033
- Figure 20: Europe Whole-Slide Imaging Market Volume (K Unit), by Technology 2025 & 2033
- Figure 21: Europe Whole-Slide Imaging Market Revenue Share (%), by Technology 2025 & 2033
- Figure 22: Europe Whole-Slide Imaging Market Volume Share (%), by Technology 2025 & 2033
- Figure 23: Europe Whole-Slide Imaging Market Revenue (Million), by Application 2025 & 2033
- Figure 24: Europe Whole-Slide Imaging Market Volume (K Unit), by Application 2025 & 2033
- Figure 25: Europe Whole-Slide Imaging Market Revenue Share (%), by Application 2025 & 2033
- Figure 26: Europe Whole-Slide Imaging Market Volume Share (%), by Application 2025 & 2033
- Figure 27: Europe Whole-Slide Imaging Market Revenue (Million), by End User 2025 & 2033
- Figure 28: Europe Whole-Slide Imaging Market Volume (K Unit), by End User 2025 & 2033
- Figure 29: Europe Whole-Slide Imaging Market Revenue Share (%), by End User 2025 & 2033
- Figure 30: Europe Whole-Slide Imaging Market Volume Share (%), by End User 2025 & 2033
- Figure 31: Europe Whole-Slide Imaging Market Revenue (Million), by Country 2025 & 2033
- Figure 32: Europe Whole-Slide Imaging Market Volume (K Unit), by Country 2025 & 2033
- Figure 33: Europe Whole-Slide Imaging Market Revenue Share (%), by Country 2025 & 2033
- Figure 34: Europe Whole-Slide Imaging Market Volume Share (%), by Country 2025 & 2033
- Figure 35: Asia Pacific Whole-Slide Imaging Market Revenue (Million), by Technology 2025 & 2033
- Figure 36: Asia Pacific Whole-Slide Imaging Market Volume (K Unit), by Technology 2025 & 2033
- Figure 37: Asia Pacific Whole-Slide Imaging Market Revenue Share (%), by Technology 2025 & 2033
- Figure 38: Asia Pacific Whole-Slide Imaging Market Volume Share (%), by Technology 2025 & 2033
- Figure 39: Asia Pacific Whole-Slide Imaging Market Revenue (Million), by Application 2025 & 2033
- Figure 40: Asia Pacific Whole-Slide Imaging Market Volume (K Unit), by Application 2025 & 2033
- Figure 41: Asia Pacific Whole-Slide Imaging Market Revenue Share (%), by Application 2025 & 2033
- Figure 42: Asia Pacific Whole-Slide Imaging Market Volume Share (%), by Application 2025 & 2033
- Figure 43: Asia Pacific Whole-Slide Imaging Market Revenue (Million), by End User 2025 & 2033
- Figure 44: Asia Pacific Whole-Slide Imaging Market Volume (K Unit), by End User 2025 & 2033
- Figure 45: Asia Pacific Whole-Slide Imaging Market Revenue Share (%), by End User 2025 & 2033
- Figure 46: Asia Pacific Whole-Slide Imaging Market Volume Share (%), by End User 2025 & 2033
- Figure 47: Asia Pacific Whole-Slide Imaging Market Revenue (Million), by Country 2025 & 2033
- Figure 48: Asia Pacific Whole-Slide Imaging Market Volume (K Unit), by Country 2025 & 2033
- Figure 49: Asia Pacific Whole-Slide Imaging Market Revenue Share (%), by Country 2025 & 2033
- Figure 50: Asia Pacific Whole-Slide Imaging Market Volume Share (%), by Country 2025 & 2033
- Figure 51: Middle East and Africa Whole-Slide Imaging Market Revenue (Million), by Technology 2025 & 2033
- Figure 52: Middle East and Africa Whole-Slide Imaging Market Volume (K Unit), by Technology 2025 & 2033
- Figure 53: Middle East and Africa Whole-Slide Imaging Market Revenue Share (%), by Technology 2025 & 2033
- Figure 54: Middle East and Africa Whole-Slide Imaging Market Volume Share (%), by Technology 2025 & 2033
- Figure 55: Middle East and Africa Whole-Slide Imaging Market Revenue (Million), by Application 2025 & 2033
- Figure 56: Middle East and Africa Whole-Slide Imaging Market Volume (K Unit), by Application 2025 & 2033
- Figure 57: Middle East and Africa Whole-Slide Imaging Market Revenue Share (%), by Application 2025 & 2033
- Figure 58: Middle East and Africa Whole-Slide Imaging Market Volume Share (%), by Application 2025 & 2033
- Figure 59: Middle East and Africa Whole-Slide Imaging Market Revenue (Million), by End User 2025 & 2033
- Figure 60: Middle East and Africa Whole-Slide Imaging Market Volume (K Unit), by End User 2025 & 2033
- Figure 61: Middle East and Africa Whole-Slide Imaging Market Revenue Share (%), by End User 2025 & 2033
- Figure 62: Middle East and Africa Whole-Slide Imaging Market Volume Share (%), by End User 2025 & 2033
- Figure 63: Middle East and Africa Whole-Slide Imaging Market Revenue (Million), by Country 2025 & 2033
- Figure 64: Middle East and Africa Whole-Slide Imaging Market Volume (K Unit), by Country 2025 & 2033
- Figure 65: Middle East and Africa Whole-Slide Imaging Market Revenue Share (%), by Country 2025 & 2033
- Figure 66: Middle East and Africa Whole-Slide Imaging Market Volume Share (%), by Country 2025 & 2033
- Figure 67: South America Whole-Slide Imaging Market Revenue (Million), by Technology 2025 & 2033
- Figure 68: South America Whole-Slide Imaging Market Volume (K Unit), by Technology 2025 & 2033
- Figure 69: South America Whole-Slide Imaging Market Revenue Share (%), by Technology 2025 & 2033
- Figure 70: South America Whole-Slide Imaging Market Volume Share (%), by Technology 2025 & 2033
- Figure 71: South America Whole-Slide Imaging Market Revenue (Million), by Application 2025 & 2033
- Figure 72: South America Whole-Slide Imaging Market Volume (K Unit), by Application 2025 & 2033
- Figure 73: South America Whole-Slide Imaging Market Revenue Share (%), by Application 2025 & 2033
- Figure 74: South America Whole-Slide Imaging Market Volume Share (%), by Application 2025 & 2033
- Figure 75: South America Whole-Slide Imaging Market Revenue (Million), by End User 2025 & 2033
- Figure 76: South America Whole-Slide Imaging Market Volume (K Unit), by End User 2025 & 2033
- Figure 77: South America Whole-Slide Imaging Market Revenue Share (%), by End User 2025 & 2033
- Figure 78: South America Whole-Slide Imaging Market Volume Share (%), by End User 2025 & 2033
- Figure 79: South America Whole-Slide Imaging Market Revenue (Million), by Country 2025 & 2033
- Figure 80: South America Whole-Slide Imaging Market Volume (K Unit), by Country 2025 & 2033
- Figure 81: South America Whole-Slide Imaging Market Revenue Share (%), by Country 2025 & 2033
- Figure 82: South America Whole-Slide Imaging Market Volume Share (%), by Country 2025 & 2033
List of Tables
- Table 1: Global Whole-Slide Imaging Market Revenue Million Forecast, by Technology 2020 & 2033
- Table 2: Global Whole-Slide Imaging Market Volume K Unit Forecast, by Technology 2020 & 2033
- Table 3: Global Whole-Slide Imaging Market Revenue Million Forecast, by Application 2020 & 2033
- Table 4: Global Whole-Slide Imaging Market Volume K Unit Forecast, by Application 2020 & 2033
- Table 5: Global Whole-Slide Imaging Market Revenue Million Forecast, by End User 2020 & 2033
- Table 6: Global Whole-Slide Imaging Market Volume K Unit Forecast, by End User 2020 & 2033
- Table 7: Global Whole-Slide Imaging Market Revenue Million Forecast, by Region 2020 & 2033
- Table 8: Global Whole-Slide Imaging Market Volume K Unit Forecast, by Region 2020 & 2033
- Table 9: Global Whole-Slide Imaging Market Revenue Million Forecast, by Technology 2020 & 2033
- Table 10: Global Whole-Slide Imaging Market Volume K Unit Forecast, by Technology 2020 & 2033
- Table 11: Global Whole-Slide Imaging Market Revenue Million Forecast, by Application 2020 & 2033
- Table 12: Global Whole-Slide Imaging Market Volume K Unit Forecast, by Application 2020 & 2033
- Table 13: Global Whole-Slide Imaging Market Revenue Million Forecast, by End User 2020 & 2033
- Table 14: Global Whole-Slide Imaging Market Volume K Unit Forecast, by End User 2020 & 2033
- Table 15: Global Whole-Slide Imaging Market Revenue Million Forecast, by Country 2020 & 2033
- Table 16: Global Whole-Slide Imaging Market Volume K Unit Forecast, by Country 2020 & 2033
- Table 17: United States Whole-Slide Imaging Market Revenue (Million) Forecast, by Application 2020 & 2033
- Table 18: United States Whole-Slide Imaging Market Volume (K Unit) Forecast, by Application 2020 & 2033
- Table 19: Canada Whole-Slide Imaging Market Revenue (Million) Forecast, by Application 2020 & 2033
- Table 20: Canada Whole-Slide Imaging Market Volume (K Unit) Forecast, by Application 2020 & 2033
- Table 21: Mexico Whole-Slide Imaging Market Revenue (Million) Forecast, by Application 2020 & 2033
- Table 22: Mexico Whole-Slide Imaging Market Volume (K Unit) Forecast, by Application 2020 & 2033
- Table 23: Global Whole-Slide Imaging Market Revenue Million Forecast, by Technology 2020 & 2033
- Table 24: Global Whole-Slide Imaging Market Volume K Unit Forecast, by Technology 2020 & 2033
- Table 25: Global Whole-Slide Imaging Market Revenue Million Forecast, by Application 2020 & 2033
- Table 26: Global Whole-Slide Imaging Market Volume K Unit Forecast, by Application 2020 & 2033
- Table 27: Global Whole-Slide Imaging Market Revenue Million Forecast, by End User 2020 & 2033
- Table 28: Global Whole-Slide Imaging Market Volume K Unit Forecast, by End User 2020 & 2033
- Table 29: Global Whole-Slide Imaging Market Revenue Million Forecast, by Country 2020 & 2033
- Table 30: Global Whole-Slide Imaging Market Volume K Unit Forecast, by Country 2020 & 2033
- Table 31: Germany Whole-Slide Imaging Market Revenue (Million) Forecast, by Application 2020 & 2033
- Table 32: Germany Whole-Slide Imaging Market Volume (K Unit) Forecast, by Application 2020 & 2033
- Table 33: United Kingdom Whole-Slide Imaging Market Revenue (Million) Forecast, by Application 2020 & 2033
- Table 34: United Kingdom Whole-Slide Imaging Market Volume (K Unit) Forecast, by Application 2020 & 2033
- Table 35: France Whole-Slide Imaging Market Revenue (Million) Forecast, by Application 2020 & 2033
- Table 36: France Whole-Slide Imaging Market Volume (K Unit) Forecast, by Application 2020 & 2033
- Table 37: Italy Whole-Slide Imaging Market Revenue (Million) Forecast, by Application 2020 & 2033
- Table 38: Italy Whole-Slide Imaging Market Volume (K Unit) Forecast, by Application 2020 & 2033
- Table 39: Spain Whole-Slide Imaging Market Revenue (Million) Forecast, by Application 2020 & 2033
- Table 40: Spain Whole-Slide Imaging Market Volume (K Unit) Forecast, by Application 2020 & 2033
- Table 41: Rest of Europe Whole-Slide Imaging Market Revenue (Million) Forecast, by Application 2020 & 2033
- Table 42: Rest of Europe Whole-Slide Imaging Market Volume (K Unit) Forecast, by Application 2020 & 2033
- Table 43: Global Whole-Slide Imaging Market Revenue Million Forecast, by Technology 2020 & 2033
- Table 44: Global Whole-Slide Imaging Market Volume K Unit Forecast, by Technology 2020 & 2033
- Table 45: Global Whole-Slide Imaging Market Revenue Million Forecast, by Application 2020 & 2033
- Table 46: Global Whole-Slide Imaging Market Volume K Unit Forecast, by Application 2020 & 2033
- Table 47: Global Whole-Slide Imaging Market Revenue Million Forecast, by End User 2020 & 2033
- Table 48: Global Whole-Slide Imaging Market Volume K Unit Forecast, by End User 2020 & 2033
- Table 49: Global Whole-Slide Imaging Market Revenue Million Forecast, by Country 2020 & 2033
- Table 50: Global Whole-Slide Imaging Market Volume K Unit Forecast, by Country 2020 & 2033
- Table 51: China Whole-Slide Imaging Market Revenue (Million) Forecast, by Application 2020 & 2033
- Table 52: China Whole-Slide Imaging Market Volume (K Unit) Forecast, by Application 2020 & 2033
- Table 53: Japan Whole-Slide Imaging Market Revenue (Million) Forecast, by Application 2020 & 2033
- Table 54: Japan Whole-Slide Imaging Market Volume (K Unit) Forecast, by Application 2020 & 2033
- Table 55: India Whole-Slide Imaging Market Revenue (Million) Forecast, by Application 2020 & 2033
- Table 56: India Whole-Slide Imaging Market Volume (K Unit) Forecast, by Application 2020 & 2033
- Table 57: Australia Whole-Slide Imaging Market Revenue (Million) Forecast, by Application 2020 & 2033
- Table 58: Australia Whole-Slide Imaging Market Volume (K Unit) Forecast, by Application 2020 & 2033
- Table 59: South korea Whole-Slide Imaging Market Revenue (Million) Forecast, by Application 2020 & 2033
- Table 60: South korea Whole-Slide Imaging Market Volume (K Unit) Forecast, by Application 2020 & 2033
- Table 61: Rest of Asia Pacific Whole-Slide Imaging Market Revenue (Million) Forecast, by Application 2020 & 2033
- Table 62: Rest of Asia Pacific Whole-Slide Imaging Market Volume (K Unit) Forecast, by Application 2020 & 2033
- Table 63: Global Whole-Slide Imaging Market Revenue Million Forecast, by Technology 2020 & 2033
- Table 64: Global Whole-Slide Imaging Market Volume K Unit Forecast, by Technology 2020 & 2033
- Table 65: Global Whole-Slide Imaging Market Revenue Million Forecast, by Application 2020 & 2033
- Table 66: Global Whole-Slide Imaging Market Volume K Unit Forecast, by Application 2020 & 2033
- Table 67: Global Whole-Slide Imaging Market Revenue Million Forecast, by End User 2020 & 2033
- Table 68: Global Whole-Slide Imaging Market Volume K Unit Forecast, by End User 2020 & 2033
- Table 69: Global Whole-Slide Imaging Market Revenue Million Forecast, by Country 2020 & 2033
- Table 70: Global Whole-Slide Imaging Market Volume K Unit Forecast, by Country 2020 & 2033
- Table 71: GCC Whole-Slide Imaging Market Revenue (Million) Forecast, by Application 2020 & 2033
- Table 72: GCC Whole-Slide Imaging Market Volume (K Unit) Forecast, by Application 2020 & 2033
- Table 73: South Africa Whole-Slide Imaging Market Revenue (Million) Forecast, by Application 2020 & 2033
- Table 74: South Africa Whole-Slide Imaging Market Volume (K Unit) Forecast, by Application 2020 & 2033
- Table 75: Rest of Middle East and Africa Whole-Slide Imaging Market Revenue (Million) Forecast, by Application 2020 & 2033
- Table 76: Rest of Middle East and Africa Whole-Slide Imaging Market Volume (K Unit) Forecast, by Application 2020 & 2033
- Table 77: Global Whole-Slide Imaging Market Revenue Million Forecast, by Technology 2020 & 2033
- Table 78: Global Whole-Slide Imaging Market Volume K Unit Forecast, by Technology 2020 & 2033
- Table 79: Global Whole-Slide Imaging Market Revenue Million Forecast, by Application 2020 & 2033
- Table 80: Global Whole-Slide Imaging Market Volume K Unit Forecast, by Application 2020 & 2033
- Table 81: Global Whole-Slide Imaging Market Revenue Million Forecast, by End User 2020 & 2033
- Table 82: Global Whole-Slide Imaging Market Volume K Unit Forecast, by End User 2020 & 2033
- Table 83: Global Whole-Slide Imaging Market Revenue Million Forecast, by Country 2020 & 2033
- Table 84: Global Whole-Slide Imaging Market Volume K Unit Forecast, by Country 2020 & 2033
- Table 85: Brazil Whole-Slide Imaging Market Revenue (Million) Forecast, by Application 2020 & 2033
- Table 86: Brazil Whole-Slide Imaging Market Volume (K Unit) Forecast, by Application 2020 & 2033
- Table 87: Argentina Whole-Slide Imaging Market Revenue (Million) Forecast, by Application 2020 & 2033
- Table 88: Argentina Whole-Slide Imaging Market Volume (K Unit) Forecast, by Application 2020 & 2033
- Table 89: Rest of South America Whole-Slide Imaging Market Revenue (Million) Forecast, by Application 2020 & 2033
- Table 90: Rest of South America Whole-Slide Imaging Market Volume (K Unit) Forecast, by Application 2020 & 2033
Frequently Asked Questions
1. What is the projected Compound Annual Growth Rate (CAGR) of the Whole-Slide Imaging Market?
The projected CAGR is approximately 6.39%.
2. Which companies are prominent players in the Whole-Slide Imaging Market?
Key companies in the market include MBF Bioscience, Hamamatsu Photonics KK, Nikon Corporation, Leica Microsystems GmbH, Koninklijke Philips N V, 3Dhistech, Visiopharm, Indica Labs, Molecular Machines & Industries, Mikroscan Technologies Inc, Olympus Corporation, Akoya Biosciences.
3. What are the main segments of the Whole-Slide Imaging Market?
The market segments include Technology, Application, End User.
4. Can you provide details about the market size?
The market size is estimated to be USD 1.21 Million as of 2022.
5. What are some drivers contributing to market growth?
Growing Popularity of Virtual Slides as Compared to Physical Slides; Technological Advancements in Whole Slide Imaging; Increasing Research in Drug Discovery.
6. What are the notable trends driving market growth?
Telepathology Segment is Expected to Grow Significantly Over the Forecast Period.
7. Are there any restraints impacting market growth?
Stringent Regulatory Approvals; High Cost of Whole Slide Imaging Systems.
8. Can you provide examples of recent developments in the market?
March 2023: Pramana, Inc., an AI-enabled health tech company modernizing the pathology sector, collaborated with PathPresenter to accelerate the enterprise adoption of digital pathology workflows. The goal of this collaboration is to ensure a seamless user experience for the labs adopting Pramana's Digital Pathology as a Service solution for whole slide image generation, as well as PathPresenter's image management/image viewing platform.
9. What pricing options are available for accessing the report?
Pricing options include single-user, multi-user, and enterprise licenses priced at USD 4750, USD 5250, and USD 8750 respectively.
10. Is the market size provided in terms of value or volume?
The market size is provided in terms of value, measured in Million and volume, measured in K Unit.
11. Are there any specific market keywords associated with the report?
Yes, the market keyword associated with the report is "Whole-Slide Imaging Market," which aids in identifying and referencing the specific market segment covered.
12. How do I determine which pricing option suits my needs best?
The pricing options vary based on user requirements and access needs. Individual users may opt for single-user licenses, while businesses requiring broader access may choose multi-user or enterprise licenses for cost-effective access to the report.
13. Are there any additional resources or data provided in the Whole-Slide Imaging Market report?
While the report offers comprehensive insights, it's advisable to review the specific contents or supplementary materials provided to ascertain if additional resources or data are available.
14. How can I stay updated on further developments or reports in the Whole-Slide Imaging Market?
To stay informed about further developments, trends, and reports in the Whole-Slide Imaging Market, consider subscribing to industry newsletters, following relevant companies and organizations, or regularly checking reputable industry news sources and publications.
Methodology
Step 1 - Identification of Relevant Samples Size from Population Database


Step 2 - Approaches for Defining Global Market Size (Value, Volume* & Price*)

Note*: In applicable scenarios
Step 3 - Data Sources
Primary Research
- Web Analytics
- Survey Reports
- Research Institute
- Latest Research Reports
- Opinion Leaders
Secondary Research
- Annual Reports
- White Paper
- Latest Press Release
- Industry Association
- Paid Database
- Investor Presentations

Step 4 - Data Triangulation
Involves using different sources of information in order to increase the validity of a study
These sources are likely to be stakeholders in a program - participants, other researchers, program staff, other community members, and so on.
Then we put all data in single framework & apply various statistical tools to find out the dynamic on the market.
During the analysis stage, feedback from the stakeholder groups would be compared to determine areas of agreement as well as areas of divergence