

Key Insights
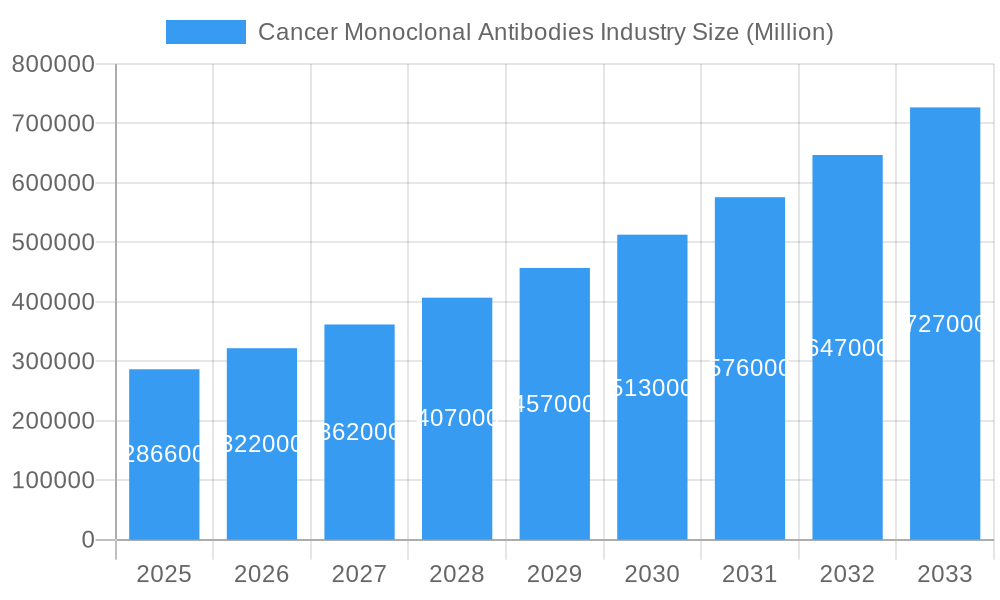
The global Cancer Monoclonal Antibodies market is poised for substantial growth, projected to reach USD 286.6 billion in 2025. This expansion is driven by a significant CAGR of 12.44%, indicating robust industry momentum that is expected to continue through 2033. The increasing prevalence of various cancers, coupled with advancements in targeted therapy research and development, are primary catalysts for this growth. Monoclonal antibodies offer a more precise and less toxic approach to cancer treatment compared to traditional chemotherapy, leading to higher adoption rates and significant investments from leading pharmaceutical and biotechnology companies. The market's expansion is further fueled by an aging global population, which naturally sees a higher incidence of cancer, and a growing demand for personalized medicine solutions.
Cancer Monoclonal Antibodies Industry Market Size (In Billion)
The diverse application landscape of monoclonal antibodies, spanning critical areas such as breast cancer, blood cancer, liver cancer, brain cancer, and colorectal cancer, underscores their therapeutic versatility. Key monoclonal antibody therapies like Bevacizumab (Avastin), Rituximab (Rituxan), and Trastuzumab (Herceptin) have become standard-of-care treatments, further solidifying the market's trajectory. While significant opportunities exist, the market faces certain restraints, including the high cost of development and treatment, stringent regulatory pathways, and the emergence of treatment resistance in some patient populations. Despite these challenges, ongoing research into novel antibody engineering, combination therapies, and biosimilars is expected to mitigate these restraints and propel the market towards its projected growth figures, ensuring continued innovation and improved patient outcomes in cancer care.
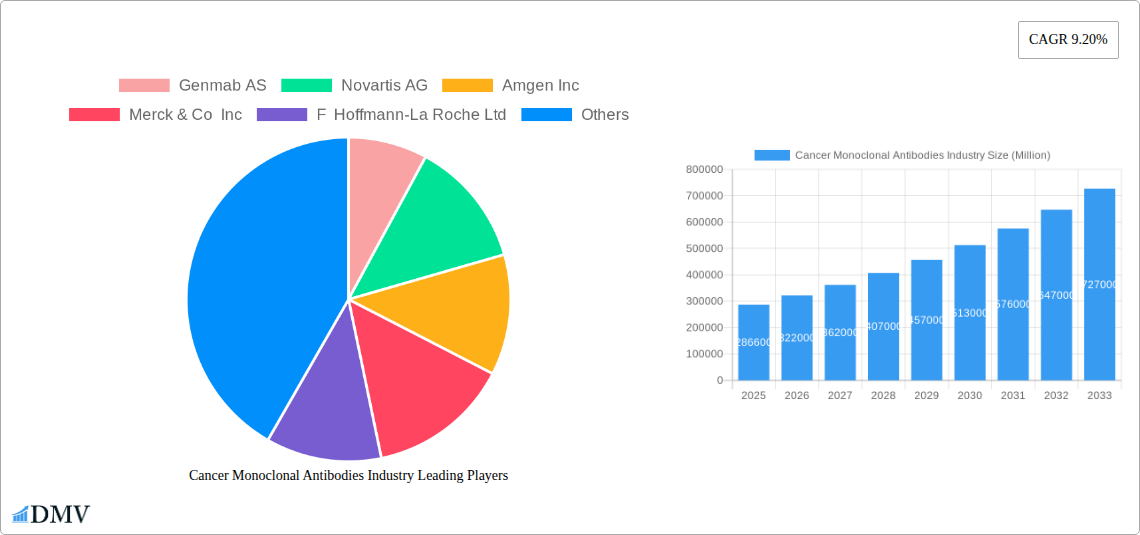
Cancer Monoclonal Antibodies Industry Company Market Share
Cancer Monoclonal Antibodies Industry: Market Analysis, Trends, and Future Outlook (2019-2033)
This comprehensive report, "Cancer Monoclonal Antibodies Industry Market Analysis, Trends, and Future Outlook (2019-2033)," offers an in-depth exploration of the dynamic global cancer monoclonal antibodies market. Delving into historical performance (2019-2024), current market composition (Base Year: 2025), and future projections (Forecast Period: 2025-2033), this report provides critical insights for stakeholders seeking to understand market dynamics, identify growth opportunities, and navigate the evolving landscape of targeted cancer therapies. We analyze key segments, leading players, product innovations, and the strategic factors influencing this rapidly expanding sector of biopharmaceuticals.
Cancer Monoclonal Antibodies Industry Market Composition & Trends
The cancer monoclonal antibodies market exhibits a moderate to highly consolidated structure, driven by substantial R&D investments and stringent regulatory oversight. Innovation catalysts are primarily centered on enhancing efficacy, reducing off-target effects, and developing novel treatment modalities like bispecific antibodies and antibody-drug conjugates (ADCs). The regulatory landscape, governed by agencies like the FDA and EMA, plays a pivotal role in market access and approval timelines, influencing the pace of new product launches. Substitute products, while emerging in the form of small molecule inhibitors and immunotherapies, are currently outpaced by the specificity and targeted action of monoclonal antibodies for many cancer types. End-user profiles are diverse, encompassing oncologists, hematologists, hospitals, and specialized cancer treatment centers, all increasingly reliant on these precision medicines. Mergers and acquisitions (M&A) activity is a significant trend, with large pharmaceutical companies acquiring promising biotech firms to bolster their oncology pipelines. Recent M&A deal values are estimated to be in the tens of billions of dollars annually, reflecting the strategic importance of this segment.
- Market Share Distribution: Leading companies like Genmab AS, Novartis AG, Amgen Inc, Merck & Co Inc, F Hoffmann-La Roche Ltd, and Bristol Myers Squibb Company collectively hold a significant majority of the market share, estimated at over 70% of the total market value of approximately $80 billion.
- M&A Activity: The past few years have seen significant M&A transactions, with deal values ranging from several hundred million dollars to over ten billion dollars, aimed at acquiring innovative technologies and late-stage pipeline assets.
Cancer Monoclonal Antibodies Industry Industry Evolution
The cancer monoclonal antibodies industry has witnessed a profound evolution, transforming from niche experimental treatments to mainstream therapeutic pillars in oncology. This remarkable growth trajectory is underpinned by continuous technological advancements and a deeper understanding of cancer biology at the molecular level. Early murine antibodies, while groundbreaking, were limited by immunogenicity. The subsequent development of chimeric and humanized antibodies marked significant steps towards improving patient tolerance and therapeutic efficacy, expanding the applicability of antibody-based therapies. The introduction of highly targeted monoclonal antibody therapies such as Bevacizumab (Avastin), Rituximab (Rituxan), and Trastuzumab (Herceptin) revolutionized the treatment of various cancers, including breast cancer and blood cancer, demonstrating impressive response rates and extending patient survival. The market has responded to shifting consumer demands by focusing on personalized medicine, leading to the development of antibodies tailored to specific genetic mutations and protein expressions within tumors. This has further fueled the demand for these sophisticated treatments. The market size has seen a consistent compound annual growth rate (CAGR) of approximately 12-15% over the historical period (2019-2024), with projections indicating a sustained growth of over 14% through 2033. This robust growth is attributed to an increasing global cancer incidence, expanded indications for existing therapies, and the continuous pipeline of novel antibody-based drugs. For instance, the adoption rate of newly approved monoclonal antibodies in their respective indications has often exceeded 60% within the first two years of launch, showcasing strong market acceptance. The investment in R&D for oncology drugs, with a significant portion dedicated to monoclonal antibodies, has consistently remained in the tens of billions of dollars annually, underscoring the industry's commitment to innovation and expansion.
Leading Regions, Countries, or Segments in Cancer Monoclonal Antibodies Industry
North America, particularly the United States, stands as the dominant region in the cancer monoclonal antibodies industry, driven by a robust healthcare infrastructure, substantial R&D investments, and a high prevalence of cancer diagnoses. The region's strong regulatory framework, coupled with the early adoption of innovative therapies, positions it at the forefront of market growth. Within the segments, Monoclonal Antibody Therapies, specifically Trastuzumab (Herceptin) and Rituximab (Rituxan), have consistently demonstrated leading market performance due to their established efficacy in treating prevalent cancers like breast cancer and blood cancer, respectively.
- Dominant Segment: Monoclonal Antibody Therapies: The market for established and emerging monoclonal antibody therapies is expected to reach an estimated value of over $60 billion by 2025.
- Key Drivers:
- High Incidence of Target Cancers: Breast Cancer and Blood Cancer are among the most diagnosed cancers globally, driving significant demand for effective antibody therapies.
- Extensive Clinical Evidence and Approvals: Therapies like Bevacizumab (Avastin) and Trastuzumab (Herceptin) have a well-documented history of efficacy and are approved for multiple indications.
- Pipeline Robustness: A significant number of novel antibody therapies are in late-stage clinical trials for various cancers, promising future market expansion.
- Key Drivers:
- Leading Application: Breast Cancer: The application of monoclonal antibodies in breast cancer treatment has been a major growth engine.
- Dominance Factors:
- HER2-Positive Breast Cancer: Trastuzumab remains a cornerstone treatment for HER2-positive breast cancer, a significant subset of the disease.
- Advancements in Combination Therapies: The integration of monoclonal antibodies with chemotherapy and other targeted agents has improved outcomes.
- Early Detection and Screening: Increased awareness and screening programs lead to earlier diagnosis, allowing for timely intervention with antibody therapies.
- Dominance Factors:
- Key Region: North America: The market in North America is estimated to account for over 45% of the global market share.
- Investment Trends: Annual R&D expenditure in the US for oncology therapeutics exceeds $20 billion, with monoclonal antibodies representing a substantial portion.
- Regulatory Support: The FDA's streamlined approval pathways for novel oncology drugs facilitate market entry for innovative therapies.
- Type of Monoclonal Antibody: Humanized Antibodies: These antibodies represent the largest and fastest-growing segment within the types of monoclonal antibodies due to their reduced immunogenicity and enhanced therapeutic potential compared to murine and chimeric counterparts. The market for humanized antibodies alone is projected to exceed $30 billion by 2025.
Cancer Monoclonal Antibodies Industry Product Innovations
Product innovation in the cancer monoclonal antibodies industry is characterized by a relentless pursuit of enhanced specificity, improved safety profiles, and novel mechanisms of action. Advancements include the development of bispecific antibodies capable of targeting two different antigens simultaneously, thereby increasing therapeutic potency and overcoming resistance mechanisms. Antibody-drug conjugates (ADCs), which link cytotoxic payloads to monoclonal antibodies, are also gaining significant traction, delivering potent chemotherapy directly to cancer cells while minimizing systemic toxicity. Furthermore, research into novel antibody formats, such as nanobodies and fragments, aims to improve tissue penetration and pharmacokinetics. These innovations are driving the development of next-generation cancer immunotherapies and targeted treatments.
Propelling Factors for Cancer Monoclonal Antibodies Industry Growth
The cancer monoclonal antibodies industry is propelled by several interconnected factors. Technologically, advancements in genetic engineering and antibody discovery platforms have enabled the development of highly specific and potent therapeutic antibodies. Economically, increasing healthcare expenditure globally, coupled with rising disposable incomes in emerging markets, enhances patient access to these advanced treatments. The growing prevalence of cancer worldwide, particularly in aging populations, creates a sustained demand for effective therapies. Regulatory bodies are also increasingly facilitating faster approval pathways for promising oncology drugs, incentivizing further R&D. The expanding clinical evidence showcasing the efficacy of monoclonal antibodies across a wide spectrum of cancers is a crucial driver, encouraging their widespread adoption by oncologists.
Obstacles in the Cancer Monoclonal Antibodies Industry Market
Despite its robust growth, the cancer monoclonal antibodies industry faces several obstacles. High manufacturing costs associated with complex biopharmaceutical production pose a significant barrier to affordability and accessibility, particularly in resource-limited regions. Stringent and lengthy regulatory approval processes, while ensuring safety, can delay market entry for innovative products. Furthermore, the development of intrinsic or acquired resistance to antibody therapies by some patient populations necessitates continuous research into combination strategies and novel drug development. Intense competition among a growing number of pharmaceutical companies, alongside patent cliffs for blockbuster drugs, also exerts pressure on pricing and market share. Supply chain disruptions and the need for specialized cold chain logistics can further complicate market operations. The overall market value is estimated to be impacted by these factors, with potential slowdowns in growth of up to 2% if these challenges are not effectively addressed.
Future Opportunities in Cancer Monoclonal Antibodies Industry
Future opportunities in the cancer monoclonal antibodies industry lie in several key areas. The expansion of applications into earlier stages of cancer treatment and for a wider array of rare or previously untreatable cancers presents significant potential. The development of novel antibody formats, such as bispecific antibodies and antibody-drug conjugates (ADCs), is a major growth avenue, offering enhanced efficacy and targeted delivery. Furthermore, the increasing focus on personalized medicine and biomarker-driven therapies creates opportunities for developing antibodies tailored to specific patient populations based on genetic profiling. Emerging markets, with their burgeoning healthcare sectors and growing demand for advanced treatments, represent significant untapped potential. The continued advancements in immunotherapy combinations, leveraging antibodies alongside other treatment modalities, will also unlock new therapeutic paradigms.
Major Players in the Cancer Monoclonal Antibodies Industry Ecosystem
- Genmab AS
- Novartis AG
- Amgen Inc
- Merck & Co Inc
- F Hoffmann-La Roche Ltd
- Spectrum Pharmaceuticals Inc
- Eli Lilly and Company
- Bristol Myers Squibb Company
- Johnson & Johnson
- GlaxoSmithKline PLC
Key Developments in Cancer Monoclonal Antibodies Industry Industry
- February 2022: The Janssen Pharmaceutical Companies of Johnson & Johnson received United States Food and Drug Administration (FDA) approval for CARVYKTI (ciltacabtagene autoleucel; cilta-cel) for the treatment of adults with relapsed or refractory multiple myeloma (RRMM) after four or more prior lines of therapy, including a proteasome inhibitor, an immunomodulatory agent, and an anti-CD38 monoclonal antibody. This milestone significantly expands treatment options for a challenging hematological malignancy.
- January 2022: Akeso received approval from the Center for Drug Evaluation (CDE) of China's National Medical Products Administration to commence a Phase II clinical trial of monoclonal antibody ligufalimab (AK117) and bispecific antibody ivonescimab (AK112) for first-line breast cancer. This development highlights the growing innovation in antibody therapies and the expanding clinical research landscape in Asia.
Strategic Cancer Monoclonal Antibodies Industry Market Forecast
The strategic forecast for the cancer monoclonal antibodies industry is overwhelmingly positive, driven by the confluence of accelerating innovation, expanding clinical applications, and increasing global healthcare investments. The market is projected to witness sustained double-digit growth through 2033, fueled by the continuous pipeline of novel antibody-drug conjugates, bispecific antibodies, and next-generation immunotherapies. The increasing focus on personalized medicine, coupled with advancements in diagnostic tools, will enable more precise targeting of cancer therapies, thereby enhancing efficacy and patient outcomes. Emerging markets represent a significant untapped opportunity, with growing healthcare infrastructure and increasing demand for advanced treatments. The strategic imperative for market players lies in continued R&D investment, strategic collaborations, and a focus on addressing the cost and accessibility challenges to fully realize the immense market potential. The global market size is anticipated to surpass $150 billion by 2033, with a CAGR of approximately 14.5%.
Cancer Monoclonal Antibodies Industry Segmentation
-
1. Types of Monoclonal Antibody
- 1.1. Murine Antibodies
- 1.2. Chimeric Antibodies
- 1.3. Humanized Antibodies
-
2. Monoclonal Antibody Therapies
- 2.1. Bevacizumab (Avastin)
- 2.2. Rituximab (Rituxan)
- 2.3. Trastuzumab (Herceptin)
- 2.4. Cetuximab (Erbitux)
- 2.5. Panitumumab (Vectibix)
- 2.6. Other Monoclonal Antibody Therapies
-
3. Application
- 3.1. Breast Cancer
- 3.2. Blood Cancer
- 3.3. Liver Cancer
- 3.4. Brain Cancer
- 3.5. Colorectal Cancer
- 3.6. Other Applications
Cancer Monoclonal Antibodies Industry Segmentation By Geography
-
1. North America
- 1.1. United States
- 1.2. Canada
- 1.3. Mexico
-
2. Europe
- 2.1. Germany
- 2.2. United Kingdom
- 2.3. France
- 2.4. Italy
- 2.5. Spain
- 2.6. Rest of Europe
-
3. Asia Pacific
- 3.1. China
- 3.2. Japan
- 3.3. India
- 3.4. Australia
- 3.5. South korea
- 3.6. Rest of Asia Pacific
-
4. Middle East and Africa
- 4.1. GCC
- 4.2. South Africa
- 4.3. Rest of Middle East and Africa
-
5. South America
- 5.1. Brazil
- 5.2. Argentina
- 5.3. Rest of South America
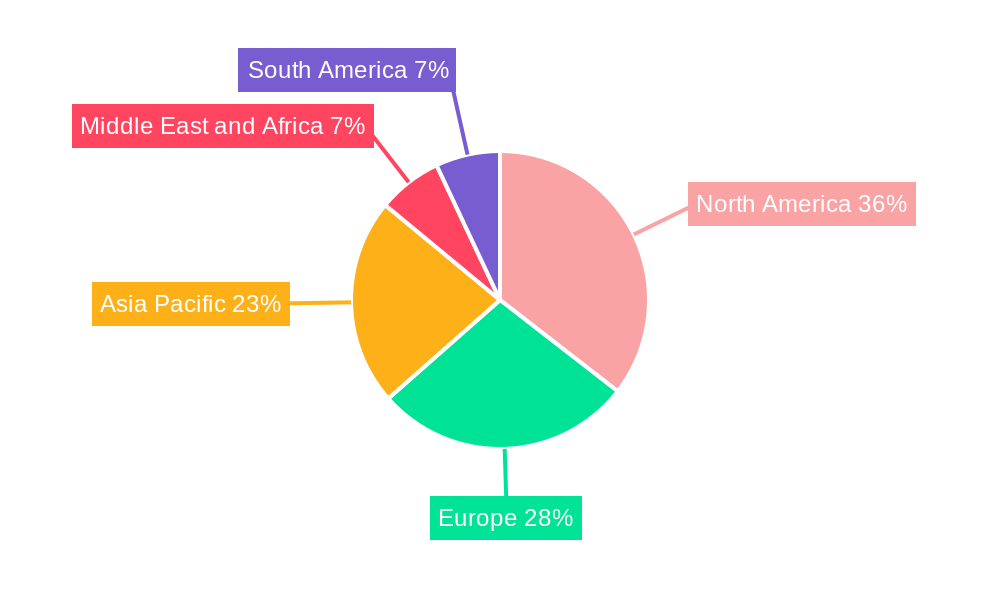
Cancer Monoclonal Antibodies Industry Regional Market Share
Geographic Coverage of Cancer Monoclonal Antibodies Industry
Cancer Monoclonal Antibodies Industry REPORT HIGHLIGHTS
| Aspects | Details |
|---|---|
| Study Period | 2020-2034 |
| Base Year | 2025 |
| Estimated Year | 2026 |
| Forecast Period | 2026-2034 |
| Historical Period | 2020-2025 |
| Growth Rate | CAGR of 8.2% from 2020-2034 |
| Segmentation |
|
Table of Contents
- 1. Introduction
- 1.1. Research Scope
- 1.2. Market Segmentation
- 1.3. Research Objective
- 1.4. Definitions and Assumptions
- 2. Executive Summary
- 2.1. Market Snapshot
- 3. Market Dynamics
- 3.1. Market Drivers
- 3.2. Market Restrains
- 3.3. Market Trends
- 3.4. Market Opportunities
- 4. Market Factor Analysis
- 4.1. Porters Five Forces
- 4.1.1. Bargaining Power of Suppliers
- 4.1.2. Bargaining Power of Buyers
- 4.1.3. Threat of New Entrants
- 4.1.4. Threat of Substitutes
- 4.1.5. Competitive Rivalry
- 4.2. PESTEL analysis
- 4.3. BCG Analysis
- 4.3.1. Stars (High Growth, High Market Share)
- 4.3.2. Cash Cows (Low Growth, High Market Share)
- 4.3.3. Question Mark (High Growth, Low Market Share)
- 4.3.4. Dogs (Low Growth, Low Market Share)
- 4.4. Ansoff Matrix Analysis
- 4.5. Supply Chain Analysis
- 4.6. Regulatory Landscape
- 4.7. Current Market Potential and Opportunity Assessment (TAM–SAM–SOM Framework)
- 4.8. DMV Analyst Note
- 4.1. Porters Five Forces
- 5. Market Analysis, Insights and Forecast 2021-2033
- 5.1. Market Analysis, Insights and Forecast - by Types of Monoclonal Antibody
- 5.1.1. Murine Antibodies
- 5.1.2. Chimeric Antibodies
- 5.1.3. Humanized Antibodies
- 5.2. Market Analysis, Insights and Forecast - by Monoclonal Antibody Therapies
- 5.2.1. Bevacizumab (Avastin)
- 5.2.2. Rituximab (Rituxan)
- 5.2.3. Trastuzumab (Herceptin)
- 5.2.4. Cetuximab (Erbitux)
- 5.2.5. Panitumumab (Vectibix)
- 5.2.6. Other Monoclonal Antibody Therapies
- 5.3. Market Analysis, Insights and Forecast - by Application
- 5.3.1. Breast Cancer
- 5.3.2. Blood Cancer
- 5.3.3. Liver Cancer
- 5.3.4. Brain Cancer
- 5.3.5. Colorectal Cancer
- 5.3.6. Other Applications
- 5.4. Market Analysis, Insights and Forecast - by Region
- 5.4.1. North America
- 5.4.2. Europe
- 5.4.3. Asia Pacific
- 5.4.4. Middle East and Africa
- 5.4.5. South America
- 5.1. Market Analysis, Insights and Forecast - by Types of Monoclonal Antibody
- 6. Cancer Monoclonal Antibodies Industry Analysis, Insights and Forecast, 2021-2033
- 6.1. Market Analysis, Insights and Forecast - by Types of Monoclonal Antibody
- 6.1.1. Murine Antibodies
- 6.1.2. Chimeric Antibodies
- 6.1.3. Humanized Antibodies
- 6.2. Market Analysis, Insights and Forecast - by Monoclonal Antibody Therapies
- 6.2.1. Bevacizumab (Avastin)
- 6.2.2. Rituximab (Rituxan)
- 6.2.3. Trastuzumab (Herceptin)
- 6.2.4. Cetuximab (Erbitux)
- 6.2.5. Panitumumab (Vectibix)
- 6.2.6. Other Monoclonal Antibody Therapies
- 6.3. Market Analysis, Insights and Forecast - by Application
- 6.3.1. Breast Cancer
- 6.3.2. Blood Cancer
- 6.3.3. Liver Cancer
- 6.3.4. Brain Cancer
- 6.3.5. Colorectal Cancer
- 6.3.6. Other Applications
- 6.1. Market Analysis, Insights and Forecast - by Types of Monoclonal Antibody
- 7. North America Cancer Monoclonal Antibodies Industry Analysis, Insights and Forecast, 2020-2032
- 7.1. Market Analysis, Insights and Forecast - by Types of Monoclonal Antibody
- 7.1.1. Murine Antibodies
- 7.1.2. Chimeric Antibodies
- 7.1.3. Humanized Antibodies
- 7.2. Market Analysis, Insights and Forecast - by Monoclonal Antibody Therapies
- 7.2.1. Bevacizumab (Avastin)
- 7.2.2. Rituximab (Rituxan)
- 7.2.3. Trastuzumab (Herceptin)
- 7.2.4. Cetuximab (Erbitux)
- 7.2.5. Panitumumab (Vectibix)
- 7.2.6. Other Monoclonal Antibody Therapies
- 7.3. Market Analysis, Insights and Forecast - by Application
- 7.3.1. Breast Cancer
- 7.3.2. Blood Cancer
- 7.3.3. Liver Cancer
- 7.3.4. Brain Cancer
- 7.3.5. Colorectal Cancer
- 7.3.6. Other Applications
- 7.1. Market Analysis, Insights and Forecast - by Types of Monoclonal Antibody
- 8. Europe Cancer Monoclonal Antibodies Industry Analysis, Insights and Forecast, 2020-2032
- 8.1. Market Analysis, Insights and Forecast - by Types of Monoclonal Antibody
- 8.1.1. Murine Antibodies
- 8.1.2. Chimeric Antibodies
- 8.1.3. Humanized Antibodies
- 8.2. Market Analysis, Insights and Forecast - by Monoclonal Antibody Therapies
- 8.2.1. Bevacizumab (Avastin)
- 8.2.2. Rituximab (Rituxan)
- 8.2.3. Trastuzumab (Herceptin)
- 8.2.4. Cetuximab (Erbitux)
- 8.2.5. Panitumumab (Vectibix)
- 8.2.6. Other Monoclonal Antibody Therapies
- 8.3. Market Analysis, Insights and Forecast - by Application
- 8.3.1. Breast Cancer
- 8.3.2. Blood Cancer
- 8.3.3. Liver Cancer
- 8.3.4. Brain Cancer
- 8.3.5. Colorectal Cancer
- 8.3.6. Other Applications
- 8.1. Market Analysis, Insights and Forecast - by Types of Monoclonal Antibody
- 9. Asia Pacific Cancer Monoclonal Antibodies Industry Analysis, Insights and Forecast, 2020-2032
- 9.1. Market Analysis, Insights and Forecast - by Types of Monoclonal Antibody
- 9.1.1. Murine Antibodies
- 9.1.2. Chimeric Antibodies
- 9.1.3. Humanized Antibodies
- 9.2. Market Analysis, Insights and Forecast - by Monoclonal Antibody Therapies
- 9.2.1. Bevacizumab (Avastin)
- 9.2.2. Rituximab (Rituxan)
- 9.2.3. Trastuzumab (Herceptin)
- 9.2.4. Cetuximab (Erbitux)
- 9.2.5. Panitumumab (Vectibix)
- 9.2.6. Other Monoclonal Antibody Therapies
- 9.3. Market Analysis, Insights and Forecast - by Application
- 9.3.1. Breast Cancer
- 9.3.2. Blood Cancer
- 9.3.3. Liver Cancer
- 9.3.4. Brain Cancer
- 9.3.5. Colorectal Cancer
- 9.3.6. Other Applications
- 9.1. Market Analysis, Insights and Forecast - by Types of Monoclonal Antibody
- 10. Middle East and Africa Cancer Monoclonal Antibodies Industry Analysis, Insights and Forecast, 2020-2032
- 10.1. Market Analysis, Insights and Forecast - by Types of Monoclonal Antibody
- 10.1.1. Murine Antibodies
- 10.1.2. Chimeric Antibodies
- 10.1.3. Humanized Antibodies
- 10.2. Market Analysis, Insights and Forecast - by Monoclonal Antibody Therapies
- 10.2.1. Bevacizumab (Avastin)
- 10.2.2. Rituximab (Rituxan)
- 10.2.3. Trastuzumab (Herceptin)
- 10.2.4. Cetuximab (Erbitux)
- 10.2.5. Panitumumab (Vectibix)
- 10.2.6. Other Monoclonal Antibody Therapies
- 10.3. Market Analysis, Insights and Forecast - by Application
- 10.3.1. Breast Cancer
- 10.3.2. Blood Cancer
- 10.3.3. Liver Cancer
- 10.3.4. Brain Cancer
- 10.3.5. Colorectal Cancer
- 10.3.6. Other Applications
- 10.1. Market Analysis, Insights and Forecast - by Types of Monoclonal Antibody
- 11. South America Cancer Monoclonal Antibodies Industry Analysis, Insights and Forecast, 2020-2032
- 11.1. Market Analysis, Insights and Forecast - by Types of Monoclonal Antibody
- 11.1.1. Murine Antibodies
- 11.1.2. Chimeric Antibodies
- 11.1.3. Humanized Antibodies
- 11.2. Market Analysis, Insights and Forecast - by Monoclonal Antibody Therapies
- 11.2.1. Bevacizumab (Avastin)
- 11.2.2. Rituximab (Rituxan)
- 11.2.3. Trastuzumab (Herceptin)
- 11.2.4. Cetuximab (Erbitux)
- 11.2.5. Panitumumab (Vectibix)
- 11.2.6. Other Monoclonal Antibody Therapies
- 11.3. Market Analysis, Insights and Forecast - by Application
- 11.3.1. Breast Cancer
- 11.3.2. Blood Cancer
- 11.3.3. Liver Cancer
- 11.3.4. Brain Cancer
- 11.3.5. Colorectal Cancer
- 11.3.6. Other Applications
- 11.1. Market Analysis, Insights and Forecast - by Types of Monoclonal Antibody
- 12. Competitive Analysis
- 12.1. Company Profiles
- 12.1.1 Genmab AS
- 12.1.1.1. Company Overview
- 12.1.1.2. Products
- 12.1.1.3. Company Financials
- 12.1.1.4. SWOT Analysis
- 12.1.2 Novartis AG
- 12.1.2.1. Company Overview
- 12.1.2.2. Products
- 12.1.2.3. Company Financials
- 12.1.2.4. SWOT Analysis
- 12.1.3 Amgen Inc
- 12.1.3.1. Company Overview
- 12.1.3.2. Products
- 12.1.3.3. Company Financials
- 12.1.3.4. SWOT Analysis
- 12.1.4 Merck & Co Inc
- 12.1.4.1. Company Overview
- 12.1.4.2. Products
- 12.1.4.3. Company Financials
- 12.1.4.4. SWOT Analysis
- 12.1.5 F Hoffmann-La Roche Ltd
- 12.1.5.1. Company Overview
- 12.1.5.2. Products
- 12.1.5.3. Company Financials
- 12.1.5.4. SWOT Analysis
- 12.1.6 Spectrum Pharmaceuticals Inc
- 12.1.6.1. Company Overview
- 12.1.6.2. Products
- 12.1.6.3. Company Financials
- 12.1.6.4. SWOT Analysis
- 12.1.7 Eli Lilly and Company
- 12.1.7.1. Company Overview
- 12.1.7.2. Products
- 12.1.7.3. Company Financials
- 12.1.7.4. SWOT Analysis
- 12.1.8 Bristol Myers Squibb Company
- 12.1.8.1. Company Overview
- 12.1.8.2. Products
- 12.1.8.3. Company Financials
- 12.1.8.4. SWOT Analysis
- 12.1.9 Johnson & Johnson
- 12.1.9.1. Company Overview
- 12.1.9.2. Products
- 12.1.9.3. Company Financials
- 12.1.9.4. SWOT Analysis
- 12.1.10 GlaxoSmithKline PLC
- 12.1.10.1. Company Overview
- 12.1.10.2. Products
- 12.1.10.3. Company Financials
- 12.1.10.4. SWOT Analysis
- 12.1.1 Genmab AS
- 12.2. Market Entropy
- 12.2.1 Company's Key Areas Served
- 12.2.2 Recent Developments
- 12.3. Company Market Share Analysis 2025
- 12.3.1 Top 5 Companies Market Share Analysis
- 12.3.2 Top 3 Companies Market Share Analysis
- 12.4. List of Potential Customers
- 13. Research Methodology
List of Figures
- Figure 1: Cancer Monoclonal Antibodies Industry Revenue Breakdown (billion, %) by Product 2025 & 2033
- Figure 2: Cancer Monoclonal Antibodies Industry Share (%) by Company 2025
List of Tables
- Table 1: Cancer Monoclonal Antibodies Industry Revenue billion Forecast, by Types of Monoclonal Antibody 2020 & 2033
- Table 2: Cancer Monoclonal Antibodies Industry Volume K Unit Forecast, by Types of Monoclonal Antibody 2020 & 2033
- Table 3: Cancer Monoclonal Antibodies Industry Revenue billion Forecast, by Monoclonal Antibody Therapies 2020 & 2033
- Table 4: Cancer Monoclonal Antibodies Industry Volume K Unit Forecast, by Monoclonal Antibody Therapies 2020 & 2033
- Table 5: Cancer Monoclonal Antibodies Industry Revenue billion Forecast, by Application 2020 & 2033
- Table 6: Cancer Monoclonal Antibodies Industry Volume K Unit Forecast, by Application 2020 & 2033
- Table 7: Cancer Monoclonal Antibodies Industry Revenue billion Forecast, by Region 2020 & 2033
- Table 8: Cancer Monoclonal Antibodies Industry Volume K Unit Forecast, by Region 2020 & 2033
- Table 9: Cancer Monoclonal Antibodies Industry Revenue billion Forecast, by Types of Monoclonal Antibody 2020 & 2033
- Table 10: Cancer Monoclonal Antibodies Industry Volume K Unit Forecast, by Types of Monoclonal Antibody 2020 & 2033
- Table 11: Cancer Monoclonal Antibodies Industry Revenue billion Forecast, by Monoclonal Antibody Therapies 2020 & 2033
- Table 12: Cancer Monoclonal Antibodies Industry Volume K Unit Forecast, by Monoclonal Antibody Therapies 2020 & 2033
- Table 13: Cancer Monoclonal Antibodies Industry Revenue billion Forecast, by Application 2020 & 2033
- Table 14: Cancer Monoclonal Antibodies Industry Volume K Unit Forecast, by Application 2020 & 2033
- Table 15: Cancer Monoclonal Antibodies Industry Revenue billion Forecast, by Country 2020 & 2033
- Table 16: Cancer Monoclonal Antibodies Industry Volume K Unit Forecast, by Country 2020 & 2033
- Table 17: United States Cancer Monoclonal Antibodies Industry Revenue (billion) Forecast, by Application 2020 & 2033
- Table 18: United States Cancer Monoclonal Antibodies Industry Volume (K Unit) Forecast, by Application 2020 & 2033
- Table 19: Canada Cancer Monoclonal Antibodies Industry Revenue (billion) Forecast, by Application 2020 & 2033
- Table 20: Canada Cancer Monoclonal Antibodies Industry Volume (K Unit) Forecast, by Application 2020 & 2033
- Table 21: Mexico Cancer Monoclonal Antibodies Industry Revenue (billion) Forecast, by Application 2020 & 2033
- Table 22: Mexico Cancer Monoclonal Antibodies Industry Volume (K Unit) Forecast, by Application 2020 & 2033
- Table 23: Cancer Monoclonal Antibodies Industry Revenue billion Forecast, by Types of Monoclonal Antibody 2020 & 2033
- Table 24: Cancer Monoclonal Antibodies Industry Volume K Unit Forecast, by Types of Monoclonal Antibody 2020 & 2033
- Table 25: Cancer Monoclonal Antibodies Industry Revenue billion Forecast, by Monoclonal Antibody Therapies 2020 & 2033
- Table 26: Cancer Monoclonal Antibodies Industry Volume K Unit Forecast, by Monoclonal Antibody Therapies 2020 & 2033
- Table 27: Cancer Monoclonal Antibodies Industry Revenue billion Forecast, by Application 2020 & 2033
- Table 28: Cancer Monoclonal Antibodies Industry Volume K Unit Forecast, by Application 2020 & 2033
- Table 29: Cancer Monoclonal Antibodies Industry Revenue billion Forecast, by Country 2020 & 2033
- Table 30: Cancer Monoclonal Antibodies Industry Volume K Unit Forecast, by Country 2020 & 2033
- Table 31: Germany Cancer Monoclonal Antibodies Industry Revenue (billion) Forecast, by Application 2020 & 2033
- Table 32: Germany Cancer Monoclonal Antibodies Industry Volume (K Unit) Forecast, by Application 2020 & 2033
- Table 33: United Kingdom Cancer Monoclonal Antibodies Industry Revenue (billion) Forecast, by Application 2020 & 2033
- Table 34: United Kingdom Cancer Monoclonal Antibodies Industry Volume (K Unit) Forecast, by Application 2020 & 2033
- Table 35: France Cancer Monoclonal Antibodies Industry Revenue (billion) Forecast, by Application 2020 & 2033
- Table 36: France Cancer Monoclonal Antibodies Industry Volume (K Unit) Forecast, by Application 2020 & 2033
- Table 37: Italy Cancer Monoclonal Antibodies Industry Revenue (billion) Forecast, by Application 2020 & 2033
- Table 38: Italy Cancer Monoclonal Antibodies Industry Volume (K Unit) Forecast, by Application 2020 & 2033
- Table 39: Spain Cancer Monoclonal Antibodies Industry Revenue (billion) Forecast, by Application 2020 & 2033
- Table 40: Spain Cancer Monoclonal Antibodies Industry Volume (K Unit) Forecast, by Application 2020 & 2033
- Table 41: Rest of Europe Cancer Monoclonal Antibodies Industry Revenue (billion) Forecast, by Application 2020 & 2033
- Table 42: Rest of Europe Cancer Monoclonal Antibodies Industry Volume (K Unit) Forecast, by Application 2020 & 2033
- Table 43: Cancer Monoclonal Antibodies Industry Revenue billion Forecast, by Types of Monoclonal Antibody 2020 & 2033
- Table 44: Cancer Monoclonal Antibodies Industry Volume K Unit Forecast, by Types of Monoclonal Antibody 2020 & 2033
- Table 45: Cancer Monoclonal Antibodies Industry Revenue billion Forecast, by Monoclonal Antibody Therapies 2020 & 2033
- Table 46: Cancer Monoclonal Antibodies Industry Volume K Unit Forecast, by Monoclonal Antibody Therapies 2020 & 2033
- Table 47: Cancer Monoclonal Antibodies Industry Revenue billion Forecast, by Application 2020 & 2033
- Table 48: Cancer Monoclonal Antibodies Industry Volume K Unit Forecast, by Application 2020 & 2033
- Table 49: Cancer Monoclonal Antibodies Industry Revenue billion Forecast, by Country 2020 & 2033
- Table 50: Cancer Monoclonal Antibodies Industry Volume K Unit Forecast, by Country 2020 & 2033
- Table 51: China Cancer Monoclonal Antibodies Industry Revenue (billion) Forecast, by Application 2020 & 2033
- Table 52: China Cancer Monoclonal Antibodies Industry Volume (K Unit) Forecast, by Application 2020 & 2033
- Table 53: Japan Cancer Monoclonal Antibodies Industry Revenue (billion) Forecast, by Application 2020 & 2033
- Table 54: Japan Cancer Monoclonal Antibodies Industry Volume (K Unit) Forecast, by Application 2020 & 2033
- Table 55: India Cancer Monoclonal Antibodies Industry Revenue (billion) Forecast, by Application 2020 & 2033
- Table 56: India Cancer Monoclonal Antibodies Industry Volume (K Unit) Forecast, by Application 2020 & 2033
- Table 57: Australia Cancer Monoclonal Antibodies Industry Revenue (billion) Forecast, by Application 2020 & 2033
- Table 58: Australia Cancer Monoclonal Antibodies Industry Volume (K Unit) Forecast, by Application 2020 & 2033
- Table 59: South korea Cancer Monoclonal Antibodies Industry Revenue (billion) Forecast, by Application 2020 & 2033
- Table 60: South korea Cancer Monoclonal Antibodies Industry Volume (K Unit) Forecast, by Application 2020 & 2033
- Table 61: Rest of Asia Pacific Cancer Monoclonal Antibodies Industry Revenue (billion) Forecast, by Application 2020 & 2033
- Table 62: Rest of Asia Pacific Cancer Monoclonal Antibodies Industry Volume (K Unit) Forecast, by Application 2020 & 2033
- Table 63: Cancer Monoclonal Antibodies Industry Revenue billion Forecast, by Types of Monoclonal Antibody 2020 & 2033
- Table 64: Cancer Monoclonal Antibodies Industry Volume K Unit Forecast, by Types of Monoclonal Antibody 2020 & 2033
- Table 65: Cancer Monoclonal Antibodies Industry Revenue billion Forecast, by Monoclonal Antibody Therapies 2020 & 2033
- Table 66: Cancer Monoclonal Antibodies Industry Volume K Unit Forecast, by Monoclonal Antibody Therapies 2020 & 2033
- Table 67: Cancer Monoclonal Antibodies Industry Revenue billion Forecast, by Application 2020 & 2033
- Table 68: Cancer Monoclonal Antibodies Industry Volume K Unit Forecast, by Application 2020 & 2033
- Table 69: Cancer Monoclonal Antibodies Industry Revenue billion Forecast, by Country 2020 & 2033
- Table 70: Cancer Monoclonal Antibodies Industry Volume K Unit Forecast, by Country 2020 & 2033
- Table 71: GCC Cancer Monoclonal Antibodies Industry Revenue (billion) Forecast, by Application 2020 & 2033
- Table 72: GCC Cancer Monoclonal Antibodies Industry Volume (K Unit) Forecast, by Application 2020 & 2033
- Table 73: South Africa Cancer Monoclonal Antibodies Industry Revenue (billion) Forecast, by Application 2020 & 2033
- Table 74: South Africa Cancer Monoclonal Antibodies Industry Volume (K Unit) Forecast, by Application 2020 & 2033
- Table 75: Rest of Middle East and Africa Cancer Monoclonal Antibodies Industry Revenue (billion) Forecast, by Application 2020 & 2033
- Table 76: Rest of Middle East and Africa Cancer Monoclonal Antibodies Industry Volume (K Unit) Forecast, by Application 2020 & 2033
- Table 77: Cancer Monoclonal Antibodies Industry Revenue billion Forecast, by Types of Monoclonal Antibody 2020 & 2033
- Table 78: Cancer Monoclonal Antibodies Industry Volume K Unit Forecast, by Types of Monoclonal Antibody 2020 & 2033
- Table 79: Cancer Monoclonal Antibodies Industry Revenue billion Forecast, by Monoclonal Antibody Therapies 2020 & 2033
- Table 80: Cancer Monoclonal Antibodies Industry Volume K Unit Forecast, by Monoclonal Antibody Therapies 2020 & 2033
- Table 81: Cancer Monoclonal Antibodies Industry Revenue billion Forecast, by Application 2020 & 2033
- Table 82: Cancer Monoclonal Antibodies Industry Volume K Unit Forecast, by Application 2020 & 2033
- Table 83: Cancer Monoclonal Antibodies Industry Revenue billion Forecast, by Country 2020 & 2033
- Table 84: Cancer Monoclonal Antibodies Industry Volume K Unit Forecast, by Country 2020 & 2033
- Table 85: Brazil Cancer Monoclonal Antibodies Industry Revenue (billion) Forecast, by Application 2020 & 2033
- Table 86: Brazil Cancer Monoclonal Antibodies Industry Volume (K Unit) Forecast, by Application 2020 & 2033
- Table 87: Argentina Cancer Monoclonal Antibodies Industry Revenue (billion) Forecast, by Application 2020 & 2033
- Table 88: Argentina Cancer Monoclonal Antibodies Industry Volume (K Unit) Forecast, by Application 2020 & 2033
- Table 89: Rest of South America Cancer Monoclonal Antibodies Industry Revenue (billion) Forecast, by Application 2020 & 2033
- Table 90: Rest of South America Cancer Monoclonal Antibodies Industry Volume (K Unit) Forecast, by Application 2020 & 2033
Frequently Asked Questions
1. What is the projected Compound Annual Growth Rate (CAGR) of the Cancer Monoclonal Antibodies Industry?
The projected CAGR is approximately 8.2%.
2. Which companies are prominent players in the Cancer Monoclonal Antibodies Industry?
Key companies in the market include Genmab AS, Novartis AG, Amgen Inc, Merck & Co Inc, F Hoffmann-La Roche Ltd, Spectrum Pharmaceuticals Inc , Eli Lilly and Company, Bristol Myers Squibb Company, Johnson & Johnson, GlaxoSmithKline PLC.
3. What are the main segments of the Cancer Monoclonal Antibodies Industry?
The market segments include Types of Monoclonal Antibody, Monoclonal Antibody Therapies, Application.
4. Can you provide details about the market size?
The market size is estimated to be USD 286.32 billion as of 2022.
5. What are some drivers contributing to market growth?
Growing Prevalence of Cancer; Increasing Investment in Research and Development of Genomic Studies; Rising Advancements and Preference toward Specificity of Monoclonal Antibodies to Target Cancer.
6. What are the notable trends driving market growth?
Trastuzumab (Herceptin) is Expected to Hold Significant Market Share in Monoclonal Antibody Therapies.
7. Are there any restraints impacting market growth?
Stringent Regulatory Guidelines; Long Duration of Research and Development with Rising Failures in Clinical Trials.
8. Can you provide examples of recent developments in the market?
In February 2022, the Janssen Pharmaceutical Companies of Johnson & Johnson received United States Food and Drug Administration (FDA) approval for CARVYKTI (ciltacabtagene autoleucel; cilta-cel) for the treatment of adults with relapsed or refractory multiple myeloma (RRMM) after four or more prior lines of therapy, including a proteasome inhibitor, an immunomodulatory agent, and an anti-CD38 monoclonal antibody.
9. What pricing options are available for accessing the report?
Pricing options include single-user, multi-user, and enterprise licenses priced at USD 3800, USD 4500, and USD 5800 respectively.
10. Is the market size provided in terms of value or volume?
The market size is provided in terms of value, measured in billion and volume, measured in K Unit.
11. Are there any specific market keywords associated with the report?
Yes, the market keyword associated with the report is "Cancer Monoclonal Antibodies Industry," which aids in identifying and referencing the specific market segment covered.
12. How do I determine which pricing option suits my needs best?
The pricing options vary based on user requirements and access needs. Individual users may opt for single-user licenses, while businesses requiring broader access may choose multi-user or enterprise licenses for cost-effective access to the report.
13. Are there any additional resources or data provided in the Cancer Monoclonal Antibodies Industry report?
While the report offers comprehensive insights, it's advisable to review the specific contents or supplementary materials provided to ascertain if additional resources or data are available.
14. How can I stay updated on further developments or reports in the Cancer Monoclonal Antibodies Industry?
To stay informed about further developments, trends, and reports in the Cancer Monoclonal Antibodies Industry, consider subscribing to industry newsletters, following relevant companies and organizations, or regularly checking reputable industry news sources and publications.
Methodology
Step 1 - Identification of Relevant Samples Size from Population Database


Step 2 - Approaches for Defining Global Market Size (Value, Volume* & Price*)

Note*: In applicable scenarios
Step 3 - Data Sources
Primary Research
- Web Analytics
- Survey Reports
- Research Institute
- Latest Research Reports
- Opinion Leaders
Secondary Research
- Annual Reports
- White Paper
- Latest Press Release
- Industry Association
- Paid Database
- Investor Presentations

Step 4 - Data Triangulation
Involves using different sources of information in order to increase the validity of a study
These sources are likely to be stakeholders in a program - participants, other researchers, program staff, other community members, and so on.
Then we put all data in single framework & apply various statistical tools to find out the dynamic on the market.
During the analysis stage, feedback from the stakeholder groups would be compared to determine areas of agreement as well as areas of divergence