

Key Insights
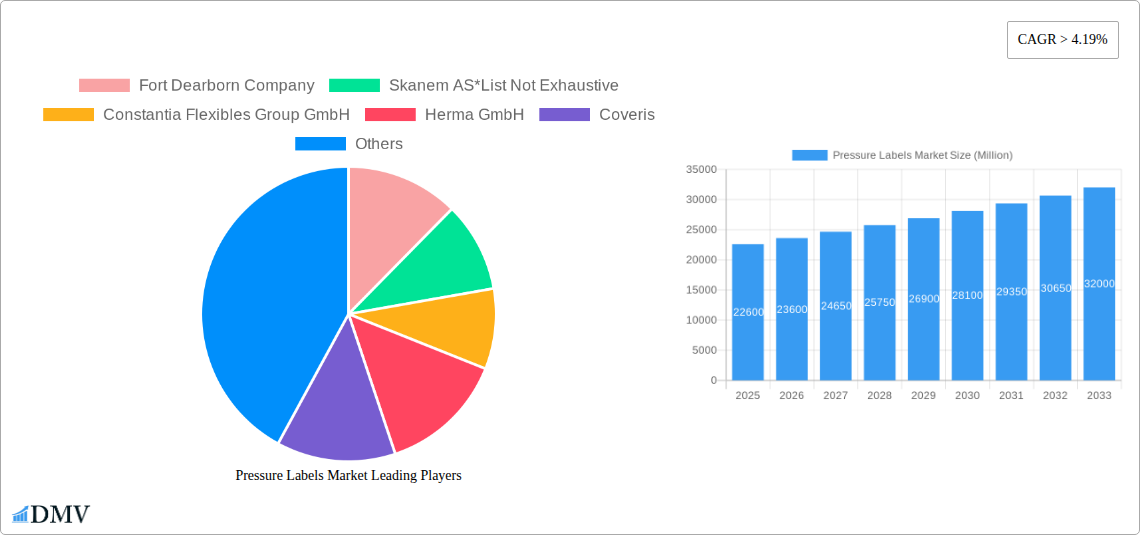
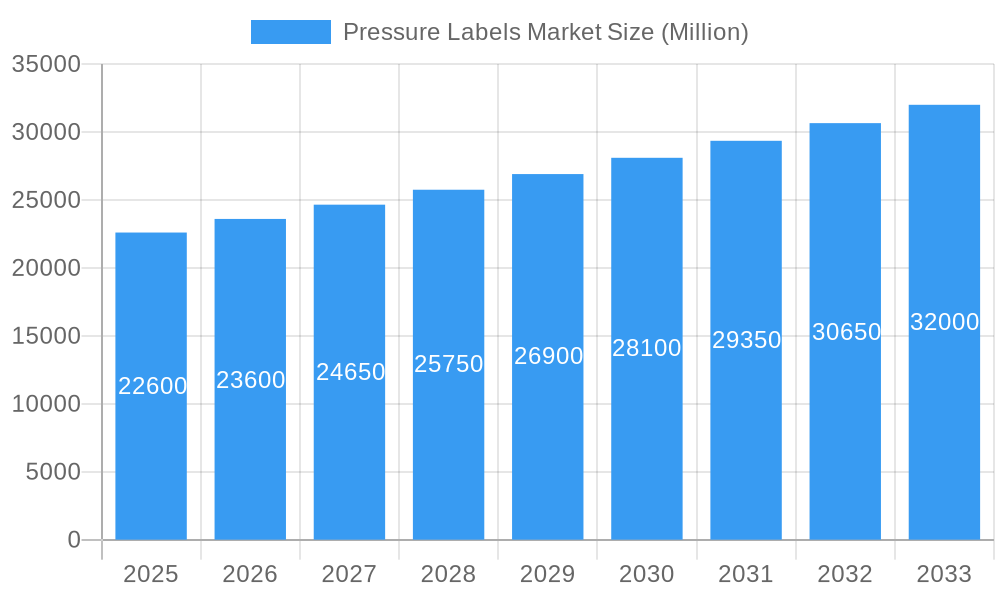
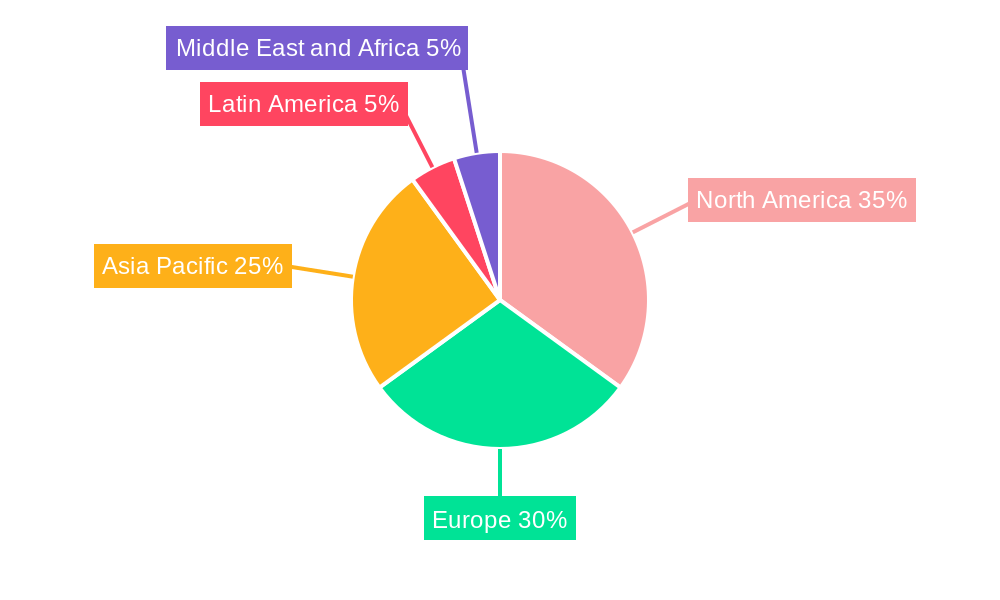
The pressure-sensitive label market, valued at $22.60 billion in 2025, is experiencing robust growth, projected to expand at a Compound Annual Growth Rate (CAGR) exceeding 4.19% from 2025 to 2033. This growth is driven by several factors. The burgeoning food and beverage industry, with its increasing demand for attractive and informative product labels, is a significant contributor. Similarly, the healthcare sector's reliance on tamper-evident and detailed labeling for pharmaceuticals and medical devices fuels market expansion. E-commerce growth also plays a crucial role, necessitating efficient and durable labels for shipping and product identification. Technological advancements in printing processes, particularly the adoption of digital printing technologies like inkjet, offer greater flexibility and customization options, further boosting market demand. The rise of sustainable and eco-friendly label materials is also a key trend, impacting material choices and manufacturing processes. However, fluctuating raw material prices and potential regulatory changes pose challenges to sustained growth. Market segmentation reveals that the food and beverage sector currently holds the largest share, followed by healthcare and cosmetics. Gravure printing remains dominant, although flexography and inkjet are gaining traction due to their cost-effectiveness and customization potential. Geographically, North America and Europe currently dominate the market, but the Asia-Pacific region is poised for significant growth due to its expanding manufacturing and consumer goods sectors. Key players like Avery Dennison, CCL Industries, and others are strategically investing in innovation and expansion to capitalize on this growth trajectory.
Pressure Labels Market Market Size (In Billion)
The competitive landscape is characterized by both large multinational corporations and specialized regional players. Companies are focusing on innovation in materials science to meet the increasing demand for sustainable and high-performance labels. This includes the development of recyclable and compostable materials, as well as labels with enhanced durability and printability. Strategic partnerships and mergers and acquisitions are also prevalent, allowing companies to broaden their product portfolios and expand into new geographical markets. The future of the pressure-sensitive label market looks bright, driven by continuous innovation, changing consumer preferences, and the growth of diverse end-use sectors. However, companies must navigate economic volatility and adapt to evolving regulatory landscapes to ensure sustained success. Careful market analysis, coupled with targeted strategic investments, will be crucial for navigating the dynamic landscape and maximizing returns in the years to come.
Pressure Labels Market Company Market Share
Pressure Sensitive Labels Market: A Comprehensive Report (2019-2033)
This insightful report provides a comprehensive analysis of the global pressure sensitive labels market, offering a detailed perspective on market dynamics, growth drivers, challenges, and future opportunities. The study period spans from 2019 to 2033, with 2025 serving as the base and estimated year. This report is crucial for stakeholders seeking to understand the intricacies of this dynamic market and make informed strategic decisions. The market is projected to reach xx Million by 2033, exhibiting a CAGR of xx% during the forecast period (2025-2033).
Pressure Labels Market Composition & Trends
This section delves into the competitive landscape of the pressure sensitive labels market, analyzing market concentration, innovation, regulations, substitute products, end-user profiles, and mergers and acquisitions (M&A) activity. The market exhibits a moderately consolidated structure, with key players holding significant market share.
Market Share Distribution: The top five players, including Avery Dennison Corp, CCL Industries Inc, UPM Raflatac Inc, and others, collectively account for approximately xx% of the global market share in 2025. Smaller players and regional manufacturers together constitute the remaining share.
Innovation Catalysts: Continuous advancements in printing technologies (e.g., inkjet, flexography) and the development of specialized adhesive materials are driving innovation. Sustainability concerns are also pushing the adoption of eco-friendly materials.
Regulatory Landscape: Stringent regulations concerning food safety and product labeling are shaping market trends, prompting manufacturers to adopt compliant materials and processes.
Substitute Products: While pressure sensitive labels remain the dominant choice, alternative labeling solutions, such as shrink sleeves, are competing for market share in specific applications.
End-User Profiles: The diverse end-user industries, including food & beverage, healthcare, cosmetics, and industrial sectors, present varied demands, influencing product development and customization.
M&A Activities: The pressure sensitive labels market has witnessed significant M&A activity in recent years. For example, the recapitalization of Online Labels Group by Sentinel Capital Partners in December 2023 signals the ongoing consolidation within the industry. The total value of M&A deals in the past five years is estimated at xx Million.
Pressure Labels Market Industry Evolution
The pressure sensitive labels market has experienced substantial growth over the historical period (2019-2024), driven by increasing demand across various end-use sectors. The market's evolution is characterized by several key trends:
Growth Trajectories: The market experienced a CAGR of xx% from 2019 to 2024, fueled by expanding e-commerce, rising consumer demand, and technological advancements in labeling solutions. The forecast period (2025-2033) anticipates a continued growth trajectory, albeit at a slightly moderated pace due to factors such as economic fluctuations and potential supply chain disruptions.
Technological Advancements: The shift towards digital printing technologies, such as inkjet, offers increased flexibility, customization, and shorter lead times. The adoption rate of digital printing is projected to increase from xx% in 2025 to xx% by 2033. Innovations in materials science, like Innovia Films' Rayoface AQBSA launch in April 2023, are enhancing the performance and sustainability of pressure sensitive labels.
Shifting Consumer Demands: Growing consumer awareness of sustainability is driving demand for eco-friendly labels made from recycled or renewable materials. This trend is further accentuated by stricter environmental regulations in various regions globally. The demand for sustainable labels is expected to grow at a CAGR of xx% during the forecast period.
Leading Regions, Countries, or Segments in Pressure Labels Market
The North American region holds a dominant position in the global pressure sensitive labels market, driven by factors such as robust manufacturing capabilities, well-established distribution networks, and strong end-user demand. Within this region, the U.S. leads due to its large and diverse economy. Asia-Pacific is witnessing rapid growth, driven primarily by expanding industrialization and consumption in developing economies.
By End-User Industry: The food and beverage industry represents the largest segment, followed by healthcare and cosmetics. The industrial sector, including automotive and consumer durables, is also a significant contributor to market growth.
By Print Process: Flexography remains the dominant print process due to its cost-effectiveness and versatility. However, inkjet printing is gaining traction, particularly in short-run and customized labeling applications.
Key Drivers: Strong economic growth, expansion of the e-commerce sector, and increasing demand for product differentiation are key drivers within the dominant regions and segments. Government support for domestic manufacturing and regulatory initiatives promoting eco-friendly packaging are also contributing factors.
Pressure Labels Market Product Innovations
Recent innovations in pressure-sensitive labels are revolutionizing their application and performance. These advancements include the development of cutting-edge adhesive technologies that offer superior adhesion, enhanced durability, and exceptional performance across an even wider array of surfaces, from challenging textures to extreme temperatures. Furthermore, the industry is witnessing the creation of specialized materials engineered for superior printability, enabling vibrant graphics and intricate designs, alongside a strong emphasis on sustainability. This includes the growing adoption of biodegradable, compostable, and recycled materials, directly addressing the escalating demand for eco-conscious labeling solutions. New product applications are rapidly emerging in highly specialized and demanding sectors such as pharmaceuticals, where tamper-evident and sterile labels are crucial, and the electronics industry, requiring labels that withstand electrostatic discharge and are compatible with delicate components.
Propelling Factors for Pressure Labels Market Growth
A confluence of dynamic forces is fueling the robust expansion of the pressure-sensitive labels market:
- Technological Advancements: Continuous innovation in printing technologies, including digital printing and specialized finishing techniques, coupled with the development of advanced substrate and adhesive materials, is dramatically expanding the application possibilities and significantly enhancing the overall performance and functionality of pressure-sensitive labels.
- E-commerce Boom and Supply Chain Optimization: The exponential growth of online retail and the increasing complexity of global supply chains necessitate highly efficient, durable, and informative labeling solutions for effective product identification, tracking, logistics, and consumer engagement.
- Growing Demand for Customization and Branding: Consumers increasingly seek unique and personalized products. This translates into a strong demand for custom-designed, branded labels that enhance shelf appeal, communicate brand identity, and foster a stronger connection with the consumer.
- Increasing Emphasis on Product Information and Traceability: Regulations and consumer expectations are driving the need for more comprehensive product information, including nutritional facts, ingredient lists, and origin details. Pressure-sensitive labels are ideal for incorporating variable data printing, QR codes, and other track-and-trace technologies.
Obstacles in the Pressure Labels Market Market
The market faces several challenges:
- Fluctuating raw material prices: Volatility in the prices of adhesives, substrates, and inks can impact production costs.
- Supply chain disruptions: Global events and logistical challenges can hinder the timely delivery of raw materials.
- Intense competition: Numerous established and emerging players compete for market share.
Future Opportunities in Pressure Labels Market
The future trajectory of the pressure-sensitive labels market is rife with promising opportunities:
- Sustainable and Eco-Friendly Material Innovation: The imperative for environmental responsibility will drive further development and adoption of fully biodegradable, compostable, and extensively recycled label materials, aligning with global sustainability goals and increasing consumer preference for green products.
- Integration of Smart Labels and Advanced Technologies: The incorporation of smart technologies, such as RFID, NFC, and embedded sensors, will unlock new functionalities, significantly enhancing product traceability, authenticity verification, supply chain visibility, and even enabling direct consumer interaction through smart packaging.
- Expansion into High-Growth Emerging Markets: Rapid industrialization and rising consumer spending in developing economies present substantial untapped growth potential for pressure-sensitive labels across various sectors, from consumer goods to industrial applications.
- Development of Specialized Labels for Niche Applications: Continued exploration and creation of labels tailored for highly specific and evolving needs within industries like healthcare (e.g., temperature-sensitive labels for vaccines), automotive (e.g., durable labels for engine components), and industrial automation will open new revenue streams.
Major Players in the Pressure Labels Market Ecosystem
- Fort Dearborn Company
- Skanem AS
- Constantia Flexibles Group GmbH
- Herma GmbH
- Coveris
- Westrock Company
- Inland Printing Co Ltd
- UPM Raflatac Inc
- Taylor Corporation
- Huhtamaki Group
- CCL Industries Inc
- Avery Dennison Corp
- Fuji Seal International Inc
- Taghleef Industries Inc (Al Ghurair Group)
- Multicolor Corporation
- Folienprint RAKO GmbH
Key Developments in Pressure Labels Market Industry
- December 2023: Sentinel Capital Partners' recapitalization of Online Labels Group underscores a significant trend of consolidation and strategic investment within the pressure-sensitive labels sector, indicating a healthy and maturing market.
- April 2023: Innovia Films' introduction of Rayoface AQBSA, a novel printable film specifically designed for pressure-sensitive labeling, demonstrates ongoing innovation in material science, enhancing the capabilities and aesthetic potential of labels.
- Ongoing: Continuous advancements in digital printing technologies are enabling smaller print runs, faster turnaround times, and greater personalization capabilities, democratizing access to high-quality custom labels for businesses of all sizes.
Strategic Pressure Labels Market Market Forecast
The pressure-sensitive labels market is strategically positioned for sustained and significant growth throughout the forecast period (estimated from 2025-2033). This expansion will be propelled by the synergistic impact of ongoing technological advancements in materials and printing, the relentless growth of e-commerce and its demand for robust supply chain solutions, and the escalating consumer and regulatory drive towards customized and environmentally responsible labeling. The market's future potential is exceptionally promising, particularly as adoption of smart label technologies accelerates and emerging economies become more integrated into the global marketplace. These factors are projected to drive considerable market expansion, solidifying the indispensable role of pressure-sensitive labels as a vital component of the global packaging and broader consumer goods industries.
Pressure Labels Market Segmentation
-
1. Print Process
- 1.1. Gravure
- 1.2. Flexography
- 1.3. Screen
- 1.4. Letterpress
- 1.5. Inkjet
- 1.6. Other Pr
-
2. End-User Industry
- 2.1. Food
- 2.2. Beverage
- 2.3. Healthcare
- 2.4. Cosmetics
- 2.5. Household
- 2.6. Industri
- 2.7. Logistics
- 2.8. Other End-user Industries
Pressure Labels Market Segmentation By Geography
-
1. North America
- 1.1. United States
- 1.2. Canada
-
2. Europe
- 2.1. United Kingdom
- 2.2. Germany
- 2.3. France
- 2.4. Spain
- 2.5. Rest of Europe
-
3. Asia Pacific
- 3.1. China
- 3.2. India
- 3.3. Japan
- 3.4. Rest of Asia Pacific
- 4. Latin America
- 5. Middle East and Africa
Pressure Labels Market Regional Market Share
Geographic Coverage of Pressure Labels Market
Pressure Labels Market REPORT HIGHLIGHTS
| Aspects | Details |
|---|---|
| Study Period | 2020-2034 |
| Base Year | 2025 |
| Estimated Year | 2026 |
| Forecast Period | 2026-2034 |
| Historical Period | 2020-2025 |
| Growth Rate | CAGR of > 4.19% from 2020-2034 |
| Segmentation |
|
Table of Contents
- 1. Introduction
- 1.1. Research Scope
- 1.2. Market Segmentation
- 1.3. Research Objective
- 1.4. Definitions and Assumptions
- 2. Executive Summary
- 2.1. Market Snapshot
- 3. Market Dynamics
- 3.1. Market Drivers
- 3.2. Market Restrains
- 3.3. Market Trends
- 3.4. Market Opportunities
- 4. Market Factor Analysis
- 4.1. Porters Five Forces
- 4.1.1. Bargaining Power of Suppliers
- 4.1.2. Bargaining Power of Buyers
- 4.1.3. Threat of New Entrants
- 4.1.4. Threat of Substitutes
- 4.1.5. Competitive Rivalry
- 4.2. PESTEL analysis
- 4.3. BCG Analysis
- 4.3.1. Stars (High Growth, High Market Share)
- 4.3.2. Cash Cows (Low Growth, High Market Share)
- 4.3.3. Question Mark (High Growth, Low Market Share)
- 4.3.4. Dogs (Low Growth, Low Market Share)
- 4.4. Ansoff Matrix Analysis
- 4.5. Supply Chain Analysis
- 4.6. Regulatory Landscape
- 4.7. Current Market Potential and Opportunity Assessment (TAM–SAM–SOM Framework)
- 4.8. DMV Analyst Note
- 4.1. Porters Five Forces
- 5. Market Analysis, Insights and Forecast 2021-2033
- 5.1. Market Analysis, Insights and Forecast - by Print Process
- 5.1.1. Gravure
- 5.1.2. Flexography
- 5.1.3. Screen
- 5.1.4. Letterpress
- 5.1.5. Inkjet
- 5.1.6. Other Pr
- 5.2. Market Analysis, Insights and Forecast - by End-User Industry
- 5.2.1. Food
- 5.2.2. Beverage
- 5.2.3. Healthcare
- 5.2.4. Cosmetics
- 5.2.5. Household
- 5.2.6. Industri
- 5.2.7. Logistics
- 5.2.8. Other End-user Industries
- 5.3. Market Analysis, Insights and Forecast - by Region
- 5.3.1. North America
- 5.3.2. Europe
- 5.3.3. Asia Pacific
- 5.3.4. Latin America
- 5.3.5. Middle East and Africa
- 5.1. Market Analysis, Insights and Forecast - by Print Process
- 6. Global Pressure Labels Market Analysis, Insights and Forecast, 2021-2033
- 6.1. Market Analysis, Insights and Forecast - by Print Process
- 6.1.1. Gravure
- 6.1.2. Flexography
- 6.1.3. Screen
- 6.1.4. Letterpress
- 6.1.5. Inkjet
- 6.1.6. Other Pr
- 6.2. Market Analysis, Insights and Forecast - by End-User Industry
- 6.2.1. Food
- 6.2.2. Beverage
- 6.2.3. Healthcare
- 6.2.4. Cosmetics
- 6.2.5. Household
- 6.2.6. Industri
- 6.2.7. Logistics
- 6.2.8. Other End-user Industries
- 6.1. Market Analysis, Insights and Forecast - by Print Process
- 7. North America Pressure Labels Market Analysis, Insights and Forecast, 2020-2032
- 7.1. Market Analysis, Insights and Forecast - by Print Process
- 7.1.1. Gravure
- 7.1.2. Flexography
- 7.1.3. Screen
- 7.1.4. Letterpress
- 7.1.5. Inkjet
- 7.1.6. Other Pr
- 7.2. Market Analysis, Insights and Forecast - by End-User Industry
- 7.2.1. Food
- 7.2.2. Beverage
- 7.2.3. Healthcare
- 7.2.4. Cosmetics
- 7.2.5. Household
- 7.2.6. Industri
- 7.2.7. Logistics
- 7.2.8. Other End-user Industries
- 7.1. Market Analysis, Insights and Forecast - by Print Process
- 8. Europe Pressure Labels Market Analysis, Insights and Forecast, 2020-2032
- 8.1. Market Analysis, Insights and Forecast - by Print Process
- 8.1.1. Gravure
- 8.1.2. Flexography
- 8.1.3. Screen
- 8.1.4. Letterpress
- 8.1.5. Inkjet
- 8.1.6. Other Pr
- 8.2. Market Analysis, Insights and Forecast - by End-User Industry
- 8.2.1. Food
- 8.2.2. Beverage
- 8.2.3. Healthcare
- 8.2.4. Cosmetics
- 8.2.5. Household
- 8.2.6. Industri
- 8.2.7. Logistics
- 8.2.8. Other End-user Industries
- 8.1. Market Analysis, Insights and Forecast - by Print Process
- 9. Asia Pacific Pressure Labels Market Analysis, Insights and Forecast, 2020-2032
- 9.1. Market Analysis, Insights and Forecast - by Print Process
- 9.1.1. Gravure
- 9.1.2. Flexography
- 9.1.3. Screen
- 9.1.4. Letterpress
- 9.1.5. Inkjet
- 9.1.6. Other Pr
- 9.2. Market Analysis, Insights and Forecast - by End-User Industry
- 9.2.1. Food
- 9.2.2. Beverage
- 9.2.3. Healthcare
- 9.2.4. Cosmetics
- 9.2.5. Household
- 9.2.6. Industri
- 9.2.7. Logistics
- 9.2.8. Other End-user Industries
- 9.1. Market Analysis, Insights and Forecast - by Print Process
- 10. Latin America Pressure Labels Market Analysis, Insights and Forecast, 2020-2032
- 10.1. Market Analysis, Insights and Forecast - by Print Process
- 10.1.1. Gravure
- 10.1.2. Flexography
- 10.1.3. Screen
- 10.1.4. Letterpress
- 10.1.5. Inkjet
- 10.1.6. Other Pr
- 10.2. Market Analysis, Insights and Forecast - by End-User Industry
- 10.2.1. Food
- 10.2.2. Beverage
- 10.2.3. Healthcare
- 10.2.4. Cosmetics
- 10.2.5. Household
- 10.2.6. Industri
- 10.2.7. Logistics
- 10.2.8. Other End-user Industries
- 10.1. Market Analysis, Insights and Forecast - by Print Process
- 11. Middle East and Africa Pressure Labels Market Analysis, Insights and Forecast, 2020-2032
- 11.1. Market Analysis, Insights and Forecast - by Print Process
- 11.1.1. Gravure
- 11.1.2. Flexography
- 11.1.3. Screen
- 11.1.4. Letterpress
- 11.1.5. Inkjet
- 11.1.6. Other Pr
- 11.2. Market Analysis, Insights and Forecast - by End-User Industry
- 11.2.1. Food
- 11.2.2. Beverage
- 11.2.3. Healthcare
- 11.2.4. Cosmetics
- 11.2.5. Household
- 11.2.6. Industri
- 11.2.7. Logistics
- 11.2.8. Other End-user Industries
- 11.1. Market Analysis, Insights and Forecast - by Print Process
- 12. Competitive Analysis
- 12.1. Company Profiles
- 12.1.1 Fort Dearborn Company
- 12.1.1.1. Company Overview
- 12.1.1.2. Products
- 12.1.1.3. Company Financials
- 12.1.1.4. SWOT Analysis
- 12.1.2 Skanem AS*List Not Exhaustive
- 12.1.2.1. Company Overview
- 12.1.2.2. Products
- 12.1.2.3. Company Financials
- 12.1.2.4. SWOT Analysis
- 12.1.3 Constantia Flexibles Group GmbH
- 12.1.3.1. Company Overview
- 12.1.3.2. Products
- 12.1.3.3. Company Financials
- 12.1.3.4. SWOT Analysis
- 12.1.4 Herma GmbH
- 12.1.4.1. Company Overview
- 12.1.4.2. Products
- 12.1.4.3. Company Financials
- 12.1.4.4. SWOT Analysis
- 12.1.5 Coveris
- 12.1.5.1. Company Overview
- 12.1.5.2. Products
- 12.1.5.3. Company Financials
- 12.1.5.4. SWOT Analysis
- 12.1.6 Westrock Company
- 12.1.6.1. Company Overview
- 12.1.6.2. Products
- 12.1.6.3. Company Financials
- 12.1.6.4. SWOT Analysis
- 12.1.7 Inland Printing Co Ltd
- 12.1.7.1. Company Overview
- 12.1.7.2. Products
- 12.1.7.3. Company Financials
- 12.1.7.4. SWOT Analysis
- 12.1.8 UPM Raflatac Inc
- 12.1.8.1. Company Overview
- 12.1.8.2. Products
- 12.1.8.3. Company Financials
- 12.1.8.4. SWOT Analysis
- 12.1.9 Taylor Corporation
- 12.1.9.1. Company Overview
- 12.1.9.2. Products
- 12.1.9.3. Company Financials
- 12.1.9.4. SWOT Analysis
- 12.1.10 Huhtamaki Group
- 12.1.10.1. Company Overview
- 12.1.10.2. Products
- 12.1.10.3. Company Financials
- 12.1.10.4. SWOT Analysis
- 12.1.11 CCL Industries Inc
- 12.1.11.1. Company Overview
- 12.1.11.2. Products
- 12.1.11.3. Company Financials
- 12.1.11.4. SWOT Analysis
- 12.1.12 Avery Dennison Corp
- 12.1.12.1. Company Overview
- 12.1.12.2. Products
- 12.1.12.3. Company Financials
- 12.1.12.4. SWOT Analysis
- 12.1.13 Fuji Seal International Inc
- 12.1.13.1. Company Overview
- 12.1.13.2. Products
- 12.1.13.3. Company Financials
- 12.1.13.4. SWOT Analysis
- 12.1.14 Taghleef Industries Inc (Al Ghurair Group)
- 12.1.14.1. Company Overview
- 12.1.14.2. Products
- 12.1.14.3. Company Financials
- 12.1.14.4. SWOT Analysis
- 12.1.15 Multicolor Corporation
- 12.1.15.1. Company Overview
- 12.1.15.2. Products
- 12.1.15.3. Company Financials
- 12.1.15.4. SWOT Analysis
- 12.1.16 Folienprint RAKO GmbH
- 12.1.16.1. Company Overview
- 12.1.16.2. Products
- 12.1.16.3. Company Financials
- 12.1.16.4. SWOT Analysis
- 12.1.1 Fort Dearborn Company
- 12.2. Market Entropy
- 12.2.1 Company's Key Areas Served
- 12.2.2 Recent Developments
- 12.3. Company Market Share Analysis 2025
- 12.3.1 Top 5 Companies Market Share Analysis
- 12.3.2 Top 3 Companies Market Share Analysis
- 12.4. List of Potential Customers
- 13. Research Methodology
List of Figures
- Figure 1: Global Pressure Labels Market Revenue Breakdown (Million, %) by Region 2025 & 2033
- Figure 2: North America Pressure Labels Market Revenue (Million), by Print Process 2025 & 2033
- Figure 3: North America Pressure Labels Market Revenue Share (%), by Print Process 2025 & 2033
- Figure 4: North America Pressure Labels Market Revenue (Million), by End-User Industry 2025 & 2033
- Figure 5: North America Pressure Labels Market Revenue Share (%), by End-User Industry 2025 & 2033
- Figure 6: North America Pressure Labels Market Revenue (Million), by Country 2025 & 2033
- Figure 7: North America Pressure Labels Market Revenue Share (%), by Country 2025 & 2033
- Figure 8: Europe Pressure Labels Market Revenue (Million), by Print Process 2025 & 2033
- Figure 9: Europe Pressure Labels Market Revenue Share (%), by Print Process 2025 & 2033
- Figure 10: Europe Pressure Labels Market Revenue (Million), by End-User Industry 2025 & 2033
- Figure 11: Europe Pressure Labels Market Revenue Share (%), by End-User Industry 2025 & 2033
- Figure 12: Europe Pressure Labels Market Revenue (Million), by Country 2025 & 2033
- Figure 13: Europe Pressure Labels Market Revenue Share (%), by Country 2025 & 2033
- Figure 14: Asia Pacific Pressure Labels Market Revenue (Million), by Print Process 2025 & 2033
- Figure 15: Asia Pacific Pressure Labels Market Revenue Share (%), by Print Process 2025 & 2033
- Figure 16: Asia Pacific Pressure Labels Market Revenue (Million), by End-User Industry 2025 & 2033
- Figure 17: Asia Pacific Pressure Labels Market Revenue Share (%), by End-User Industry 2025 & 2033
- Figure 18: Asia Pacific Pressure Labels Market Revenue (Million), by Country 2025 & 2033
- Figure 19: Asia Pacific Pressure Labels Market Revenue Share (%), by Country 2025 & 2033
- Figure 20: Latin America Pressure Labels Market Revenue (Million), by Print Process 2025 & 2033
- Figure 21: Latin America Pressure Labels Market Revenue Share (%), by Print Process 2025 & 2033
- Figure 22: Latin America Pressure Labels Market Revenue (Million), by End-User Industry 2025 & 2033
- Figure 23: Latin America Pressure Labels Market Revenue Share (%), by End-User Industry 2025 & 2033
- Figure 24: Latin America Pressure Labels Market Revenue (Million), by Country 2025 & 2033
- Figure 25: Latin America Pressure Labels Market Revenue Share (%), by Country 2025 & 2033
- Figure 26: Middle East and Africa Pressure Labels Market Revenue (Million), by Print Process 2025 & 2033
- Figure 27: Middle East and Africa Pressure Labels Market Revenue Share (%), by Print Process 2025 & 2033
- Figure 28: Middle East and Africa Pressure Labels Market Revenue (Million), by End-User Industry 2025 & 2033
- Figure 29: Middle East and Africa Pressure Labels Market Revenue Share (%), by End-User Industry 2025 & 2033
- Figure 30: Middle East and Africa Pressure Labels Market Revenue (Million), by Country 2025 & 2033
- Figure 31: Middle East and Africa Pressure Labels Market Revenue Share (%), by Country 2025 & 2033
List of Tables
- Table 1: Global Pressure Labels Market Revenue Million Forecast, by Print Process 2020 & 2033
- Table 2: Global Pressure Labels Market Revenue Million Forecast, by End-User Industry 2020 & 2033
- Table 3: Global Pressure Labels Market Revenue Million Forecast, by Region 2020 & 2033
- Table 4: Global Pressure Labels Market Revenue Million Forecast, by Print Process 2020 & 2033
- Table 5: Global Pressure Labels Market Revenue Million Forecast, by End-User Industry 2020 & 2033
- Table 6: Global Pressure Labels Market Revenue Million Forecast, by Country 2020 & 2033
- Table 7: United States Pressure Labels Market Revenue (Million) Forecast, by Application 2020 & 2033
- Table 8: Canada Pressure Labels Market Revenue (Million) Forecast, by Application 2020 & 2033
- Table 9: Global Pressure Labels Market Revenue Million Forecast, by Print Process 2020 & 2033
- Table 10: Global Pressure Labels Market Revenue Million Forecast, by End-User Industry 2020 & 2033
- Table 11: Global Pressure Labels Market Revenue Million Forecast, by Country 2020 & 2033
- Table 12: United Kingdom Pressure Labels Market Revenue (Million) Forecast, by Application 2020 & 2033
- Table 13: Germany Pressure Labels Market Revenue (Million) Forecast, by Application 2020 & 2033
- Table 14: France Pressure Labels Market Revenue (Million) Forecast, by Application 2020 & 2033
- Table 15: Spain Pressure Labels Market Revenue (Million) Forecast, by Application 2020 & 2033
- Table 16: Rest of Europe Pressure Labels Market Revenue (Million) Forecast, by Application 2020 & 2033
- Table 17: Global Pressure Labels Market Revenue Million Forecast, by Print Process 2020 & 2033
- Table 18: Global Pressure Labels Market Revenue Million Forecast, by End-User Industry 2020 & 2033
- Table 19: Global Pressure Labels Market Revenue Million Forecast, by Country 2020 & 2033
- Table 20: China Pressure Labels Market Revenue (Million) Forecast, by Application 2020 & 2033
- Table 21: India Pressure Labels Market Revenue (Million) Forecast, by Application 2020 & 2033
- Table 22: Japan Pressure Labels Market Revenue (Million) Forecast, by Application 2020 & 2033
- Table 23: Rest of Asia Pacific Pressure Labels Market Revenue (Million) Forecast, by Application 2020 & 2033
- Table 24: Global Pressure Labels Market Revenue Million Forecast, by Print Process 2020 & 2033
- Table 25: Global Pressure Labels Market Revenue Million Forecast, by End-User Industry 2020 & 2033
- Table 26: Global Pressure Labels Market Revenue Million Forecast, by Country 2020 & 2033
- Table 27: Global Pressure Labels Market Revenue Million Forecast, by Print Process 2020 & 2033
- Table 28: Global Pressure Labels Market Revenue Million Forecast, by End-User Industry 2020 & 2033
- Table 29: Global Pressure Labels Market Revenue Million Forecast, by Country 2020 & 2033
Frequently Asked Questions
1. What is the projected Compound Annual Growth Rate (CAGR) of the Pressure Labels Market?
The projected CAGR is approximately > 4.19%.
2. Which companies are prominent players in the Pressure Labels Market?
Key companies in the market include Fort Dearborn Company, Skanem AS*List Not Exhaustive, Constantia Flexibles Group GmbH, Herma GmbH, Coveris, Westrock Company, Inland Printing Co Ltd, UPM Raflatac Inc, Taylor Corporation, Huhtamaki Group, CCL Industries Inc, Avery Dennison Corp, Fuji Seal International Inc, Taghleef Industries Inc (Al Ghurair Group), Multicolor Corporation, Folienprint RAKO GmbH.
3. What are the main segments of the Pressure Labels Market?
The market segments include Print Process, End-User Industry .
4. Can you provide details about the market size?
The market size is estimated to be USD 22.60 Million as of 2022.
5. What are some drivers contributing to market growth?
Evolution of Digital Print Technology.
6. What are the notable trends driving market growth?
Beverage End-User Segment is Expected to Drive Growth of Pressure Labels.
7. Are there any restraints impacting market growth?
Lack of Products with Ability to Withstand Harsh Climatic Conditions.
8. Can you provide examples of recent developments in the market?
December 2023 - Sentinel Capital Partners, a private equity firm that invests in midmarket companies, announced the recapitalization of Online Labels Group (OLG), one of the leading providers of pressure-sensitive labels, shrink sleeves, and flexible packaging solutions.
9. What pricing options are available for accessing the report?
Pricing options include single-user, multi-user, and enterprise licenses priced at USD 4750, USD 5250, and USD 8750 respectively.
10. Is the market size provided in terms of value or volume?
The market size is provided in terms of value, measured in Million.
11. Are there any specific market keywords associated with the report?
Yes, the market keyword associated with the report is "Pressure Labels Market," which aids in identifying and referencing the specific market segment covered.
12. How do I determine which pricing option suits my needs best?
The pricing options vary based on user requirements and access needs. Individual users may opt for single-user licenses, while businesses requiring broader access may choose multi-user or enterprise licenses for cost-effective access to the report.
13. Are there any additional resources or data provided in the Pressure Labels Market report?
While the report offers comprehensive insights, it's advisable to review the specific contents or supplementary materials provided to ascertain if additional resources or data are available.
14. How can I stay updated on further developments or reports in the Pressure Labels Market?
To stay informed about further developments, trends, and reports in the Pressure Labels Market, consider subscribing to industry newsletters, following relevant companies and organizations, or regularly checking reputable industry news sources and publications.
Methodology
Step 1 - Identification of Relevant Samples Size from Population Database


Step 2 - Approaches for Defining Global Market Size (Value, Volume* & Price*)

Note*: In applicable scenarios
Step 3 - Data Sources
Primary Research
- Web Analytics
- Survey Reports
- Research Institute
- Latest Research Reports
- Opinion Leaders
Secondary Research
- Annual Reports
- White Paper
- Latest Press Release
- Industry Association
- Paid Database
- Investor Presentations

Step 4 - Data Triangulation
Involves using different sources of information in order to increase the validity of a study
These sources are likely to be stakeholders in a program - participants, other researchers, program staff, other community members, and so on.
Then we put all data in single framework & apply various statistical tools to find out the dynamic on the market.
During the analysis stage, feedback from the stakeholder groups would be compared to determine areas of agreement as well as areas of divergence