

Key Insights
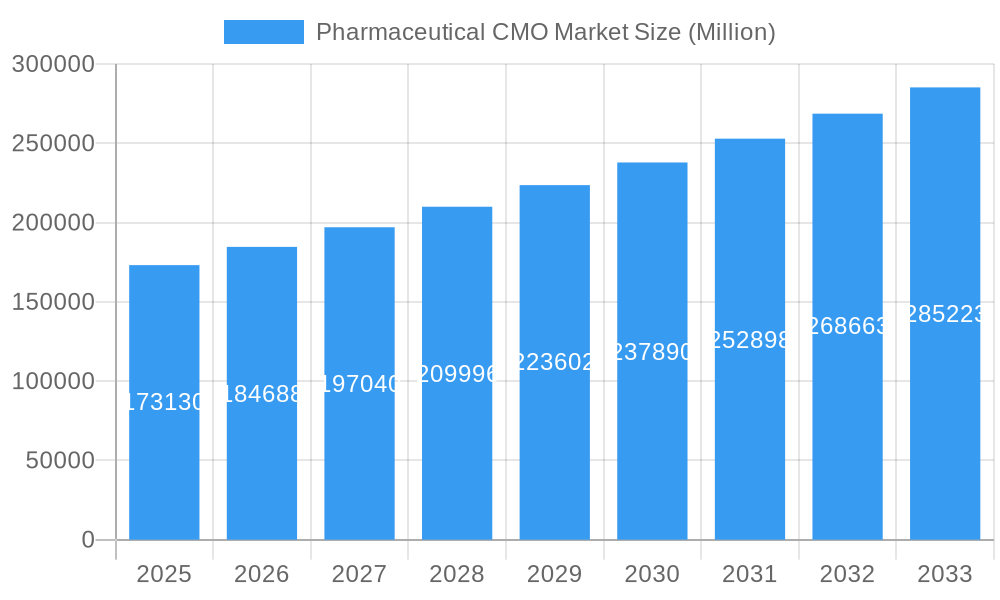
The global Pharmaceutical Contract Manufacturing Organization (CMO) market, valued at $173.13 billion in 2025, is projected to experience robust growth, driven by a CAGR of 6.53% from 2025 to 2033. This expansion is fueled by several key factors. The increasing complexity of drug development, coupled with rising R&D costs, is compelling pharmaceutical companies to outsource manufacturing processes to specialized CMOs. This allows them to focus on core competencies like drug discovery and clinical trials, while leveraging the expertise and economies of scale offered by CMOs. Further driving growth is the surge in demand for biologics, advanced therapies, and personalized medicines, which require specialized manufacturing capabilities often best provided by contract manufacturers. The market is segmented by service type, encompassing Active Pharmaceutical Ingredient (API) manufacturing, High Potency API (HPAPI), finished dosage formulation (FDF) development and manufacturing, solid dose (tablets, capsules, powders), and injectable dose formulations, each exhibiting distinct growth trajectories. Geographical distribution reveals strong market presence across North America, Europe, and Asia, with emerging markets in Latin America and the Middle East and Africa also contributing to the overall growth.
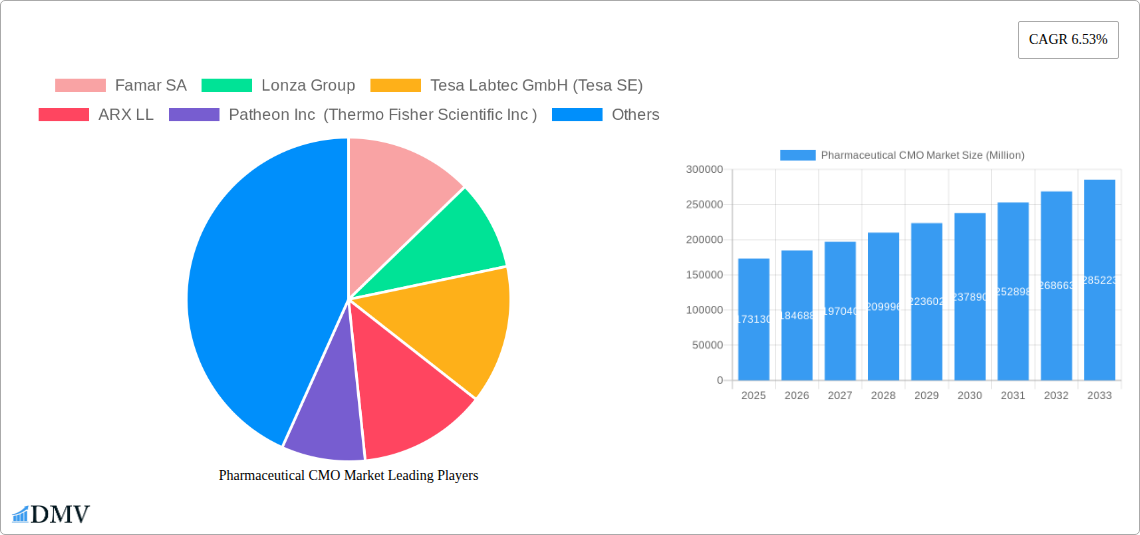
Pharmaceutical CMO Market Market Size (In Billion)
The competitive landscape is characterized by a mix of large multinational corporations and smaller, specialized CMOs. Established players like Lonza Group, Catalent Inc., and Thermo Fisher Scientific (through Patheon) hold significant market share, benefiting from their extensive infrastructure and diverse service offerings. However, smaller, agile CMOs are also making inroads, particularly in niche areas such as HPAPI manufacturing and advanced therapies. The market's future growth hinges on technological advancements in manufacturing processes, including automation and continuous manufacturing, as well as regulatory landscape changes and the ongoing evolution of drug development trends. The strategic partnerships, mergers, and acquisitions within the industry are further shaping its trajectory, leading to increased consolidation and enhanced service capabilities.
Pharmaceutical CMO Market Company Market Share
Pharmaceutical CMO Market: A Comprehensive Report (2019-2033)
This insightful report provides a detailed analysis of the Pharmaceutical Contract Manufacturing Organization (CMO) market, encompassing market size, growth drivers, competitive landscape, and future outlook. Covering the period from 2019 to 2033, with a focus on 2025, this report is an essential resource for stakeholders seeking to understand and capitalize on opportunities within this dynamic sector. The market is projected to reach xx Million by 2033, exhibiting a CAGR of xx% during the forecast period (2025-2033).
Pharmaceutical CMO Market Composition & Trends
The Pharmaceutical CMO market is characterized by a moderately concentrated landscape, with key players such as Catalent, Lonza, and Recipharm holding significant market share. However, a number of smaller, specialized CMOs are also thriving, catering to niche therapeutic areas and specific service needs. Market share distribution is dynamic, influenced by factors like technological advancements, M&A activity, and regulatory changes. Innovation is a crucial driver, with companies constantly striving to improve efficiency, reduce costs, and develop novel drug delivery systems. The regulatory landscape, particularly concerning GMP (Good Manufacturing Practices) and data integrity, heavily influences market operations. Substitute products are limited, as the specialized nature of CMO services necessitates stringent quality and regulatory compliance. End-users primarily comprise pharmaceutical and biotechnology companies, ranging from large multinational corporations to smaller startups.
M&A activity has been significant, with deal values exceeding xx Million in recent years. These activities often reflect strategic moves to expand service offerings, geographical reach, and technological capabilities.
- Market Concentration: Moderately concentrated, with top players holding xx% market share.
- Innovation Catalysts: Advancements in drug delivery systems, automation, and analytical technologies.
- Regulatory Landscape: Stringent GMP and data integrity regulations drive operational efficiency and quality control.
- Substitute Products: Limited; specialized nature of CMO services limits substitution.
- End-User Profile: Pharmaceutical and biotechnology companies of varying sizes.
- M&A Activity: Significant, with deal values exceeding xx Million in recent years, driving consolidation and expansion.
Pharmaceutical CMO Market Industry Evolution
The Pharmaceutical CMO market has witnessed significant growth over the past few years, driven by factors such as increasing outsourcing by pharmaceutical companies, the rise of biologics and specialty pharmaceuticals, and the growing demand for efficient and cost-effective manufacturing solutions. The market is experiencing a technological transformation, with the adoption of advanced technologies such as automation, artificial intelligence, and data analytics enhancing efficiency and productivity. Consumer demands, particularly regarding speed to market and product quality, are pushing the industry towards innovation and improved service delivery. This evolution has resulted in a shift towards specialized CMOs offering niche services and expertise in areas like HPAPI (High Potency API) manufacturing and cell and gene therapy.
- Market Growth Trajectory: Steady growth driven by outsourcing, biologics rise, and demand for efficient manufacturing.
- Technological Advancements: Adoption of automation, AI, and data analytics is enhancing efficiency and productivity.
- Shifting Consumer Demands: Emphasis on speed to market and product quality drives innovation.
Leading Regions, Countries, or Segments in Pharmaceutical CMO Market
North America currently dominates the Pharmaceutical CMO market, driven by factors such as a large pharmaceutical industry, robust regulatory frameworks, and significant investments in research and development. Europe and Asia Pacific are also significant markets, witnessing considerable growth. Within service types, Active Pharmaceutical Ingredient (API) Manufacturing and Finished Dosage Formulation (FDF) Development and Manufacturing (including High Potency API) are leading segments, driven by the increasing complexity of drug development and manufacturing processes.
- Key Drivers:
- North America: Large pharmaceutical industry, robust regulatory frameworks, high R&D investment.
- Europe: Established pharmaceutical industry, strong regulatory infrastructure.
- Asia Pacific: Rapid growth in pharmaceutical and biotech sectors, increasing outsourcing.
- API Manufacturing: Growing demand for complex APIs and outsourcing of API manufacturing.
- FDF Development and Manufacturing: Increase in complex formulations and outsourcing trend.
The dominance of North America stems from its mature pharmaceutical industry, robust regulatory support, significant investments in R&D, and a strong presence of major CMO players. Asia Pacific’s growth is fuelled by increasing domestic pharmaceutical production, a rising middle class, and cost advantages in manufacturing.
Pharmaceutical CMO Market Product Innovations
Significant advancements are emerging in drug delivery systems, such as the development of novel formulations (e.g., orally disintegrating tablets) and personalized medicine approaches. These innovations are driven by the need for improved patient compliance, efficacy, and safety. Technological advancements in process automation and analytics enable enhanced efficiency, reduced costs, and improved quality control. Unique selling propositions include faster turnaround times, specialized expertise in niche therapeutic areas, and a commitment to stringent quality standards.
Propelling Factors for Pharmaceutical CMO Market Growth
Technological advancements such as automation and advanced analytics are significantly boosting efficiency and reducing production costs. Favorable economic conditions and rising healthcare spending worldwide drive increased investment in pharmaceutical R&D, consequently fueling the demand for CMO services. Supportive regulatory environments encourage outsourcing and streamline the approval processes. For example, the increasing prevalence of biologics and specialty pharmaceuticals necessitates specialized manufacturing capabilities and fuels the demand for highly skilled CMO providers.
Obstacles in the Pharmaceutical CMO Market
Stringent regulatory compliance requirements and the need for substantial upfront investments create barriers for entry. Supply chain disruptions, particularly concerning raw materials and skilled labor, can significantly impact manufacturing efficiency and profitability. Intense competition among established CMOs and increasing pressure on pricing further add to the operational challenges faced by companies in this sector. For instance, a significant delay in regulatory approvals can cause significant financial setbacks for companies and negatively affect the development of the overall market.
Future Opportunities in Pharmaceutical CMO Market
Emerging markets in Asia and Africa present significant growth opportunities, as does the growing demand for cell and gene therapies and other advanced medicinal products. The integration of advanced technologies such as AI and machine learning is expected to further improve efficiency and product development. The increasing focus on personalized medicine and targeted therapies will create a growing need for specialized CMO services capable of handling complex manufacturing processes.
Major Players in the Pharmaceutical CMO Market Ecosystem
- Famar SA
- Lonza Group
- Tesa Labtec GmbH (Tesa SE)
- ARX LL
- Patheon Inc (Thermo Fisher Scientific Inc )
- Pfizer CentreSource (Pfizer Inc )
- Tapemark
- Aenova Holdings GmbH
- Catalent Inc
- Boehringer Ingelheim Group
- Recipharm AB
- Baxter Biopharma Solutions (Baxter International Inc )
- Jubilant Biosys Ltd (Jubilant Pharmova Ltd)
Key Developments in Pharmaceutical CMO Market Industry
- January 2023: Catalent signed a development and license agreement with Ethicann Pharmaceuticals Inc. to utilize Zydis ODT technology for cannabinoid drug therapies, impacting the market through innovation in drug delivery and expansion into the cannabinoid market.
- March 2023: Biose Industria opened a new facility in Boston, Massachusetts, strengthening its presence in the US market and potentially impacting market share.
- July 2023: Recipharm opened a new analytical laboratory in Bangalore, India, enhancing its global testing capabilities and boosting its competitiveness through increased capacity in nitrosamine, extractable, leachable, and elemental impurity testing.
Strategic Pharmaceutical CMO Market Forecast
The Pharmaceutical CMO market is poised for continued growth, driven by several key factors including increasing outsourcing trends within the pharmaceutical industry, technological advancements leading to enhanced efficiency and reduced costs, and an expanding market for advanced therapies. The demand for specialized services, such as HPAPI manufacturing and cell and gene therapy production, will continue to drive innovation and investment within the CMO sector. Expansion into emerging markets and strategic partnerships will further fuel growth and create a wider range of opportunities within the market.
Pharmaceutical CMO Market Segmentation
-
1. Service Type
-
1.1. Active P
- 1.1.1. Small Molecule
- 1.1.2. Large Molecule
- 1.1.3. High Potency API (HPAPI)
-
1.2. Finished
-
1.2.1. Solid Dose Formulation
- 1.2.1.1. Tablets
- 1.2.1.2. Other Types (Capsules, Powders, etc.)
- 1.2.2. Liquid Dose Formulation
- 1.2.3. Injectable Dose Formulation
-
1.2.1. Solid Dose Formulation
- 1.3. Secondary Packaging
-
1.1. Active P
Pharmaceutical CMO Market Segmentation By Geography
-
1. North America
- 1.1. United States
- 1.2. Canada
-
2. Europe
- 2.1. United Kingdom
- 2.2. Germany
- 2.3. France
- 2.4. Italy
- 2.5. Spain
-
3. Asia
- 3.1. China
- 3.2. India
- 3.3. Japan
- 3.4. Australia
- 4. Australia and New Zealand
-
5. Latin America
- 5.1. Brazil
- 5.2. Mexico
- 5.3. Argentina
-
6. Middle East and Africa
- 6.1. United Arab Emirates
- 6.2. Saudi Arabia
- 6.3. South Africa
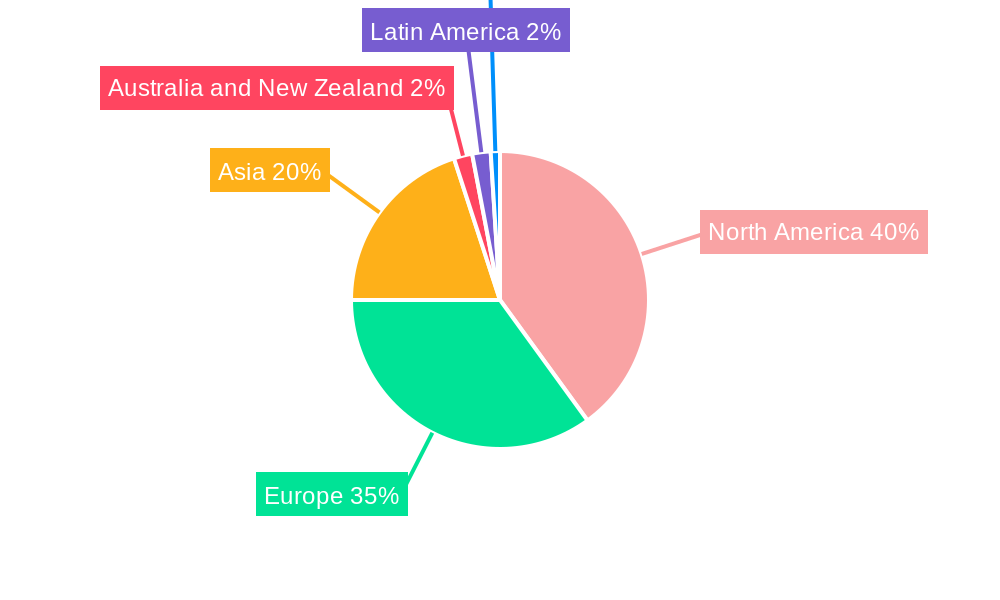
Pharmaceutical CMO Market Regional Market Share
Geographic Coverage of Pharmaceutical CMO Market
Pharmaceutical CMO Market REPORT HIGHLIGHTS
| Aspects | Details |
|---|---|
| Study Period | 2020-2034 |
| Base Year | 2025 |
| Estimated Year | 2026 |
| Forecast Period | 2026-2034 |
| Historical Period | 2020-2025 |
| Growth Rate | CAGR of 6.53% from 2020-2034 |
| Segmentation |
|
Table of Contents
- 1. Introduction
- 1.1. Research Scope
- 1.2. Market Segmentation
- 1.3. Research Objective
- 1.4. Definitions and Assumptions
- 2. Executive Summary
- 2.1. Market Snapshot
- 3. Market Dynamics
- 3.1. Market Drivers
- 3.2. Market Restrains
- 3.3. Market Trends
- 3.4. Market Opportunities
- 4. Market Factor Analysis
- 4.1. Porters Five Forces
- 4.1.1. Bargaining Power of Suppliers
- 4.1.2. Bargaining Power of Buyers
- 4.1.3. Threat of New Entrants
- 4.1.4. Threat of Substitutes
- 4.1.5. Competitive Rivalry
- 4.2. PESTEL analysis
- 4.3. BCG Analysis
- 4.3.1. Stars (High Growth, High Market Share)
- 4.3.2. Cash Cows (Low Growth, High Market Share)
- 4.3.3. Question Mark (High Growth, Low Market Share)
- 4.3.4. Dogs (Low Growth, Low Market Share)
- 4.4. Ansoff Matrix Analysis
- 4.5. Supply Chain Analysis
- 4.6. Regulatory Landscape
- 4.7. Current Market Potential and Opportunity Assessment (TAM–SAM–SOM Framework)
- 4.8. DMV Analyst Note
- 4.1. Porters Five Forces
- 5. Market Analysis, Insights and Forecast 2021-2033
- 5.1. Market Analysis, Insights and Forecast - by Service Type
- 5.1.1. Active P
- 5.1.1.1. Small Molecule
- 5.1.1.2. Large Molecule
- 5.1.1.3. High Potency API (HPAPI)
- 5.1.2. Finished
- 5.1.2.1. Solid Dose Formulation
- 5.1.2.1.1. Tablets
- 5.1.2.1.2. Other Types (Capsules, Powders, etc.)
- 5.1.2.2. Liquid Dose Formulation
- 5.1.2.3. Injectable Dose Formulation
- 5.1.2.1. Solid Dose Formulation
- 5.1.3. Secondary Packaging
- 5.1.1. Active P
- 5.2. Market Analysis, Insights and Forecast - by Region
- 5.2.1. North America
- 5.2.2. Europe
- 5.2.3. Asia
- 5.2.4. Australia and New Zealand
- 5.2.5. Latin America
- 5.2.6. Middle East and Africa
- 5.1. Market Analysis, Insights and Forecast - by Service Type
- 6. Global Pharmaceutical CMO Market Analysis, Insights and Forecast, 2021-2033
- 6.1. Market Analysis, Insights and Forecast - by Service Type
- 6.1.1. Active P
- 6.1.1.1. Small Molecule
- 6.1.1.2. Large Molecule
- 6.1.1.3. High Potency API (HPAPI)
- 6.1.2. Finished
- 6.1.2.1. Solid Dose Formulation
- 6.1.2.1.1. Tablets
- 6.1.2.1.2. Other Types (Capsules, Powders, etc.)
- 6.1.2.2. Liquid Dose Formulation
- 6.1.2.3. Injectable Dose Formulation
- 6.1.2.1. Solid Dose Formulation
- 6.1.3. Secondary Packaging
- 6.1.1. Active P
- 6.1. Market Analysis, Insights and Forecast - by Service Type
- 7. North America Pharmaceutical CMO Market Analysis, Insights and Forecast, 2020-2032
- 7.1. Market Analysis, Insights and Forecast - by Service Type
- 7.1.1. Active P
- 7.1.1.1. Small Molecule
- 7.1.1.2. Large Molecule
- 7.1.1.3. High Potency API (HPAPI)
- 7.1.2. Finished
- 7.1.2.1. Solid Dose Formulation
- 7.1.2.1.1. Tablets
- 7.1.2.1.2. Other Types (Capsules, Powders, etc.)
- 7.1.2.2. Liquid Dose Formulation
- 7.1.2.3. Injectable Dose Formulation
- 7.1.2.1. Solid Dose Formulation
- 7.1.3. Secondary Packaging
- 7.1.1. Active P
- 7.1. Market Analysis, Insights and Forecast - by Service Type
- 8. Europe Pharmaceutical CMO Market Analysis, Insights and Forecast, 2020-2032
- 8.1. Market Analysis, Insights and Forecast - by Service Type
- 8.1.1. Active P
- 8.1.1.1. Small Molecule
- 8.1.1.2. Large Molecule
- 8.1.1.3. High Potency API (HPAPI)
- 8.1.2. Finished
- 8.1.2.1. Solid Dose Formulation
- 8.1.2.1.1. Tablets
- 8.1.2.1.2. Other Types (Capsules, Powders, etc.)
- 8.1.2.2. Liquid Dose Formulation
- 8.1.2.3. Injectable Dose Formulation
- 8.1.2.1. Solid Dose Formulation
- 8.1.3. Secondary Packaging
- 8.1.1. Active P
- 8.1. Market Analysis, Insights and Forecast - by Service Type
- 9. Asia Pharmaceutical CMO Market Analysis, Insights and Forecast, 2020-2032
- 9.1. Market Analysis, Insights and Forecast - by Service Type
- 9.1.1. Active P
- 9.1.1.1. Small Molecule
- 9.1.1.2. Large Molecule
- 9.1.1.3. High Potency API (HPAPI)
- 9.1.2. Finished
- 9.1.2.1. Solid Dose Formulation
- 9.1.2.1.1. Tablets
- 9.1.2.1.2. Other Types (Capsules, Powders, etc.)
- 9.1.2.2. Liquid Dose Formulation
- 9.1.2.3. Injectable Dose Formulation
- 9.1.2.1. Solid Dose Formulation
- 9.1.3. Secondary Packaging
- 9.1.1. Active P
- 9.1. Market Analysis, Insights and Forecast - by Service Type
- 10. Australia and New Zealand Pharmaceutical CMO Market Analysis, Insights and Forecast, 2020-2032
- 10.1. Market Analysis, Insights and Forecast - by Service Type
- 10.1.1. Active P
- 10.1.1.1. Small Molecule
- 10.1.1.2. Large Molecule
- 10.1.1.3. High Potency API (HPAPI)
- 10.1.2. Finished
- 10.1.2.1. Solid Dose Formulation
- 10.1.2.1.1. Tablets
- 10.1.2.1.2. Other Types (Capsules, Powders, etc.)
- 10.1.2.2. Liquid Dose Formulation
- 10.1.2.3. Injectable Dose Formulation
- 10.1.2.1. Solid Dose Formulation
- 10.1.3. Secondary Packaging
- 10.1.1. Active P
- 10.1. Market Analysis, Insights and Forecast - by Service Type
- 11. Latin America Pharmaceutical CMO Market Analysis, Insights and Forecast, 2020-2032
- 11.1. Market Analysis, Insights and Forecast - by Service Type
- 11.1.1. Active P
- 11.1.1.1. Small Molecule
- 11.1.1.2. Large Molecule
- 11.1.1.3. High Potency API (HPAPI)
- 11.1.2. Finished
- 11.1.2.1. Solid Dose Formulation
- 11.1.2.1.1. Tablets
- 11.1.2.1.2. Other Types (Capsules, Powders, etc.)
- 11.1.2.2. Liquid Dose Formulation
- 11.1.2.3. Injectable Dose Formulation
- 11.1.2.1. Solid Dose Formulation
- 11.1.3. Secondary Packaging
- 11.1.1. Active P
- 11.1. Market Analysis, Insights and Forecast - by Service Type
- 12. Middle East and Africa Pharmaceutical CMO Market Analysis, Insights and Forecast, 2020-2032
- 12.1. Market Analysis, Insights and Forecast - by Service Type
- 12.1.1. Active P
- 12.1.1.1. Small Molecule
- 12.1.1.2. Large Molecule
- 12.1.1.3. High Potency API (HPAPI)
- 12.1.2. Finished
- 12.1.2.1. Solid Dose Formulation
- 12.1.2.1.1. Tablets
- 12.1.2.1.2. Other Types (Capsules, Powders, etc.)
- 12.1.2.2. Liquid Dose Formulation
- 12.1.2.3. Injectable Dose Formulation
- 12.1.2.1. Solid Dose Formulation
- 12.1.3. Secondary Packaging
- 12.1.1. Active P
- 12.1. Market Analysis, Insights and Forecast - by Service Type
- 13. Competitive Analysis
- 13.1. Company Profiles
- 13.1.1 Famar SA
- 13.1.1.1. Company Overview
- 13.1.1.2. Products
- 13.1.1.3. Company Financials
- 13.1.1.4. SWOT Analysis
- 13.1.2 Lonza Group
- 13.1.2.1. Company Overview
- 13.1.2.2. Products
- 13.1.2.3. Company Financials
- 13.1.2.4. SWOT Analysis
- 13.1.3 Tesa Labtec GmbH (Tesa SE)
- 13.1.3.1. Company Overview
- 13.1.3.2. Products
- 13.1.3.3. Company Financials
- 13.1.3.4. SWOT Analysis
- 13.1.4 ARX LL
- 13.1.4.1. Company Overview
- 13.1.4.2. Products
- 13.1.4.3. Company Financials
- 13.1.4.4. SWOT Analysis
- 13.1.5 Patheon Inc (Thermo Fisher Scientific Inc )
- 13.1.5.1. Company Overview
- 13.1.5.2. Products
- 13.1.5.3. Company Financials
- 13.1.5.4. SWOT Analysis
- 13.1.6 Pfizer CentreSource (Pfizer Inc )
- 13.1.6.1. Company Overview
- 13.1.6.2. Products
- 13.1.6.3. Company Financials
- 13.1.6.4. SWOT Analysis
- 13.1.7 Tapemark
- 13.1.7.1. Company Overview
- 13.1.7.2. Products
- 13.1.7.3. Company Financials
- 13.1.7.4. SWOT Analysis
- 13.1.8 Aenova Holdings GmbH
- 13.1.8.1. Company Overview
- 13.1.8.2. Products
- 13.1.8.3. Company Financials
- 13.1.8.4. SWOT Analysis
- 13.1.9 Catalent Inc
- 13.1.9.1. Company Overview
- 13.1.9.2. Products
- 13.1.9.3. Company Financials
- 13.1.9.4. SWOT Analysis
- 13.1.10 Boehringer Ingelheim Group
- 13.1.10.1. Company Overview
- 13.1.10.2. Products
- 13.1.10.3. Company Financials
- 13.1.10.4. SWOT Analysis
- 13.1.11 Recipharm AB
- 13.1.11.1. Company Overview
- 13.1.11.2. Products
- 13.1.11.3. Company Financials
- 13.1.11.4. SWOT Analysis
- 13.1.12 Baxter Biopharma Solutions (Baxter International Inc )
- 13.1.12.1. Company Overview
- 13.1.12.2. Products
- 13.1.12.3. Company Financials
- 13.1.12.4. SWOT Analysis
- 13.1.13 Jubilant Biosys Ltd (Jubilant Pharmova Ltd)
- 13.1.13.1. Company Overview
- 13.1.13.2. Products
- 13.1.13.3. Company Financials
- 13.1.13.4. SWOT Analysis
- 13.1.1 Famar SA
- 13.2. Market Entropy
- 13.2.1 Company's Key Areas Served
- 13.2.2 Recent Developments
- 13.3. Company Market Share Analysis 2025
- 13.3.1 Top 5 Companies Market Share Analysis
- 13.3.2 Top 3 Companies Market Share Analysis
- 13.4. List of Potential Customers
- 14. Research Methodology
List of Figures
- Figure 1: Global Pharmaceutical CMO Market Revenue Breakdown (Million, %) by Region 2025 & 2033
- Figure 2: North America Pharmaceutical CMO Market Revenue (Million), by Service Type 2025 & 2033
- Figure 3: North America Pharmaceutical CMO Market Revenue Share (%), by Service Type 2025 & 2033
- Figure 4: North America Pharmaceutical CMO Market Revenue (Million), by Country 2025 & 2033
- Figure 5: North America Pharmaceutical CMO Market Revenue Share (%), by Country 2025 & 2033
- Figure 6: Europe Pharmaceutical CMO Market Revenue (Million), by Service Type 2025 & 2033
- Figure 7: Europe Pharmaceutical CMO Market Revenue Share (%), by Service Type 2025 & 2033
- Figure 8: Europe Pharmaceutical CMO Market Revenue (Million), by Country 2025 & 2033
- Figure 9: Europe Pharmaceutical CMO Market Revenue Share (%), by Country 2025 & 2033
- Figure 10: Asia Pharmaceutical CMO Market Revenue (Million), by Service Type 2025 & 2033
- Figure 11: Asia Pharmaceutical CMO Market Revenue Share (%), by Service Type 2025 & 2033
- Figure 12: Asia Pharmaceutical CMO Market Revenue (Million), by Country 2025 & 2033
- Figure 13: Asia Pharmaceutical CMO Market Revenue Share (%), by Country 2025 & 2033
- Figure 14: Australia and New Zealand Pharmaceutical CMO Market Revenue (Million), by Service Type 2025 & 2033
- Figure 15: Australia and New Zealand Pharmaceutical CMO Market Revenue Share (%), by Service Type 2025 & 2033
- Figure 16: Australia and New Zealand Pharmaceutical CMO Market Revenue (Million), by Country 2025 & 2033
- Figure 17: Australia and New Zealand Pharmaceutical CMO Market Revenue Share (%), by Country 2025 & 2033
- Figure 18: Latin America Pharmaceutical CMO Market Revenue (Million), by Service Type 2025 & 2033
- Figure 19: Latin America Pharmaceutical CMO Market Revenue Share (%), by Service Type 2025 & 2033
- Figure 20: Latin America Pharmaceutical CMO Market Revenue (Million), by Country 2025 & 2033
- Figure 21: Latin America Pharmaceutical CMO Market Revenue Share (%), by Country 2025 & 2033
- Figure 22: Middle East and Africa Pharmaceutical CMO Market Revenue (Million), by Service Type 2025 & 2033
- Figure 23: Middle East and Africa Pharmaceutical CMO Market Revenue Share (%), by Service Type 2025 & 2033
- Figure 24: Middle East and Africa Pharmaceutical CMO Market Revenue (Million), by Country 2025 & 2033
- Figure 25: Middle East and Africa Pharmaceutical CMO Market Revenue Share (%), by Country 2025 & 2033
List of Tables
- Table 1: Global Pharmaceutical CMO Market Revenue Million Forecast, by Service Type 2020 & 2033
- Table 2: Global Pharmaceutical CMO Market Revenue Million Forecast, by Region 2020 & 2033
- Table 3: Global Pharmaceutical CMO Market Revenue Million Forecast, by Service Type 2020 & 2033
- Table 4: Global Pharmaceutical CMO Market Revenue Million Forecast, by Country 2020 & 2033
- Table 5: United States Pharmaceutical CMO Market Revenue (Million) Forecast, by Application 2020 & 2033
- Table 6: Canada Pharmaceutical CMO Market Revenue (Million) Forecast, by Application 2020 & 2033
- Table 7: Global Pharmaceutical CMO Market Revenue Million Forecast, by Service Type 2020 & 2033
- Table 8: Global Pharmaceutical CMO Market Revenue Million Forecast, by Country 2020 & 2033
- Table 9: United Kingdom Pharmaceutical CMO Market Revenue (Million) Forecast, by Application 2020 & 2033
- Table 10: Germany Pharmaceutical CMO Market Revenue (Million) Forecast, by Application 2020 & 2033
- Table 11: France Pharmaceutical CMO Market Revenue (Million) Forecast, by Application 2020 & 2033
- Table 12: Italy Pharmaceutical CMO Market Revenue (Million) Forecast, by Application 2020 & 2033
- Table 13: Spain Pharmaceutical CMO Market Revenue (Million) Forecast, by Application 2020 & 2033
- Table 14: Global Pharmaceutical CMO Market Revenue Million Forecast, by Service Type 2020 & 2033
- Table 15: Global Pharmaceutical CMO Market Revenue Million Forecast, by Country 2020 & 2033
- Table 16: China Pharmaceutical CMO Market Revenue (Million) Forecast, by Application 2020 & 2033
- Table 17: India Pharmaceutical CMO Market Revenue (Million) Forecast, by Application 2020 & 2033
- Table 18: Japan Pharmaceutical CMO Market Revenue (Million) Forecast, by Application 2020 & 2033
- Table 19: Australia Pharmaceutical CMO Market Revenue (Million) Forecast, by Application 2020 & 2033
- Table 20: Global Pharmaceutical CMO Market Revenue Million Forecast, by Service Type 2020 & 2033
- Table 21: Global Pharmaceutical CMO Market Revenue Million Forecast, by Country 2020 & 2033
- Table 22: Global Pharmaceutical CMO Market Revenue Million Forecast, by Service Type 2020 & 2033
- Table 23: Global Pharmaceutical CMO Market Revenue Million Forecast, by Country 2020 & 2033
- Table 24: Brazil Pharmaceutical CMO Market Revenue (Million) Forecast, by Application 2020 & 2033
- Table 25: Mexico Pharmaceutical CMO Market Revenue (Million) Forecast, by Application 2020 & 2033
- Table 26: Argentina Pharmaceutical CMO Market Revenue (Million) Forecast, by Application 2020 & 2033
- Table 27: Global Pharmaceutical CMO Market Revenue Million Forecast, by Service Type 2020 & 2033
- Table 28: Global Pharmaceutical CMO Market Revenue Million Forecast, by Country 2020 & 2033
- Table 29: United Arab Emirates Pharmaceutical CMO Market Revenue (Million) Forecast, by Application 2020 & 2033
- Table 30: Saudi Arabia Pharmaceutical CMO Market Revenue (Million) Forecast, by Application 2020 & 2033
- Table 31: South Africa Pharmaceutical CMO Market Revenue (Million) Forecast, by Application 2020 & 2033
Frequently Asked Questions
1. What is the projected Compound Annual Growth Rate (CAGR) of the Pharmaceutical CMO Market?
The projected CAGR is approximately 6.53%.
2. Which companies are prominent players in the Pharmaceutical CMO Market?
Key companies in the market include Famar SA, Lonza Group, Tesa Labtec GmbH (Tesa SE), ARX LL, Patheon Inc (Thermo Fisher Scientific Inc ), Pfizer CentreSource (Pfizer Inc ), Tapemark, Aenova Holdings GmbH, Catalent Inc, Boehringer Ingelheim Group, Recipharm AB, Baxter Biopharma Solutions (Baxter International Inc ), Jubilant Biosys Ltd (Jubilant Pharmova Ltd).
3. What are the main segments of the Pharmaceutical CMO Market?
The market segments include Service Type.
4. Can you provide details about the market size?
The market size is estimated to be USD 173.13 Million as of 2022.
5. What are some drivers contributing to market growth?
Increasing Outsourcing Volume by Pharmaceutical Companies; Increasing Investment in Research and Development.
6. What are the notable trends driving market growth?
Active Pharmaceutical Ingredient (API) and Intermediates are Expected to Witness Robust Demand.
7. Are there any restraints impacting market growth?
Increasing Lead Time and Logistics Costs; Stringent Regulatory Requirements; Capacity Utilization Issues Affecting the Profitability of CMOs.
8. Can you provide examples of recent developments in the market?
January 2023: Catalent announced that it had signed a development and license agreement with Ethicann Pharmaceuticals Inc., a Canadian/American specialty pharmaceutical company specializing in creating high-value cannabinoid drug therapies using Zydisorally disintegrating tablet (ODT) technology to advance Ethicann's clinical drug pipeline. Per the agreement, Catalent would use its Zydis technology to develop pharmaceutical products containing cannabidiol (CBD) and tetrahydrocannabinol (THC) for Ethicann's use in clinical trials for various conditions.
9. What pricing options are available for accessing the report?
Pricing options include single-user, multi-user, and enterprise licenses priced at USD 4750, USD 5250, and USD 8750 respectively.
10. Is the market size provided in terms of value or volume?
The market size is provided in terms of value, measured in Million.
11. Are there any specific market keywords associated with the report?
Yes, the market keyword associated with the report is "Pharmaceutical CMO Market," which aids in identifying and referencing the specific market segment covered.
12. How do I determine which pricing option suits my needs best?
The pricing options vary based on user requirements and access needs. Individual users may opt for single-user licenses, while businesses requiring broader access may choose multi-user or enterprise licenses for cost-effective access to the report.
13. Are there any additional resources or data provided in the Pharmaceutical CMO Market report?
While the report offers comprehensive insights, it's advisable to review the specific contents or supplementary materials provided to ascertain if additional resources or data are available.
14. How can I stay updated on further developments or reports in the Pharmaceutical CMO Market?
To stay informed about further developments, trends, and reports in the Pharmaceutical CMO Market, consider subscribing to industry newsletters, following relevant companies and organizations, or regularly checking reputable industry news sources and publications.
Methodology
Step 1 - Identification of Relevant Samples Size from Population Database


Step 2 - Approaches for Defining Global Market Size (Value, Volume* & Price*)

Note*: In applicable scenarios
Step 3 - Data Sources
Primary Research
- Web Analytics
- Survey Reports
- Research Institute
- Latest Research Reports
- Opinion Leaders
Secondary Research
- Annual Reports
- White Paper
- Latest Press Release
- Industry Association
- Paid Database
- Investor Presentations

Step 4 - Data Triangulation
Involves using different sources of information in order to increase the validity of a study
These sources are likely to be stakeholders in a program - participants, other researchers, program staff, other community members, and so on.
Then we put all data in single framework & apply various statistical tools to find out the dynamic on the market.
During the analysis stage, feedback from the stakeholder groups would be compared to determine areas of agreement as well as areas of divergence