

Key Insights
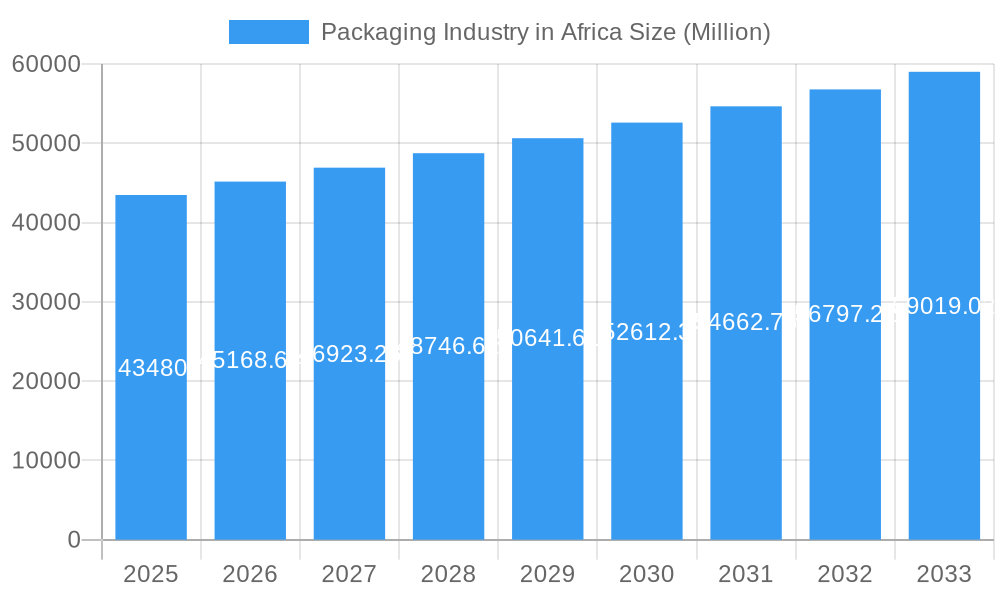
The African packaging market, valued at $43.48 billion in 2025, is experiencing robust growth, projected to expand at a compound annual growth rate (CAGR) of 3.85% from 2025 to 2033. This growth is fueled by several key factors. The rising middle class across the continent is driving increased consumption of packaged goods, particularly in the food and beverage sectors. Furthermore, urbanization and improved retail infrastructure are facilitating the distribution of packaged products, contributing to market expansion. The increasing adoption of e-commerce further boosts demand for efficient and protective packaging solutions. Specific growth drivers include the expanding pharmaceutical industry requiring specialized packaging, the burgeoning demand for convenient, on-the-go food and beverage options, and a growing awareness of hygiene and product preservation, leading to increased preference for packaged goods. However, challenges remain. Fluctuations in raw material prices, particularly for plastics and paper, pose a significant constraint. Furthermore, inconsistent infrastructure and logistics networks in certain regions can hinder efficient distribution. Despite these challenges, the long-term outlook for the African packaging market remains positive, driven by sustained economic growth, population increase, and evolving consumer preferences. The market is segmented by material (paper and paperboard, plastic, metal, glass), product type (bottles, boxes, cans), end-user industry (beverage, food, pharmaceuticals), and country (South Africa, Nigeria, Kenya, Egypt, and others), offering diverse investment opportunities.
Packaging Industry in Africa Market Size (In Billion)
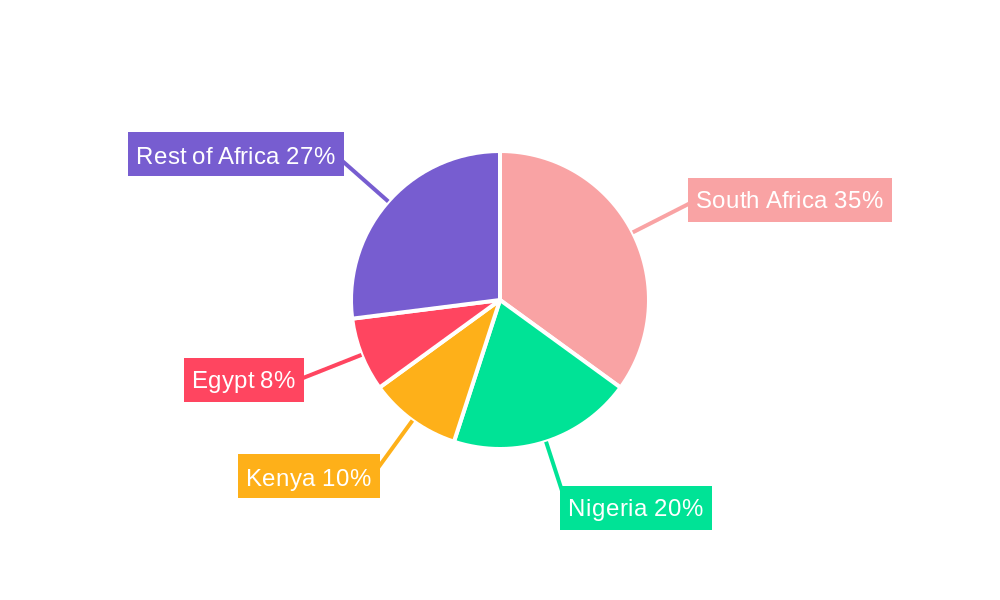
The dominance of South Africa, as a key player in the regional economy, significantly impacts the overall market trajectory. Nigeria and Kenya, with their large and growing populations, also present substantial opportunities. The significant presence of multinational companies like Tetra Pak and Mondi Group, alongside local players like Nampak Limited and Consol Glass, reflects a dynamic competitive landscape. Future growth will be influenced by government initiatives promoting sustainable packaging practices and technological advancements leading to more innovative and environmentally friendly packaging solutions. Understanding the regional nuances, consumer behavior patterns, and regulatory landscape is crucial for businesses aiming to succeed in this rapidly evolving market. Focusing on eco-friendly materials, efficient logistics, and value-added services will be key differentiators in the increasingly competitive African packaging industry.
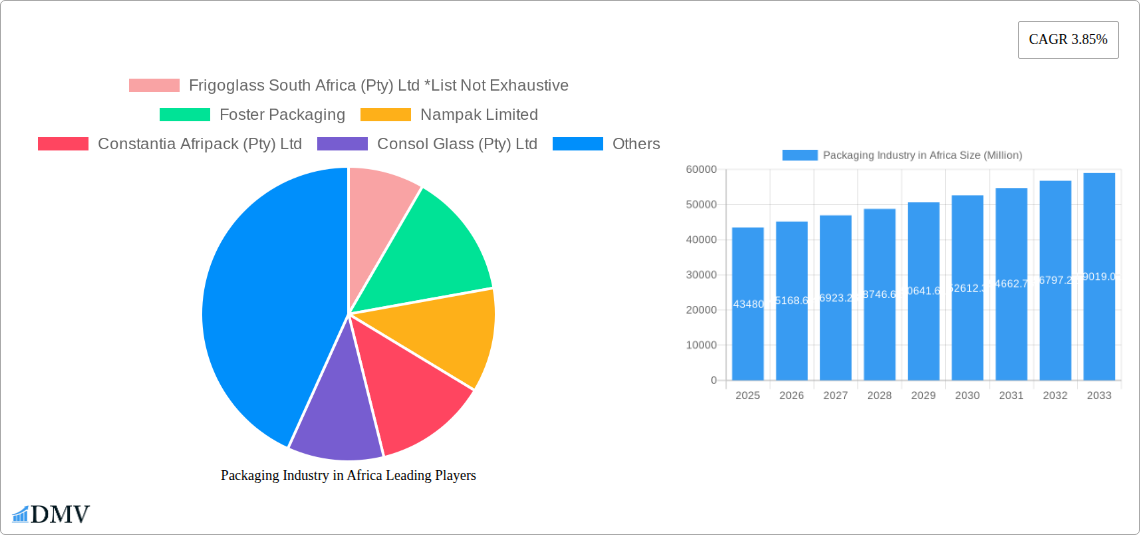
Packaging Industry in Africa Company Market Share
Packaging Industry in Africa: A Comprehensive Market Report (2019-2033)
This insightful report provides a detailed analysis of the African packaging industry, covering market trends, leading players, and future growth prospects. With a study period spanning 2019-2033, a base year of 2025, and a forecast period of 2025-2033, this report offers invaluable insights for stakeholders seeking to understand and capitalize on the dynamic opportunities within this rapidly evolving market. The report utilizes data from the historical period of 2019-2024 and projects values to 2033. The market is valued at xx Million in 2025.
Packaging Industry in Africa Market Composition & Trends
The African packaging industry is characterized by a fragmented landscape with a few dominant players and numerous smaller, regional operators. Market share distribution is influenced by factors such as geographic location, access to resources, and technological capabilities. While South Africa holds a significant share, other countries like Nigeria, Egypt, and Kenya are experiencing substantial growth. Innovation is driven by increasing consumer demand for sustainable and convenient packaging solutions. The regulatory landscape is evolving, with a focus on environmental sustainability and safety standards. Substitute products, like reusable containers, are gaining traction, influencing market dynamics. M&A activity, illustrated by Ardagh Group's USD 1 Billion acquisition of Consol Holdings in 2022, indicates strong investor confidence and consolidation within the sector. The deal value for all M&A activities in the historical period was xx Million.
- Market Concentration: Moderately fragmented, with a few major players dominating specific segments.
- Innovation Catalysts: Growing demand for sustainable packaging, e-commerce growth, and technological advancements in material science.
- Regulatory Landscape: Increasing focus on environmental regulations, food safety, and labeling requirements.
- Substitute Products: Reusable packaging, biodegradable materials, and alternative delivery systems.
- End-User Profiles: Diverse range of industries, including beverage, food, pharmaceuticals, and personal care.
- M&A Activities: Significant deals indicate industry consolidation and investor interest.
Packaging Industry in Africa Industry Evolution
The African packaging industry has witnessed significant growth in recent years, driven by factors such as rising consumer spending, expanding retail sectors, and urbanization. This growth trajectory is expected to continue, albeit at varying rates across different segments and countries. Technological advancements, particularly in flexible packaging and sustainable materials, are reshaping the industry. Consumers are increasingly demanding eco-friendly options, impacting material choices and packaging design. Adoption of sustainable packaging solutions is gradually increasing, although challenges remain concerning infrastructure and affordability. The industry is witnessing a shift towards automation and digitalization in manufacturing processes. The average annual growth rate of the packaging industry in Africa during the historical period was xx%, with a projected growth rate of xx% during the forecast period.
Leading Regions, Countries, or Segments in Packaging Industry in Africa
- By Material: Plastic currently dominates, followed by paper and paperboard, with metal and glass holding significant shares in specific applications.
- By Product Type: Plastic bottles and corrugated boxes are the largest segments, reflecting the high demand for beverage and food packaging.
- By End-user Industry: The beverage and food industries are the primary drivers of growth, followed by pharmaceuticals and household goods.
- By Country: South Africa holds the largest market share, due to its relatively developed economy and infrastructure, followed by Nigeria, Egypt, and Kenya. However, the rest of Africa shows strong potential for future growth.
Key Drivers:
- South Africa: Established manufacturing base, strong regulatory framework, and access to resources.
- Nigeria: Large population, growing consumer market, and increasing domestic production.
- Egypt: Significant investments in infrastructure and manufacturing capacity.
- Kenya: Expanding middle class, increased urbanization, and growing food processing industry.
Packaging Industry in Africa Product Innovations
Recent innovations focus on sustainable materials, such as biodegradable plastics and recycled content. Improvements in barrier properties and functionalities have enhanced product protection and shelf life. Smart packaging technologies, including RFID tagging and tamper-evident seals, are gaining traction. These innovations are driven by consumer demand for sustainability, product safety, and improved convenience.
Propelling Factors for Packaging Industry in Africa Growth
Growth is driven by several factors: increasing urbanization and rising disposable incomes boosting consumer spending, expansion of the retail sector and the rise of e-commerce, government initiatives supporting local manufacturing and industrial development, and growing demand for sophisticated packaging solutions across industries.
Obstacles in the Packaging Industry in Africa Market
Challenges include a lack of consistent infrastructure across the continent, limiting efficient transportation and distribution, the high cost of raw materials and imported technologies, shortages of skilled labor in some regions and stringent environmental regulations posing hurdles for companies that rely on non-sustainable practices. These factors can contribute to production inefficiencies and increased costs.
Future Opportunities in Packaging Industry in Africa
Opportunities lie in leveraging sustainable and innovative materials, tapping into the growing e-commerce market, embracing new technologies like smart packaging, and focusing on regional specialization in specific packaging types. Expanding into underserved markets and catering to niche segments, such as healthcare and specialized food products, will present significant growth opportunities.
Major Players in the Packaging Industry in Africa Ecosystem
- Frigoglass South Africa (Pty) Ltd
- Foster Packaging
- Nampak Limited
- Constantia Afripack (Pty) Ltd
- Consol Glass (Pty) Ltd
- Mondi Group
- Tetra Pak SA
- Astrapak Ltd (RPC Group)
- East African Packaging Industries Ltd (EAPI)
- Mpact Pty Ltd
- Bonpak (Pty) Ltd
Key Developments in Packaging Industry in Africa Industry
- April 2022: Ardagh Group's acquisition of Consol Holdings for USD 1 Billion signifies substantial investment in the South African glass packaging market. A further USD 200 Million is committed to new furnaces.
- June 2022: Dow expands its Project REFLEX flexible packaging recycling initiative to Egypt and Guinea, fostering sustainable practices.
Strategic Packaging Industry in Africa Market Forecast
The African packaging industry is poised for significant growth in the coming years, driven by factors outlined in this report. Continued investment in infrastructure, technological innovation, and sustainable practices will be key to realizing the market's full potential. The focus on sustainable and innovative packaging will shape future market dynamics and opportunities, driving the industry toward a more environmentally responsible and efficient future.
Packaging Industry in Africa Segmentation
-
1. Material
- 1.1. Paper and Paperboard
- 1.2. Plastic
- 1.3. Metal
- 1.4. Glass
-
2. Product Type
- 2.1. Plastic Bottles
- 2.2. Glass Bottles
- 2.3. Corrugated Boxes
- 2.4. Metal Cans
- 2.5. Other Applications
-
3. End-user Industry
- 3.1. Beverage
- 3.2. Food
- 3.3. Pharmaceuticals
- 3.4. Household and Personal Care
- 3.5. Other
Packaging Industry in Africa Segmentation By Geography
-
1. North America
- 1.1. United States
- 1.2. Canada
- 1.3. Mexico
-
2. South America
- 2.1. Brazil
- 2.2. Argentina
- 2.3. Rest of South America
-
3. Europe
- 3.1. United Kingdom
- 3.2. Germany
- 3.3. France
- 3.4. Italy
- 3.5. Spain
- 3.6. Russia
- 3.7. Benelux
- 3.8. Nordics
- 3.9. Rest of Europe
-
4. Middle East & Africa
- 4.1. Turkey
- 4.2. Israel
- 4.3. GCC
- 4.4. North Africa
- 4.5. South Africa
- 4.6. Rest of Middle East & Africa
-
5. Asia Pacific
- 5.1. China
- 5.2. India
- 5.3. Japan
- 5.4. South Korea
- 5.5. ASEAN
- 5.6. Oceania
- 5.7. Rest of Asia Pacific
Packaging Industry in Africa Regional Market Share
Geographic Coverage of Packaging Industry in Africa
Packaging Industry in Africa REPORT HIGHLIGHTS
| Aspects | Details |
|---|---|
| Study Period | 2020-2034 |
| Base Year | 2025 |
| Estimated Year | 2026 |
| Forecast Period | 2026-2034 |
| Historical Period | 2020-2025 |
| Growth Rate | CAGR of 3.85% from 2020-2034 |
| Segmentation |
|
Table of Contents
- 1. Introduction
- 1.1. Research Scope
- 1.2. Market Segmentation
- 1.3. Research Objective
- 1.4. Definitions and Assumptions
- 2. Executive Summary
- 2.1. Market Snapshot
- 3. Market Dynamics
- 3.1. Market Drivers
- 3.2. Market Restrains
- 3.3. Market Trends
- 3.4. Market Opportunities
- 4. Market Factor Analysis
- 4.1. Porters Five Forces
- 4.1.1. Bargaining Power of Suppliers
- 4.1.2. Bargaining Power of Buyers
- 4.1.3. Threat of New Entrants
- 4.1.4. Threat of Substitutes
- 4.1.5. Competitive Rivalry
- 4.2. PESTEL analysis
- 4.3. BCG Analysis
- 4.3.1. Stars (High Growth, High Market Share)
- 4.3.2. Cash Cows (Low Growth, High Market Share)
- 4.3.3. Question Mark (High Growth, Low Market Share)
- 4.3.4. Dogs (Low Growth, Low Market Share)
- 4.4. Ansoff Matrix Analysis
- 4.5. Supply Chain Analysis
- 4.6. Regulatory Landscape
- 4.7. Current Market Potential and Opportunity Assessment (TAM–SAM–SOM Framework)
- 4.8. DMV Analyst Note
- 4.1. Porters Five Forces
- 5. Market Analysis, Insights and Forecast 2021-2033
- 5.1. Market Analysis, Insights and Forecast - by Material
- 5.1.1. Paper and Paperboard
- 5.1.2. Plastic
- 5.1.3. Metal
- 5.1.4. Glass
- 5.2. Market Analysis, Insights and Forecast - by Product Type
- 5.2.1. Plastic Bottles
- 5.2.2. Glass Bottles
- 5.2.3. Corrugated Boxes
- 5.2.4. Metal Cans
- 5.2.5. Other Applications
- 5.3. Market Analysis, Insights and Forecast - by End-user Industry
- 5.3.1. Beverage
- 5.3.2. Food
- 5.3.3. Pharmaceuticals
- 5.3.4. Household and Personal Care
- 5.3.5. Other
- 5.4. Market Analysis, Insights and Forecast - by Region
- 5.4.1. North America
- 5.4.2. South America
- 5.4.3. Europe
- 5.4.4. Middle East & Africa
- 5.4.5. Asia Pacific
- 5.1. Market Analysis, Insights and Forecast - by Material
- 6. Global Packaging Industry in Africa Analysis, Insights and Forecast, 2021-2033
- 6.1. Market Analysis, Insights and Forecast - by Material
- 6.1.1. Paper and Paperboard
- 6.1.2. Plastic
- 6.1.3. Metal
- 6.1.4. Glass
- 6.2. Market Analysis, Insights and Forecast - by Product Type
- 6.2.1. Plastic Bottles
- 6.2.2. Glass Bottles
- 6.2.3. Corrugated Boxes
- 6.2.4. Metal Cans
- 6.2.5. Other Applications
- 6.3. Market Analysis, Insights and Forecast - by End-user Industry
- 6.3.1. Beverage
- 6.3.2. Food
- 6.3.3. Pharmaceuticals
- 6.3.4. Household and Personal Care
- 6.3.5. Other
- 6.1. Market Analysis, Insights and Forecast - by Material
- 7. North America Packaging Industry in Africa Analysis, Insights and Forecast, 2020-2032
- 7.1. Market Analysis, Insights and Forecast - by Material
- 7.1.1. Paper and Paperboard
- 7.1.2. Plastic
- 7.1.3. Metal
- 7.1.4. Glass
- 7.2. Market Analysis, Insights and Forecast - by Product Type
- 7.2.1. Plastic Bottles
- 7.2.2. Glass Bottles
- 7.2.3. Corrugated Boxes
- 7.2.4. Metal Cans
- 7.2.5. Other Applications
- 7.3. Market Analysis, Insights and Forecast - by End-user Industry
- 7.3.1. Beverage
- 7.3.2. Food
- 7.3.3. Pharmaceuticals
- 7.3.4. Household and Personal Care
- 7.3.5. Other
- 7.1. Market Analysis, Insights and Forecast - by Material
- 8. South America Packaging Industry in Africa Analysis, Insights and Forecast, 2020-2032
- 8.1. Market Analysis, Insights and Forecast - by Material
- 8.1.1. Paper and Paperboard
- 8.1.2. Plastic
- 8.1.3. Metal
- 8.1.4. Glass
- 8.2. Market Analysis, Insights and Forecast - by Product Type
- 8.2.1. Plastic Bottles
- 8.2.2. Glass Bottles
- 8.2.3. Corrugated Boxes
- 8.2.4. Metal Cans
- 8.2.5. Other Applications
- 8.3. Market Analysis, Insights and Forecast - by End-user Industry
- 8.3.1. Beverage
- 8.3.2. Food
- 8.3.3. Pharmaceuticals
- 8.3.4. Household and Personal Care
- 8.3.5. Other
- 8.1. Market Analysis, Insights and Forecast - by Material
- 9. Europe Packaging Industry in Africa Analysis, Insights and Forecast, 2020-2032
- 9.1. Market Analysis, Insights and Forecast - by Material
- 9.1.1. Paper and Paperboard
- 9.1.2. Plastic
- 9.1.3. Metal
- 9.1.4. Glass
- 9.2. Market Analysis, Insights and Forecast - by Product Type
- 9.2.1. Plastic Bottles
- 9.2.2. Glass Bottles
- 9.2.3. Corrugated Boxes
- 9.2.4. Metal Cans
- 9.2.5. Other Applications
- 9.3. Market Analysis, Insights and Forecast - by End-user Industry
- 9.3.1. Beverage
- 9.3.2. Food
- 9.3.3. Pharmaceuticals
- 9.3.4. Household and Personal Care
- 9.3.5. Other
- 9.1. Market Analysis, Insights and Forecast - by Material
- 10. Middle East & Africa Packaging Industry in Africa Analysis, Insights and Forecast, 2020-2032
- 10.1. Market Analysis, Insights and Forecast - by Material
- 10.1.1. Paper and Paperboard
- 10.1.2. Plastic
- 10.1.3. Metal
- 10.1.4. Glass
- 10.2. Market Analysis, Insights and Forecast - by Product Type
- 10.2.1. Plastic Bottles
- 10.2.2. Glass Bottles
- 10.2.3. Corrugated Boxes
- 10.2.4. Metal Cans
- 10.2.5. Other Applications
- 10.3. Market Analysis, Insights and Forecast - by End-user Industry
- 10.3.1. Beverage
- 10.3.2. Food
- 10.3.3. Pharmaceuticals
- 10.3.4. Household and Personal Care
- 10.3.5. Other
- 10.1. Market Analysis, Insights and Forecast - by Material
- 11. Asia Pacific Packaging Industry in Africa Analysis, Insights and Forecast, 2020-2032
- 11.1. Market Analysis, Insights and Forecast - by Material
- 11.1.1. Paper and Paperboard
- 11.1.2. Plastic
- 11.1.3. Metal
- 11.1.4. Glass
- 11.2. Market Analysis, Insights and Forecast - by Product Type
- 11.2.1. Plastic Bottles
- 11.2.2. Glass Bottles
- 11.2.3. Corrugated Boxes
- 11.2.4. Metal Cans
- 11.2.5. Other Applications
- 11.3. Market Analysis, Insights and Forecast - by End-user Industry
- 11.3.1. Beverage
- 11.3.2. Food
- 11.3.3. Pharmaceuticals
- 11.3.4. Household and Personal Care
- 11.3.5. Other
- 11.1. Market Analysis, Insights and Forecast - by Material
- 12. Competitive Analysis
- 12.1. Company Profiles
- 12.1.1 Frigoglass South Africa (Pty) Ltd *List Not Exhaustive
- 12.1.1.1. Company Overview
- 12.1.1.2. Products
- 12.1.1.3. Company Financials
- 12.1.1.4. SWOT Analysis
- 12.1.2 Foster Packaging
- 12.1.2.1. Company Overview
- 12.1.2.2. Products
- 12.1.2.3. Company Financials
- 12.1.2.4. SWOT Analysis
- 12.1.3 Nampak Limited
- 12.1.3.1. Company Overview
- 12.1.3.2. Products
- 12.1.3.3. Company Financials
- 12.1.3.4. SWOT Analysis
- 12.1.4 Constantia Afripack (Pty) Ltd
- 12.1.4.1. Company Overview
- 12.1.4.2. Products
- 12.1.4.3. Company Financials
- 12.1.4.4. SWOT Analysis
- 12.1.5 Consol Glass (Pty) Ltd
- 12.1.5.1. Company Overview
- 12.1.5.2. Products
- 12.1.5.3. Company Financials
- 12.1.5.4. SWOT Analysis
- 12.1.6 Mondi Group
- 12.1.6.1. Company Overview
- 12.1.6.2. Products
- 12.1.6.3. Company Financials
- 12.1.6.4. SWOT Analysis
- 12.1.7 Tetra Pak SA
- 12.1.7.1. Company Overview
- 12.1.7.2. Products
- 12.1.7.3. Company Financials
- 12.1.7.4. SWOT Analysis
- 12.1.8 Astrapak Ltd (RPC Group)
- 12.1.8.1. Company Overview
- 12.1.8.2. Products
- 12.1.8.3. Company Financials
- 12.1.8.4. SWOT Analysis
- 12.1.9 East African Packaging Industries Ltd (EAPI)
- 12.1.9.1. Company Overview
- 12.1.9.2. Products
- 12.1.9.3. Company Financials
- 12.1.9.4. SWOT Analysis
- 12.1.10 Mpact Pty Ltd
- 12.1.10.1. Company Overview
- 12.1.10.2. Products
- 12.1.10.3. Company Financials
- 12.1.10.4. SWOT Analysis
- 12.1.11 Bonpak (Pty) Ltd
- 12.1.11.1. Company Overview
- 12.1.11.2. Products
- 12.1.11.3. Company Financials
- 12.1.11.4. SWOT Analysis
- 12.1.1 Frigoglass South Africa (Pty) Ltd *List Not Exhaustive
- 12.2. Market Entropy
- 12.2.1 Company's Key Areas Served
- 12.2.2 Recent Developments
- 12.3. Company Market Share Analysis 2025
- 12.3.1 Top 5 Companies Market Share Analysis
- 12.3.2 Top 3 Companies Market Share Analysis
- 12.4. List of Potential Customers
- 13. Research Methodology
List of Figures
- Figure 1: Global Packaging Industry in Africa Revenue Breakdown (Million, %) by Region 2025 & 2033
- Figure 2: North America Packaging Industry in Africa Revenue (Million), by Material 2025 & 2033
- Figure 3: North America Packaging Industry in Africa Revenue Share (%), by Material 2025 & 2033
- Figure 4: North America Packaging Industry in Africa Revenue (Million), by Product Type 2025 & 2033
- Figure 5: North America Packaging Industry in Africa Revenue Share (%), by Product Type 2025 & 2033
- Figure 6: North America Packaging Industry in Africa Revenue (Million), by End-user Industry 2025 & 2033
- Figure 7: North America Packaging Industry in Africa Revenue Share (%), by End-user Industry 2025 & 2033
- Figure 8: North America Packaging Industry in Africa Revenue (Million), by Country 2025 & 2033
- Figure 9: North America Packaging Industry in Africa Revenue Share (%), by Country 2025 & 2033
- Figure 10: South America Packaging Industry in Africa Revenue (Million), by Material 2025 & 2033
- Figure 11: South America Packaging Industry in Africa Revenue Share (%), by Material 2025 & 2033
- Figure 12: South America Packaging Industry in Africa Revenue (Million), by Product Type 2025 & 2033
- Figure 13: South America Packaging Industry in Africa Revenue Share (%), by Product Type 2025 & 2033
- Figure 14: South America Packaging Industry in Africa Revenue (Million), by End-user Industry 2025 & 2033
- Figure 15: South America Packaging Industry in Africa Revenue Share (%), by End-user Industry 2025 & 2033
- Figure 16: South America Packaging Industry in Africa Revenue (Million), by Country 2025 & 2033
- Figure 17: South America Packaging Industry in Africa Revenue Share (%), by Country 2025 & 2033
- Figure 18: Europe Packaging Industry in Africa Revenue (Million), by Material 2025 & 2033
- Figure 19: Europe Packaging Industry in Africa Revenue Share (%), by Material 2025 & 2033
- Figure 20: Europe Packaging Industry in Africa Revenue (Million), by Product Type 2025 & 2033
- Figure 21: Europe Packaging Industry in Africa Revenue Share (%), by Product Type 2025 & 2033
- Figure 22: Europe Packaging Industry in Africa Revenue (Million), by End-user Industry 2025 & 2033
- Figure 23: Europe Packaging Industry in Africa Revenue Share (%), by End-user Industry 2025 & 2033
- Figure 24: Europe Packaging Industry in Africa Revenue (Million), by Country 2025 & 2033
- Figure 25: Europe Packaging Industry in Africa Revenue Share (%), by Country 2025 & 2033
- Figure 26: Middle East & Africa Packaging Industry in Africa Revenue (Million), by Material 2025 & 2033
- Figure 27: Middle East & Africa Packaging Industry in Africa Revenue Share (%), by Material 2025 & 2033
- Figure 28: Middle East & Africa Packaging Industry in Africa Revenue (Million), by Product Type 2025 & 2033
- Figure 29: Middle East & Africa Packaging Industry in Africa Revenue Share (%), by Product Type 2025 & 2033
- Figure 30: Middle East & Africa Packaging Industry in Africa Revenue (Million), by End-user Industry 2025 & 2033
- Figure 31: Middle East & Africa Packaging Industry in Africa Revenue Share (%), by End-user Industry 2025 & 2033
- Figure 32: Middle East & Africa Packaging Industry in Africa Revenue (Million), by Country 2025 & 2033
- Figure 33: Middle East & Africa Packaging Industry in Africa Revenue Share (%), by Country 2025 & 2033
- Figure 34: Asia Pacific Packaging Industry in Africa Revenue (Million), by Material 2025 & 2033
- Figure 35: Asia Pacific Packaging Industry in Africa Revenue Share (%), by Material 2025 & 2033
- Figure 36: Asia Pacific Packaging Industry in Africa Revenue (Million), by Product Type 2025 & 2033
- Figure 37: Asia Pacific Packaging Industry in Africa Revenue Share (%), by Product Type 2025 & 2033
- Figure 38: Asia Pacific Packaging Industry in Africa Revenue (Million), by End-user Industry 2025 & 2033
- Figure 39: Asia Pacific Packaging Industry in Africa Revenue Share (%), by End-user Industry 2025 & 2033
- Figure 40: Asia Pacific Packaging Industry in Africa Revenue (Million), by Country 2025 & 2033
- Figure 41: Asia Pacific Packaging Industry in Africa Revenue Share (%), by Country 2025 & 2033
List of Tables
- Table 1: Global Packaging Industry in Africa Revenue Million Forecast, by Material 2020 & 2033
- Table 2: Global Packaging Industry in Africa Revenue Million Forecast, by Product Type 2020 & 2033
- Table 3: Global Packaging Industry in Africa Revenue Million Forecast, by End-user Industry 2020 & 2033
- Table 4: Global Packaging Industry in Africa Revenue Million Forecast, by Region 2020 & 2033
- Table 5: Global Packaging Industry in Africa Revenue Million Forecast, by Material 2020 & 2033
- Table 6: Global Packaging Industry in Africa Revenue Million Forecast, by Product Type 2020 & 2033
- Table 7: Global Packaging Industry in Africa Revenue Million Forecast, by End-user Industry 2020 & 2033
- Table 8: Global Packaging Industry in Africa Revenue Million Forecast, by Country 2020 & 2033
- Table 9: United States Packaging Industry in Africa Revenue (Million) Forecast, by Application 2020 & 2033
- Table 10: Canada Packaging Industry in Africa Revenue (Million) Forecast, by Application 2020 & 2033
- Table 11: Mexico Packaging Industry in Africa Revenue (Million) Forecast, by Application 2020 & 2033
- Table 12: Global Packaging Industry in Africa Revenue Million Forecast, by Material 2020 & 2033
- Table 13: Global Packaging Industry in Africa Revenue Million Forecast, by Product Type 2020 & 2033
- Table 14: Global Packaging Industry in Africa Revenue Million Forecast, by End-user Industry 2020 & 2033
- Table 15: Global Packaging Industry in Africa Revenue Million Forecast, by Country 2020 & 2033
- Table 16: Brazil Packaging Industry in Africa Revenue (Million) Forecast, by Application 2020 & 2033
- Table 17: Argentina Packaging Industry in Africa Revenue (Million) Forecast, by Application 2020 & 2033
- Table 18: Rest of South America Packaging Industry in Africa Revenue (Million) Forecast, by Application 2020 & 2033
- Table 19: Global Packaging Industry in Africa Revenue Million Forecast, by Material 2020 & 2033
- Table 20: Global Packaging Industry in Africa Revenue Million Forecast, by Product Type 2020 & 2033
- Table 21: Global Packaging Industry in Africa Revenue Million Forecast, by End-user Industry 2020 & 2033
- Table 22: Global Packaging Industry in Africa Revenue Million Forecast, by Country 2020 & 2033
- Table 23: United Kingdom Packaging Industry in Africa Revenue (Million) Forecast, by Application 2020 & 2033
- Table 24: Germany Packaging Industry in Africa Revenue (Million) Forecast, by Application 2020 & 2033
- Table 25: France Packaging Industry in Africa Revenue (Million) Forecast, by Application 2020 & 2033
- Table 26: Italy Packaging Industry in Africa Revenue (Million) Forecast, by Application 2020 & 2033
- Table 27: Spain Packaging Industry in Africa Revenue (Million) Forecast, by Application 2020 & 2033
- Table 28: Russia Packaging Industry in Africa Revenue (Million) Forecast, by Application 2020 & 2033
- Table 29: Benelux Packaging Industry in Africa Revenue (Million) Forecast, by Application 2020 & 2033
- Table 30: Nordics Packaging Industry in Africa Revenue (Million) Forecast, by Application 2020 & 2033
- Table 31: Rest of Europe Packaging Industry in Africa Revenue (Million) Forecast, by Application 2020 & 2033
- Table 32: Global Packaging Industry in Africa Revenue Million Forecast, by Material 2020 & 2033
- Table 33: Global Packaging Industry in Africa Revenue Million Forecast, by Product Type 2020 & 2033
- Table 34: Global Packaging Industry in Africa Revenue Million Forecast, by End-user Industry 2020 & 2033
- Table 35: Global Packaging Industry in Africa Revenue Million Forecast, by Country 2020 & 2033
- Table 36: Turkey Packaging Industry in Africa Revenue (Million) Forecast, by Application 2020 & 2033
- Table 37: Israel Packaging Industry in Africa Revenue (Million) Forecast, by Application 2020 & 2033
- Table 38: GCC Packaging Industry in Africa Revenue (Million) Forecast, by Application 2020 & 2033
- Table 39: North Africa Packaging Industry in Africa Revenue (Million) Forecast, by Application 2020 & 2033
- Table 40: South Africa Packaging Industry in Africa Revenue (Million) Forecast, by Application 2020 & 2033
- Table 41: Rest of Middle East & Africa Packaging Industry in Africa Revenue (Million) Forecast, by Application 2020 & 2033
- Table 42: Global Packaging Industry in Africa Revenue Million Forecast, by Material 2020 & 2033
- Table 43: Global Packaging Industry in Africa Revenue Million Forecast, by Product Type 2020 & 2033
- Table 44: Global Packaging Industry in Africa Revenue Million Forecast, by End-user Industry 2020 & 2033
- Table 45: Global Packaging Industry in Africa Revenue Million Forecast, by Country 2020 & 2033
- Table 46: China Packaging Industry in Africa Revenue (Million) Forecast, by Application 2020 & 2033
- Table 47: India Packaging Industry in Africa Revenue (Million) Forecast, by Application 2020 & 2033
- Table 48: Japan Packaging Industry in Africa Revenue (Million) Forecast, by Application 2020 & 2033
- Table 49: South Korea Packaging Industry in Africa Revenue (Million) Forecast, by Application 2020 & 2033
- Table 50: ASEAN Packaging Industry in Africa Revenue (Million) Forecast, by Application 2020 & 2033
- Table 51: Oceania Packaging Industry in Africa Revenue (Million) Forecast, by Application 2020 & 2033
- Table 52: Rest of Asia Pacific Packaging Industry in Africa Revenue (Million) Forecast, by Application 2020 & 2033
Frequently Asked Questions
1. What is the projected Compound Annual Growth Rate (CAGR) of the Packaging Industry in Africa?
The projected CAGR is approximately 3.85%.
2. Which companies are prominent players in the Packaging Industry in Africa?
Key companies in the market include Frigoglass South Africa (Pty) Ltd *List Not Exhaustive, Foster Packaging, Nampak Limited, Constantia Afripack (Pty) Ltd, Consol Glass (Pty) Ltd, Mondi Group, Tetra Pak SA, Astrapak Ltd (RPC Group), East African Packaging Industries Ltd (EAPI), Mpact Pty Ltd, Bonpak (Pty) Ltd.
3. What are the main segments of the Packaging Industry in Africa?
The market segments include Material, Product Type, End-user Industry.
4. Can you provide details about the market size?
The market size is estimated to be USD 43.48 Million as of 2022.
5. What are some drivers contributing to market growth?
Glass Bottles to Drive the Market Growth; Beverage Industry to Lead the Market Growth.
6. What are the notable trends driving market growth?
Glass Bottles to Drive the Market Growth.
7. Are there any restraints impacting market growth?
Fluctuation in Raw Material Price can Hinder the Growth of the Market..
8. Can you provide examples of recent developments in the market?
June 2022: Dow expanded the flexible packaging recycling initiative to new African markets. Dow announced that its flexible packaging recycling initiative, project REFLEX, will be expanded to Egypt and Guinea. The expansion of Project REFLEX into Egypt began in December 2021, with Dow entering an 18-month partnership with the international non-government organization, WasteAid, which shares waste management and recycling skills with lower- and middle-income countries. WasteAid will work with Dow to advance waste recovery and recycling in Aswan, a city located in southern Egypt.
9. What pricing options are available for accessing the report?
Pricing options include single-user, multi-user, and enterprise licenses priced at USD 4750, USD 5250, and USD 8750 respectively.
10. Is the market size provided in terms of value or volume?
The market size is provided in terms of value, measured in Million.
11. Are there any specific market keywords associated with the report?
Yes, the market keyword associated with the report is "Packaging Industry in Africa," which aids in identifying and referencing the specific market segment covered.
12. How do I determine which pricing option suits my needs best?
The pricing options vary based on user requirements and access needs. Individual users may opt for single-user licenses, while businesses requiring broader access may choose multi-user or enterprise licenses for cost-effective access to the report.
13. Are there any additional resources or data provided in the Packaging Industry in Africa report?
While the report offers comprehensive insights, it's advisable to review the specific contents or supplementary materials provided to ascertain if additional resources or data are available.
14. How can I stay updated on further developments or reports in the Packaging Industry in Africa?
To stay informed about further developments, trends, and reports in the Packaging Industry in Africa, consider subscribing to industry newsletters, following relevant companies and organizations, or regularly checking reputable industry news sources and publications.
Methodology
Step 1 - Identification of Relevant Samples Size from Population Database


Step 2 - Approaches for Defining Global Market Size (Value, Volume* & Price*)

Note*: In applicable scenarios
Step 3 - Data Sources
Primary Research
- Web Analytics
- Survey Reports
- Research Institute
- Latest Research Reports
- Opinion Leaders
Secondary Research
- Annual Reports
- White Paper
- Latest Press Release
- Industry Association
- Paid Database
- Investor Presentations

Step 4 - Data Triangulation
Involves using different sources of information in order to increase the validity of a study
These sources are likely to be stakeholders in a program - participants, other researchers, program staff, other community members, and so on.
Then we put all data in single framework & apply various statistical tools to find out the dynamic on the market.
During the analysis stage, feedback from the stakeholder groups would be compared to determine areas of agreement as well as areas of divergence