

Key Insights
The North American ampoules packaging market, encompassing glass and plastic materials, is experiencing robust growth, driven by the increasing demand for injectable pharmaceuticals and the rising prevalence of chronic diseases requiring injectable therapies. The market's expansion is further fueled by advancements in packaging technology, leading to improved product stability, sterility, and convenience. Specifically, the adoption of innovative materials like specialized plastics offering enhanced barrier properties and lighter weight compared to traditional glass is gaining traction. The United States, being a major pharmaceutical hub, commands a significant share of the market, while Canada shows promising growth potential aligned with its expanding healthcare sector. Key players like Wheaton Group, James Alexander Corporation, and Stevanato Group are actively contributing to market growth through investments in research and development, capacity expansion, and strategic partnerships. Regulatory compliance and stringent quality standards remain crucial aspects influencing market dynamics. While the market faces challenges such as fluctuating raw material prices and competition from alternative packaging formats, the overall outlook remains positive. The forecast period from 2025 to 2033 anticipates a continuation of this upward trend, propelled by the consistent demand for injectable medications and the continuous innovation in packaging solutions.
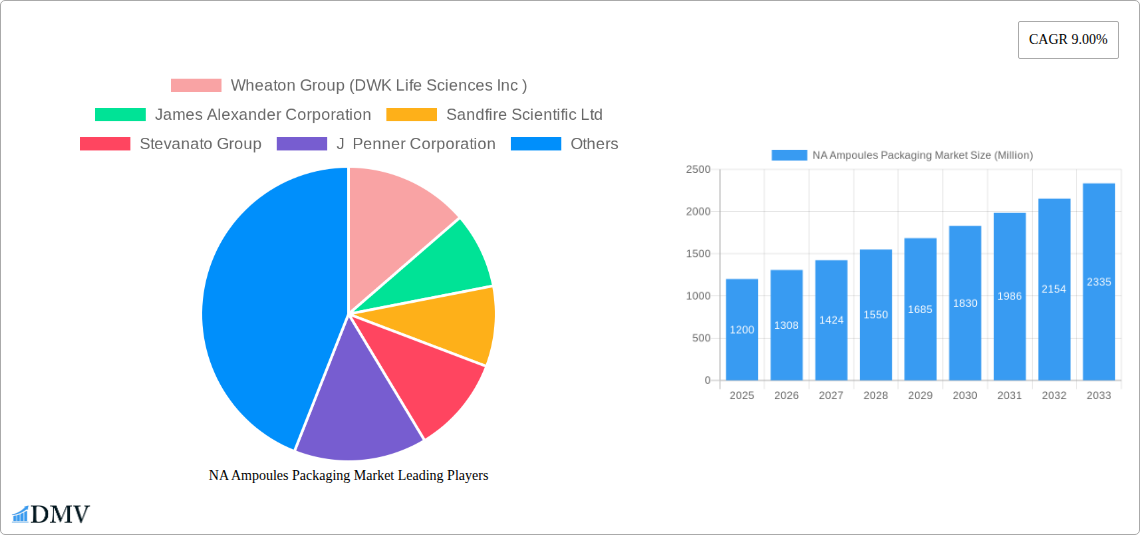
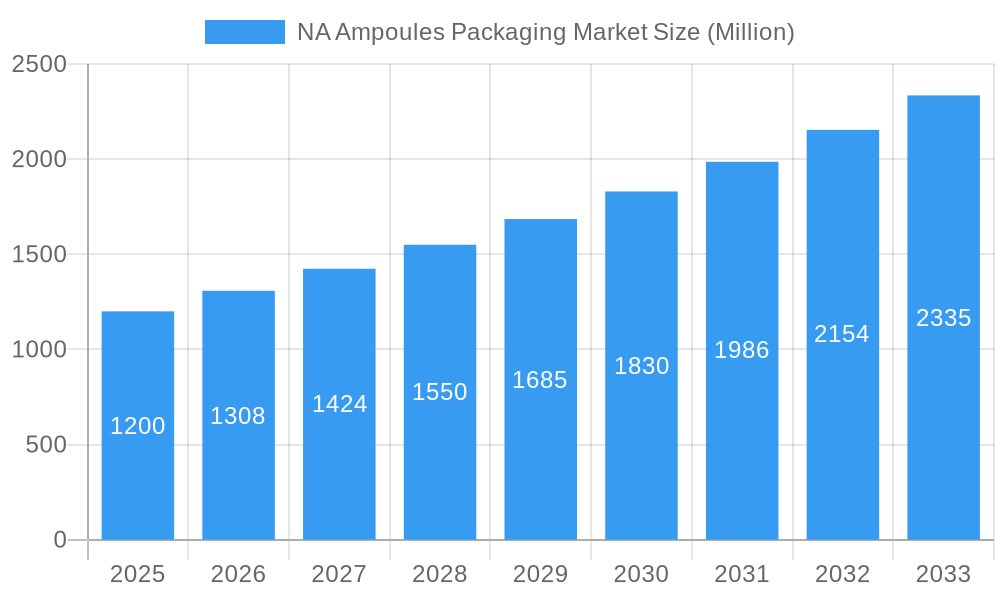
NA Ampoules Packaging Market Market Size (In Billion)
The projected Compound Annual Growth Rate (CAGR) of 9% indicates a substantial market expansion. This growth reflects the steady increase in the pharmaceutical industry's output and the focus on improving the safety and efficacy of injectable drugs. The segmentation of the market by material (glass and plastic) and country (United States and Canada) provides a granular view, allowing for targeted analysis of consumer preferences and market opportunities. Analyzing regional trends within North America reveals opportunities for expansion in both established and emerging markets. Further research into specific application areas within pharmaceuticals and the ongoing development of sustainable packaging solutions offer avenues for both established companies and new market entrants to capitalize on this growing market.
NA Ampoules Packaging Market Company Market Share
North American Ampoules Packaging Market Report: 2019-2033
This comprehensive report provides a detailed analysis of the North American (NA) ampoules packaging market, offering invaluable insights for stakeholders across the pharmaceutical and biotechnology industries. Covering the period from 2019 to 2033, with a focus on 2025, this report meticulously examines market trends, competitive dynamics, and future growth prospects. The market is expected to reach xx Million by 2033, growing at a CAGR of xx% during the forecast period (2025-2033).
NA Ampoules Packaging Market Composition & Trends
This section delves into the intricate structure of the NA ampoules packaging market, evaluating its concentration, innovation drivers, regulatory environment, and competitive landscape. We analyze the market share distribution among key players, including Wheaton Group (DWK Life Sciences Inc), James Alexander Corporation, Sandfire Scientific Ltd, Stevanato Group, J Penner Corporation, Syntegon Technology GmbH, Amposan S, and SCHOTT AG, assessing their strategic maneuvers and market dominance. The report also explores the impact of mergers and acquisitions (M&A) activities on market consolidation, quantifying deal values where available. Innovation is analyzed through the lens of material advancements (glass vs. plastic), technological integrations, and regulatory compliance, highlighting the factors shaping product development and market acceptance. Finally, we examine the influence of substitute packaging options and the evolving needs of end-users, including pharmaceutical manufacturers and contract packaging organizations. The study period is 2019-2024, with 2025 serving as the base year.
- Market Concentration: Highly fragmented, with top 5 players holding approximately xx% market share in 2025.
- Innovation Catalysts: Growing demand for sustainable packaging, advancements in barrier technologies, and increasing automation in filling lines.
- Regulatory Landscape: Stringent regulations concerning material safety and sterility, impacting product design and manufacturing processes.
- Substitute Products: Limited viable alternatives, primarily focusing on pre-filled syringes and vials, with the overall market share at approximately xx% in 2025.
- End-User Profiles: Pharmaceutical manufacturers, contract packaging organizations, and research institutions.
- M&A Activities: Analysis of major deals since 2019, with total deal value estimated at xx Million during the period.
NA Ampoules Packaging Market Industry Evolution
This section charts the evolutionary journey of the NA ampoules packaging market, exploring its growth trajectory, technological advancements, and evolving consumer preferences. We delve into the historical growth rates (2019-2024) and project future expansion (2025-2033). The analysis encompasses technological breakthroughs in materials science, automation, and sterilization techniques, assessing their impact on market dynamics. The evolving demands of pharmaceutical companies for customized packaging solutions, improved sterility assurance, and sustainable materials are carefully examined. The impact of emerging market trends such as personalized medicine and the growing adoption of biologics on packaging demand is also explored.
Leading Regions, Countries, or Segments in NA Ampoules Packaging Market
This section identifies the dominant regions, countries, and segments within the NA ampoules packaging market. A detailed analysis of the United States and Canada markets is provided, focusing on their unique characteristics, growth drivers, and challenges. The report highlights the dominance of glass ampoules over plastic, analyzing the key factors contributing to this market share disparity.
- United States:
- Key Drivers: High pharmaceutical manufacturing activity, stringent regulatory environment driving higher quality packaging adoption. Investment in automation and advanced manufacturing technologies.
- Dominance Factors: Large pharmaceutical industry, significant R&D spending, and robust regulatory framework.
- Canada:
- Key Drivers: Growing pharmaceutical industry, increased focus on biologics and specialized drug delivery systems.
- Material Segment:
- Glass: Dominant due to its inherent barrier properties, high sterility assurance, and compatibility with various pharmaceutical products.
- Plastic: Growing segment driven by cost advantages and the increasing demand for lightweight and disposable packaging.
NA Ampoules Packaging Market Product Innovations
This section showcases recent innovations in ampoule packaging, focusing on unique selling propositions and technological advancements. The report highlights new materials, improved barrier technologies, innovative designs that enhance usability and reduce breakage, and the integration of smart packaging features for enhanced traceability and tamper evidence. Examples of novel applications and performance metrics are provided, showcasing the continuous evolution of this critical component of the pharmaceutical supply chain.
Propelling Factors for NA Ampoules Packaging Market Growth
Several key factors are driving growth within the NA ampoules packaging market. Technological advancements, such as the development of new barrier materials and automated filling systems, significantly enhance production efficiency and product quality. The increasing demand for injectable pharmaceuticals, fueled by the growth in biologics and personalized medicines, fuels market expansion. Favorable regulatory environments that encourage innovation and compliance also contribute to market growth. Finally, robust economic growth in the healthcare sector provides ample opportunities for market expansion.
Obstacles in the NA Ampoules Packaging Market
Several challenges hinder the growth of the NA ampoules packaging market. Regulatory hurdles, including stringent quality and safety standards, can increase costs and complexity for manufacturers. Supply chain disruptions, particularly regarding raw materials and specialized components, can lead to production delays and increased costs. Furthermore, intense competition from established players and new entrants exerts pressure on pricing and profit margins. The overall impact of these factors is estimated to reduce market growth by approximately xx% in 2025.
Future Opportunities in NA Ampoules Packaging Market
The NA ampoules packaging market presents several promising future opportunities. The rising demand for sustainable and eco-friendly packaging materials will drive innovation in biodegradable and recyclable options. Advancements in smart packaging technologies, such as RFID tags for improved traceability, will offer enhanced product security and supply chain management. Finally, expansion into niche markets, such as personalized medicine and targeted drug delivery, will create new avenues for growth and innovation.
Major Players in the NA Ampoules Packaging Market Ecosystem
- Wheaton Group (DWK Life Sciences Inc)
- James Alexander Corporation
- Sandfire Scientific Ltd
- Stevanato Group
- J Penner Corporation
- Syntegon Technology GmbH
- Amposan S
- SCHOTT AG
Key Developments in NA Ampoules Packaging Market Industry
- January 2023: Stevanato Group announces a new investment in automated ampoule inspection technology.
- June 2022: SCHOTT AG launches a new line of sustainable glass ampoules.
- October 2021: Wheaton Group acquires a smaller packaging company, expanding its market presence.
- (Further developments to be added)
Strategic NA Ampoules Packaging Market Forecast
The NA ampoules packaging market is poised for continued growth driven by advancements in material science, automation, and increasing demand for injectable pharmaceuticals. The adoption of sustainable packaging solutions and smart technologies will further shape market dynamics. The forecasted growth rate suggests a significant expansion over the next decade, creating exciting opportunities for both established players and new entrants. The market is expected to witness considerable consolidation through mergers and acquisitions as companies seek to expand their market share and product offerings.
NA Ampoules Packaging Market Segmentation
-
1. Material
- 1.1. Glass
- 1.2. Plastic
NA Ampoules Packaging Market Segmentation By Geography
-
1. North America
- 1.1. United States
- 1.2. Canada
- 1.3. Mexico
-
2. South America
- 2.1. Brazil
- 2.2. Argentina
- 2.3. Rest of South America
-
3. Europe
- 3.1. United Kingdom
- 3.2. Germany
- 3.3. France
- 3.4. Italy
- 3.5. Spain
- 3.6. Russia
- 3.7. Benelux
- 3.8. Nordics
- 3.9. Rest of Europe
-
4. Middle East & Africa
- 4.1. Turkey
- 4.2. Israel
- 4.3. GCC
- 4.4. North Africa
- 4.5. South Africa
- 4.6. Rest of Middle East & Africa
-
5. Asia Pacific
- 5.1. China
- 5.2. India
- 5.3. Japan
- 5.4. South Korea
- 5.5. ASEAN
- 5.6. Oceania
- 5.7. Rest of Asia Pacific
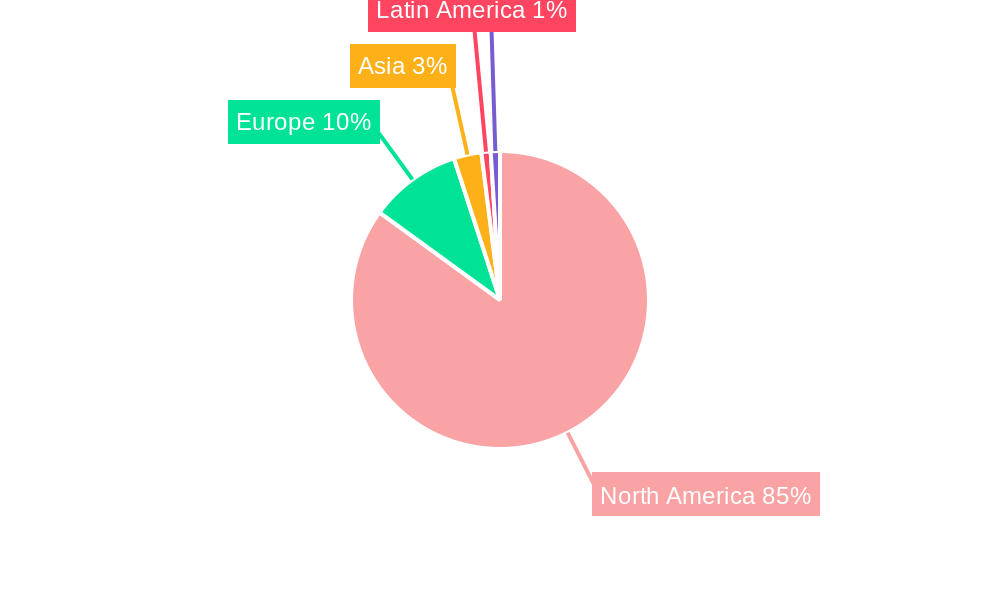
NA Ampoules Packaging Market Regional Market Share
Geographic Coverage of NA Ampoules Packaging Market
NA Ampoules Packaging Market REPORT HIGHLIGHTS
| Aspects | Details |
|---|---|
| Study Period | 2020-2034 |
| Base Year | 2025 |
| Estimated Year | 2026 |
| Forecast Period | 2026-2034 |
| Historical Period | 2020-2025 |
| Growth Rate | CAGR of 9.00% from 2020-2034 |
| Segmentation |
|
Table of Contents
- 1. Introduction
- 1.1. Research Scope
- 1.2. Market Segmentation
- 1.3. Research Objective
- 1.4. Definitions and Assumptions
- 2. Executive Summary
- 2.1. Market Snapshot
- 3. Market Dynamics
- 3.1. Market Drivers
- 3.2. Market Restrains
- 3.3. Market Trends
- 3.4. Market Opportunities
- 4. Market Factor Analysis
- 4.1. Porters Five Forces
- 4.1.1. Bargaining Power of Suppliers
- 4.1.2. Bargaining Power of Buyers
- 4.1.3. Threat of New Entrants
- 4.1.4. Threat of Substitutes
- 4.1.5. Competitive Rivalry
- 4.2. PESTEL analysis
- 4.3. BCG Analysis
- 4.3.1. Stars (High Growth, High Market Share)
- 4.3.2. Cash Cows (Low Growth, High Market Share)
- 4.3.3. Question Mark (High Growth, Low Market Share)
- 4.3.4. Dogs (Low Growth, Low Market Share)
- 4.4. Ansoff Matrix Analysis
- 4.5. Supply Chain Analysis
- 4.6. Regulatory Landscape
- 4.7. Current Market Potential and Opportunity Assessment (TAM–SAM–SOM Framework)
- 4.8. DMV Analyst Note
- 4.1. Porters Five Forces
- 5. Market Analysis, Insights and Forecast 2021-2033
- 5.1. Market Analysis, Insights and Forecast - by Material
- 5.1.1. Glass
- 5.1.2. Plastic
- 5.2. Market Analysis, Insights and Forecast - by Region
- 5.2.1. North America
- 5.2.2. South America
- 5.2.3. Europe
- 5.2.4. Middle East & Africa
- 5.2.5. Asia Pacific
- 5.1. Market Analysis, Insights and Forecast - by Material
- 6. Global NA Ampoules Packaging Market Analysis, Insights and Forecast, 2021-2033
- 6.1. Market Analysis, Insights and Forecast - by Material
- 6.1.1. Glass
- 6.1.2. Plastic
- 6.1. Market Analysis, Insights and Forecast - by Material
- 7. North America NA Ampoules Packaging Market Analysis, Insights and Forecast, 2020-2032
- 7.1. Market Analysis, Insights and Forecast - by Material
- 7.1.1. Glass
- 7.1.2. Plastic
- 7.1. Market Analysis, Insights and Forecast - by Material
- 8. South America NA Ampoules Packaging Market Analysis, Insights and Forecast, 2020-2032
- 8.1. Market Analysis, Insights and Forecast - by Material
- 8.1.1. Glass
- 8.1.2. Plastic
- 8.1. Market Analysis, Insights and Forecast - by Material
- 9. Europe NA Ampoules Packaging Market Analysis, Insights and Forecast, 2020-2032
- 9.1. Market Analysis, Insights and Forecast - by Material
- 9.1.1. Glass
- 9.1.2. Plastic
- 9.1. Market Analysis, Insights and Forecast - by Material
- 10. Middle East & Africa NA Ampoules Packaging Market Analysis, Insights and Forecast, 2020-2032
- 10.1. Market Analysis, Insights and Forecast - by Material
- 10.1.1. Glass
- 10.1.2. Plastic
- 10.1. Market Analysis, Insights and Forecast - by Material
- 11. Asia Pacific NA Ampoules Packaging Market Analysis, Insights and Forecast, 2020-2032
- 11.1. Market Analysis, Insights and Forecast - by Material
- 11.1.1. Glass
- 11.1.2. Plastic
- 11.1. Market Analysis, Insights and Forecast - by Material
- 12. Competitive Analysis
- 12.1. Company Profiles
- 12.1.1 Wheaton Group (DWK Life Sciences Inc )
- 12.1.1.1. Company Overview
- 12.1.1.2. Products
- 12.1.1.3. Company Financials
- 12.1.1.4. SWOT Analysis
- 12.1.2 James Alexander Corporation
- 12.1.2.1. Company Overview
- 12.1.2.2. Products
- 12.1.2.3. Company Financials
- 12.1.2.4. SWOT Analysis
- 12.1.3 Sandfire Scientific Ltd
- 12.1.3.1. Company Overview
- 12.1.3.2. Products
- 12.1.3.3. Company Financials
- 12.1.3.4. SWOT Analysis
- 12.1.4 Stevanato Group
- 12.1.4.1. Company Overview
- 12.1.4.2. Products
- 12.1.4.3. Company Financials
- 12.1.4.4. SWOT Analysis
- 12.1.5 J Penner Corporation
- 12.1.5.1. Company Overview
- 12.1.5.2. Products
- 12.1.5.3. Company Financials
- 12.1.5.4. SWOT Analysis
- 12.1.6 Syntegon Technology GmbH
- 12.1.6.1. Company Overview
- 12.1.6.2. Products
- 12.1.6.3. Company Financials
- 12.1.6.4. SWOT Analysis
- 12.1.7 Amposan S
- 12.1.7.1. Company Overview
- 12.1.7.2. Products
- 12.1.7.3. Company Financials
- 12.1.7.4. SWOT Analysis
- 12.1.8 SCHOTT AG
- 12.1.8.1. Company Overview
- 12.1.8.2. Products
- 12.1.8.3. Company Financials
- 12.1.8.4. SWOT Analysis
- 12.1.1 Wheaton Group (DWK Life Sciences Inc )
- 12.2. Market Entropy
- 12.2.1 Company's Key Areas Served
- 12.2.2 Recent Developments
- 12.3. Company Market Share Analysis 2025
- 12.3.1 Top 5 Companies Market Share Analysis
- 12.3.2 Top 3 Companies Market Share Analysis
- 12.4. List of Potential Customers
- 13. Research Methodology
List of Figures
- Figure 1: Global NA Ampoules Packaging Market Revenue Breakdown (Million, %) by Region 2025 & 2033
- Figure 2: North America NA Ampoules Packaging Market Revenue (Million), by Material 2025 & 2033
- Figure 3: North America NA Ampoules Packaging Market Revenue Share (%), by Material 2025 & 2033
- Figure 4: North America NA Ampoules Packaging Market Revenue (Million), by Country 2025 & 2033
- Figure 5: North America NA Ampoules Packaging Market Revenue Share (%), by Country 2025 & 2033
- Figure 6: South America NA Ampoules Packaging Market Revenue (Million), by Material 2025 & 2033
- Figure 7: South America NA Ampoules Packaging Market Revenue Share (%), by Material 2025 & 2033
- Figure 8: South America NA Ampoules Packaging Market Revenue (Million), by Country 2025 & 2033
- Figure 9: South America NA Ampoules Packaging Market Revenue Share (%), by Country 2025 & 2033
- Figure 10: Europe NA Ampoules Packaging Market Revenue (Million), by Material 2025 & 2033
- Figure 11: Europe NA Ampoules Packaging Market Revenue Share (%), by Material 2025 & 2033
- Figure 12: Europe NA Ampoules Packaging Market Revenue (Million), by Country 2025 & 2033
- Figure 13: Europe NA Ampoules Packaging Market Revenue Share (%), by Country 2025 & 2033
- Figure 14: Middle East & Africa NA Ampoules Packaging Market Revenue (Million), by Material 2025 & 2033
- Figure 15: Middle East & Africa NA Ampoules Packaging Market Revenue Share (%), by Material 2025 & 2033
- Figure 16: Middle East & Africa NA Ampoules Packaging Market Revenue (Million), by Country 2025 & 2033
- Figure 17: Middle East & Africa NA Ampoules Packaging Market Revenue Share (%), by Country 2025 & 2033
- Figure 18: Asia Pacific NA Ampoules Packaging Market Revenue (Million), by Material 2025 & 2033
- Figure 19: Asia Pacific NA Ampoules Packaging Market Revenue Share (%), by Material 2025 & 2033
- Figure 20: Asia Pacific NA Ampoules Packaging Market Revenue (Million), by Country 2025 & 2033
- Figure 21: Asia Pacific NA Ampoules Packaging Market Revenue Share (%), by Country 2025 & 2033
List of Tables
- Table 1: Global NA Ampoules Packaging Market Revenue Million Forecast, by Material 2020 & 2033
- Table 2: Global NA Ampoules Packaging Market Revenue Million Forecast, by Region 2020 & 2033
- Table 3: Global NA Ampoules Packaging Market Revenue Million Forecast, by Material 2020 & 2033
- Table 4: Global NA Ampoules Packaging Market Revenue Million Forecast, by Country 2020 & 2033
- Table 5: United States NA Ampoules Packaging Market Revenue (Million) Forecast, by Application 2020 & 2033
- Table 6: Canada NA Ampoules Packaging Market Revenue (Million) Forecast, by Application 2020 & 2033
- Table 7: Mexico NA Ampoules Packaging Market Revenue (Million) Forecast, by Application 2020 & 2033
- Table 8: Global NA Ampoules Packaging Market Revenue Million Forecast, by Material 2020 & 2033
- Table 9: Global NA Ampoules Packaging Market Revenue Million Forecast, by Country 2020 & 2033
- Table 10: Brazil NA Ampoules Packaging Market Revenue (Million) Forecast, by Application 2020 & 2033
- Table 11: Argentina NA Ampoules Packaging Market Revenue (Million) Forecast, by Application 2020 & 2033
- Table 12: Rest of South America NA Ampoules Packaging Market Revenue (Million) Forecast, by Application 2020 & 2033
- Table 13: Global NA Ampoules Packaging Market Revenue Million Forecast, by Material 2020 & 2033
- Table 14: Global NA Ampoules Packaging Market Revenue Million Forecast, by Country 2020 & 2033
- Table 15: United Kingdom NA Ampoules Packaging Market Revenue (Million) Forecast, by Application 2020 & 2033
- Table 16: Germany NA Ampoules Packaging Market Revenue (Million) Forecast, by Application 2020 & 2033
- Table 17: France NA Ampoules Packaging Market Revenue (Million) Forecast, by Application 2020 & 2033
- Table 18: Italy NA Ampoules Packaging Market Revenue (Million) Forecast, by Application 2020 & 2033
- Table 19: Spain NA Ampoules Packaging Market Revenue (Million) Forecast, by Application 2020 & 2033
- Table 20: Russia NA Ampoules Packaging Market Revenue (Million) Forecast, by Application 2020 & 2033
- Table 21: Benelux NA Ampoules Packaging Market Revenue (Million) Forecast, by Application 2020 & 2033
- Table 22: Nordics NA Ampoules Packaging Market Revenue (Million) Forecast, by Application 2020 & 2033
- Table 23: Rest of Europe NA Ampoules Packaging Market Revenue (Million) Forecast, by Application 2020 & 2033
- Table 24: Global NA Ampoules Packaging Market Revenue Million Forecast, by Material 2020 & 2033
- Table 25: Global NA Ampoules Packaging Market Revenue Million Forecast, by Country 2020 & 2033
- Table 26: Turkey NA Ampoules Packaging Market Revenue (Million) Forecast, by Application 2020 & 2033
- Table 27: Israel NA Ampoules Packaging Market Revenue (Million) Forecast, by Application 2020 & 2033
- Table 28: GCC NA Ampoules Packaging Market Revenue (Million) Forecast, by Application 2020 & 2033
- Table 29: North Africa NA Ampoules Packaging Market Revenue (Million) Forecast, by Application 2020 & 2033
- Table 30: South Africa NA Ampoules Packaging Market Revenue (Million) Forecast, by Application 2020 & 2033
- Table 31: Rest of Middle East & Africa NA Ampoules Packaging Market Revenue (Million) Forecast, by Application 2020 & 2033
- Table 32: Global NA Ampoules Packaging Market Revenue Million Forecast, by Material 2020 & 2033
- Table 33: Global NA Ampoules Packaging Market Revenue Million Forecast, by Country 2020 & 2033
- Table 34: China NA Ampoules Packaging Market Revenue (Million) Forecast, by Application 2020 & 2033
- Table 35: India NA Ampoules Packaging Market Revenue (Million) Forecast, by Application 2020 & 2033
- Table 36: Japan NA Ampoules Packaging Market Revenue (Million) Forecast, by Application 2020 & 2033
- Table 37: South Korea NA Ampoules Packaging Market Revenue (Million) Forecast, by Application 2020 & 2033
- Table 38: ASEAN NA Ampoules Packaging Market Revenue (Million) Forecast, by Application 2020 & 2033
- Table 39: Oceania NA Ampoules Packaging Market Revenue (Million) Forecast, by Application 2020 & 2033
- Table 40: Rest of Asia Pacific NA Ampoules Packaging Market Revenue (Million) Forecast, by Application 2020 & 2033
Frequently Asked Questions
1. What is the projected Compound Annual Growth Rate (CAGR) of the NA Ampoules Packaging Market?
The projected CAGR is approximately 9.00%.
2. Which companies are prominent players in the NA Ampoules Packaging Market?
Key companies in the market include Wheaton Group (DWK Life Sciences Inc ), James Alexander Corporation, Sandfire Scientific Ltd, Stevanato Group, J Penner Corporation, Syntegon Technology GmbH, Amposan S, SCHOTT AG.
3. What are the main segments of the NA Ampoules Packaging Market?
The market segments include Material.
4. Can you provide details about the market size?
The market size is estimated to be USD XX Million as of 2022.
5. What are some drivers contributing to market growth?
; Increasing Demand for Sterile and Tamper-Proof Packaging Solutions for the Pharmaceutical Industry; Stringent Government Regulations and Standards.
6. What are the notable trends driving market growth?
Pharmaceutical Industry Expected to Exhibit the Maximum Number of Adoption.
7. Are there any restraints impacting market growth?
; Concerns Regarding Dumping of Used Ampoules.
8. Can you provide examples of recent developments in the market?
N/A
9. What pricing options are available for accessing the report?
Pricing options include single-user, multi-user, and enterprise licenses priced at USD 4750, USD 4950, and USD 6800 respectively.
10. Is the market size provided in terms of value or volume?
The market size is provided in terms of value, measured in Million.
11. Are there any specific market keywords associated with the report?
Yes, the market keyword associated with the report is "NA Ampoules Packaging Market," which aids in identifying and referencing the specific market segment covered.
12. How do I determine which pricing option suits my needs best?
The pricing options vary based on user requirements and access needs. Individual users may opt for single-user licenses, while businesses requiring broader access may choose multi-user or enterprise licenses for cost-effective access to the report.
13. Are there any additional resources or data provided in the NA Ampoules Packaging Market report?
While the report offers comprehensive insights, it's advisable to review the specific contents or supplementary materials provided to ascertain if additional resources or data are available.
14. How can I stay updated on further developments or reports in the NA Ampoules Packaging Market?
To stay informed about further developments, trends, and reports in the NA Ampoules Packaging Market, consider subscribing to industry newsletters, following relevant companies and organizations, or regularly checking reputable industry news sources and publications.
Methodology
Step 1 - Identification of Relevant Samples Size from Population Database


Step 2 - Approaches for Defining Global Market Size (Value, Volume* & Price*)

Note*: In applicable scenarios
Step 3 - Data Sources
Primary Research
- Web Analytics
- Survey Reports
- Research Institute
- Latest Research Reports
- Opinion Leaders
Secondary Research
- Annual Reports
- White Paper
- Latest Press Release
- Industry Association
- Paid Database
- Investor Presentations

Step 4 - Data Triangulation
Involves using different sources of information in order to increase the validity of a study
These sources are likely to be stakeholders in a program - participants, other researchers, program staff, other community members, and so on.
Then we put all data in single framework & apply various statistical tools to find out the dynamic on the market.
During the analysis stage, feedback from the stakeholder groups would be compared to determine areas of agreement as well as areas of divergence