

Key Insights
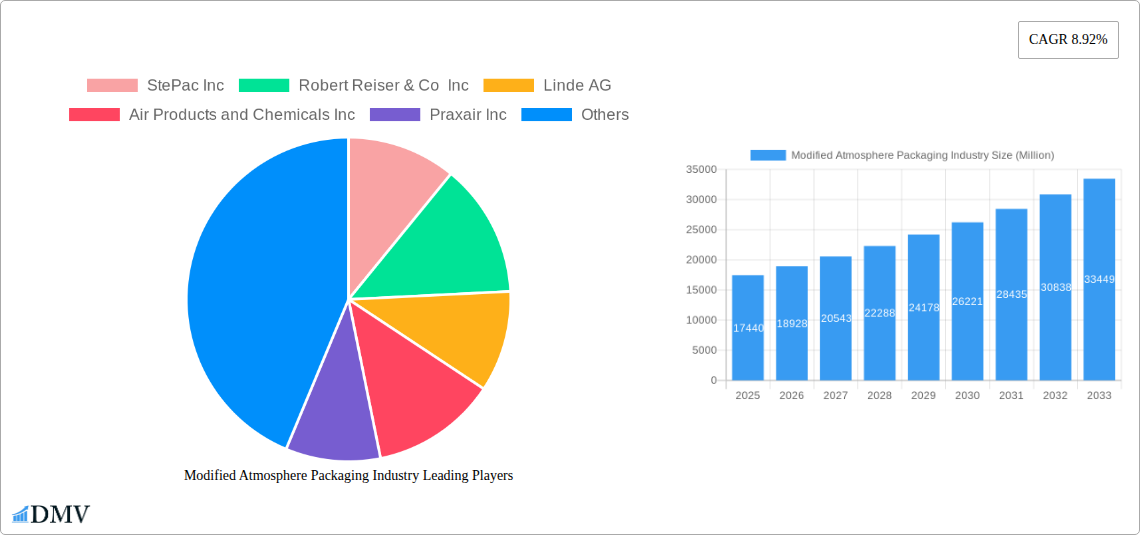
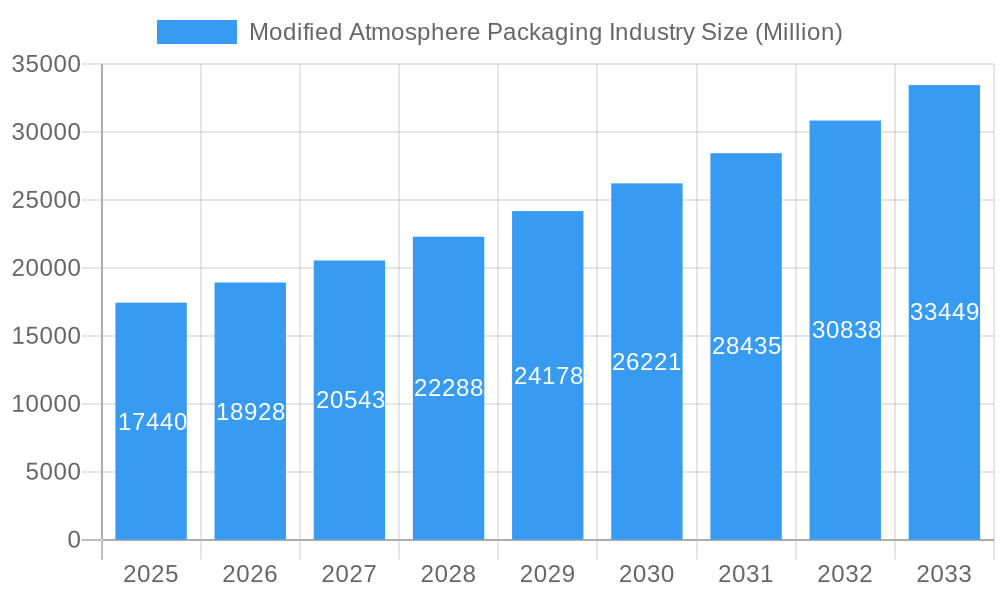
The Modified Atmosphere Packaging (MAP) industry is experiencing robust growth, projected to reach a market size of $17.44 billion in 2025 and exhibiting a Compound Annual Growth Rate (CAGR) of 8.92% from 2025 to 2033. This expansion is driven by several key factors. The increasing demand for extending the shelf life of perishable goods like fruits, vegetables, meat, and seafood is a significant catalyst. Consumers are increasingly prioritizing convenience and reduced food waste, creating a strong market for MAP solutions that maintain product freshness and quality. Furthermore, the rising adoption of MAP across various applications, including bakery and confectionery products, and even expanding into niche markets like cannabis and prepared meals, is fueling market growth. Technological advancements in packaging materials, such as the development of more sustainable and efficient films made from polyethylene (PE), polypropylene (PP), and other innovative materials, are also contributing to the industry's upward trajectory. The growing emphasis on food safety regulations and the need to minimize microbial growth further strengthens the adoption of MAP technologies. The competitive landscape includes established players like Amcor PLC, Linde AG, and Sealed Air Corporation, alongside specialized companies focusing on specific packaging gas blends and materials.
Modified Atmosphere Packaging Industry Market Size (In Billion)
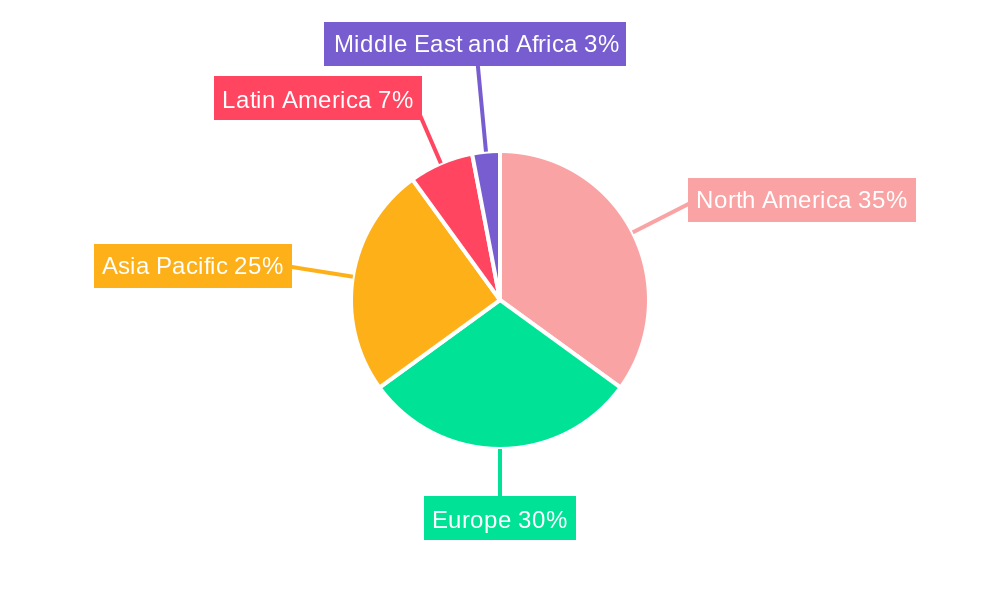
Geographical segmentation reveals a diverse market landscape. While North America and Europe currently hold significant market shares, the Asia-Pacific region is expected to demonstrate substantial growth due to rising disposable incomes, increasing urbanization, and expanding food processing industries. Challenges such as high initial investment costs for MAP technology and the potential for environmental concerns related to packaging waste need to be addressed for continued sustainable growth. However, the overall trend points towards a consistently expanding market fueled by consumer demand, technological advancements, and the imperative for minimizing food spoilage and waste. This makes the MAP industry an attractive investment opportunity with considerable potential for innovation and expansion in the coming years.
Modified Atmosphere Packaging Industry Company Market Share
Modified Atmosphere Packaging (MAP) Industry Report: 2019-2033
This comprehensive report provides an in-depth analysis of the Modified Atmosphere Packaging (MAP) industry, projecting a market value exceeding $XX Million by 2033. It covers the historical period (2019-2024), base year (2025), and forecast period (2025-2033), offering valuable insights for stakeholders across the value chain. The report meticulously analyzes market trends, technological advancements, and key players, delivering actionable intelligence for strategic decision-making.
Modified Atmosphere Packaging Industry Market Composition & Trends
The Modified Atmosphere Packaging (MAP) market is a dynamic and evolving sector, projected to reach a significant valuation of $XX Million by 2024. Its structure is characterized by a moderate level of consolidation, with prominent global players such as StePac Inc., Robert Reiser & Co Inc., Linde AG, Air Products and Chemicals Inc., Praxair Inc., Amcor PLC, Multisorb Technologies Inc., Mondi Group, Berry Global Inc., and Sealed Air Corporation commanding a substantial market share. The industry's growth is propelled by continuous innovation in advanced packaging materials, specialized gas mixtures, and sophisticated analytical technologies. Crucially, stringent global food safety regulations and an ever-increasing consumer demand for products with extended shelf life serve as major catalysts for this expansion. While substitute technologies like vacuum packaging present a competitive landscape, the MAP industry is actively experiencing a wave of strategic Mergers & Acquisitions (M&A) activity, with collective deal values exceeding $XX Million over the past five years, underscoring a strong drive towards market consolidation and portfolio expansion.
- Market Share Dynamics: The top 5 leading companies collectively hold approximately XX% of the global market share, indicating a concentrated yet competitive environment.
- Strategic M&A Landscape: The industry is witnessing significant consolidation, with acquisitions strategically aimed at broadening product offerings, enhancing technological capabilities, and expanding global market penetration.
- Regulatory Influence: A robust framework of food safety and environmental regulations plays a pivotal role in shaping the selection of packaging materials and the precise composition of atmospheric gases used in MAP.
- Key End-User Segments: The primary consumers of MAP solutions include a diverse range of entities, prominently featuring food processors, large-scale retailers, and critical logistics and distribution companies.
Modified Atmosphere Packaging Industry Industry Evolution
The Modified Atmosphere Packaging (MAP) industry has undergone a period of substantial and impressive growth, largely attributed to pioneering technological advancements and a discernible shift in consumer preferences. Between 2019 and 2024, the industry achieved a commendable Compound Annual Growth Rate (CAGR) of approximately XX%, a performance that notably outpaced many other food preservation methodologies. This robust expansion is directly fueled by breakthroughs in high-performance barrier films, optimized gas mixtures tailored for specific products, and the integration of active packaging technologies designed to proactively extend the shelf life of perishable goods and significantly minimize food waste. Furthermore, heightened consumer awareness regarding food safety standards and a growing emphasis on sustainable packaging solutions are collectively amplifying the demand for advanced MAP systems. The adoption rates of MAP technology across various food categories, particularly for fresh produce, have seen a remarkable surge, with a notable increase of XX% in adoption within the fresh produce sector recorded between 2019 and 2024. The sustained and increasing demand for convenient, safe, and longer-lasting food products is a powerful testament to the industry's strong growth trajectory.
Leading Regions, Countries, or Segments in Modified Atmosphere Packaging Industry
Currently, North America and Europe stand as the dominant forces in the global MAP market. This leadership is underpinned by their highly developed food processing sectors and the presence of rigorous food safety regulatory environments. Within the critical component of packaging gases, nitrogen emerges as the leading gas by market share, closely followed by carbon dioxide and oxygen, each playing distinct roles in atmosphere modification. In terms of packaging materials, polyethylene (PE) and polypropylene (PP) remain the materials of choice for many applications, primarily due to their favorable cost-effectiveness, excellent barrier properties, and versatility. The fruits and vegetables segment represents the largest application area for MAP, driven by the inherent perishability of these products and the significant need to extend their shelf life and maintain quality.
- Key Growth Drivers and Regional Dominance:
- North America: Characterized by high disposable incomes, a sophisticated food processing infrastructure, and stringent, well-enforced food safety standards.
- Europe: Exhibits similar strengths to North America, further augmented by robust environmental regulations that encourage and promote the adoption of sustainable packaging solutions.
- Fruits & Vegetables: This segment is a major driver due to the inherent perishability of fresh produce and the critical need for extended shelf life to reduce waste and enhance distribution capabilities.
- Nitrogen Gas: Remains a cornerstone of MAP due to its proven efficacy in effectively inhibiting microbial growth and significantly extending the shelf life of a wide array of food products.
Modified Atmosphere Packaging Industry Product Innovations
Recent innovations include the development of active and intelligent packaging incorporating sensors to monitor gas levels and product freshness. These advancements provide real-time data, improving supply chain efficiency and reducing food waste. Furthermore, advancements in barrier film technologies offer improved oxygen and moisture barriers, enhancing product protection. Unique selling propositions now include sustainable packaging options with reduced environmental impact and increased shelf life compared to conventional methods.
Propelling Factors for Modified Atmosphere Packaging Industry Growth
Technological advancements like active and intelligent packaging systems are key growth drivers. Economic factors, such as rising consumer disposable incomes and increased demand for convenient food products, also play a significant role. Stringent food safety regulations worldwide mandate extended shelf life, further propelling the adoption of MAP technologies.
Obstacles in the Modified Atmosphere Packaging Industry Market
The Modified Atmosphere Packaging (MAP) industry encounters several significant obstacles that warrant strategic attention. Chief among these are complex and evolving regulatory hurdles concerning the composition of packaging materials and the permissible usage of specific gases, which can impact innovation and market entry. Furthermore, persistent supply chain disruptions, affecting the timely availability of essential raw materials and critical packaging components, introduce considerable uncertainties into production and cost management. The competitive landscape is also intense, marked by fierce competition among established, large-scale players and the continuous emergence of agile new entrants, both of which present challenges to market share and profitability.
Future Opportunities in Modified Atmosphere Packaging Industry
Expansion into emerging markets like Asia-Pacific, driven by rising demand for processed food, presents significant growth opportunities. The development of biodegradable and compostable MAP solutions aligns with growing sustainability concerns. Furthermore, the application of MAP in new segments like cannabis packaging and transportation and logistics presents promising avenues for growth.
Major Players in the Modified Atmosphere Packaging Industry Ecosystem
- StePac Inc
- Robert Reiser & Co Inc
- Linde AG
- Air Products and Chemicals Inc
- Praxair Inc
- Amcor PLC
- Multisorb Technologies Inc
- Mondi Grou
- Berry Global Inc
- Sealed Air Corporation
Key Developments in Modified Atmosphere Packaging Industry Industry
- June 2020: Ametek Mocon significantly enhanced quality control capabilities within MAP applications with the launch of its advanced Dansensor Checkpoint 3 EC Headspace MAP Gas Analyzer.
- February 2021: Demonstrating a commitment to expanding its production capacity and global footprint, Berry Global Group made a substantial investment exceeding USD 70 Million to bolster its wipe substrate capabilities within the United States.
Strategic Modified Atmosphere Packaging Industry Market Forecast
The MAP industry is poised for continued growth, driven by innovation, expanding applications, and increasing consumer demand for longer-lasting, convenient food products. The market is expected to reach $XX Million by 2033, representing a substantial opportunity for key players and new entrants alike. Focusing on sustainable and innovative solutions will be crucial for success in this dynamic market.
Modified Atmosphere Packaging Industry Segmentation
-
1. Packaging Gas
- 1.1. Oxygen
- 1.2. Nitrogen
- 1.3. Carbon Dioxide
- 1.4. Other Packaging Gases
-
2. Packaging Material
- 2.1. Polyvinylchloride (PVC)
- 2.2. Polyethylene (PE)
- 2.3. Polypropylene (PP)
- 2.4. Other Packaging Materials
-
3. Application
- 3.1. Fruits and Vegetables
- 3.2. Poultry, Seafood, and Meat Products
- 3.3. Bakery and Confectionery
- 3.4. Other Ap
Modified Atmosphere Packaging Industry Segmentation By Geography
- 1. North America
- 2. Europe
- 3. Asia Pacific
- 4. Latin America
- 5. Middle East and Africa
Modified Atmosphere Packaging Industry Regional Market Share
Geographic Coverage of Modified Atmosphere Packaging Industry
Modified Atmosphere Packaging Industry REPORT HIGHLIGHTS
| Aspects | Details |
|---|---|
| Study Period | 2020-2034 |
| Base Year | 2025 |
| Estimated Year | 2026 |
| Forecast Period | 2026-2034 |
| Historical Period | 2020-2025 |
| Growth Rate | CAGR of 8.92% from 2020-2034 |
| Segmentation |
|
Table of Contents
- 1. Introduction
- 1.1. Research Scope
- 1.2. Market Segmentation
- 1.3. Research Objective
- 1.4. Definitions and Assumptions
- 2. Executive Summary
- 2.1. Market Snapshot
- 3. Market Dynamics
- 3.1. Market Drivers
- 3.2. Market Restrains
- 3.3. Market Trends
- 3.4. Market Opportunities
- 4. Market Factor Analysis
- 4.1. Porters Five Forces
- 4.1.1. Bargaining Power of Suppliers
- 4.1.2. Bargaining Power of Buyers
- 4.1.3. Threat of New Entrants
- 4.1.4. Threat of Substitutes
- 4.1.5. Competitive Rivalry
- 4.2. PESTEL analysis
- 4.3. BCG Analysis
- 4.3.1. Stars (High Growth, High Market Share)
- 4.3.2. Cash Cows (Low Growth, High Market Share)
- 4.3.3. Question Mark (High Growth, Low Market Share)
- 4.3.4. Dogs (Low Growth, Low Market Share)
- 4.4. Ansoff Matrix Analysis
- 4.5. Supply Chain Analysis
- 4.6. Regulatory Landscape
- 4.7. Current Market Potential and Opportunity Assessment (TAM–SAM–SOM Framework)
- 4.8. DMV Analyst Note
- 4.1. Porters Five Forces
- 5. Market Analysis, Insights and Forecast 2021-2033
- 5.1. Market Analysis, Insights and Forecast - by Packaging Gas
- 5.1.1. Oxygen
- 5.1.2. Nitrogen
- 5.1.3. Carbon Dioxide
- 5.1.4. Other Packaging Gases
- 5.2. Market Analysis, Insights and Forecast - by Packaging Material
- 5.2.1. Polyvinylchloride (PVC)
- 5.2.2. Polyethylene (PE)
- 5.2.3. Polypropylene (PP)
- 5.2.4. Other Packaging Materials
- 5.3. Market Analysis, Insights and Forecast - by Application
- 5.3.1. Fruits and Vegetables
- 5.3.2. Poultry, Seafood, and Meat Products
- 5.3.3. Bakery and Confectionery
- 5.3.4. Other Ap
- 5.4. Market Analysis, Insights and Forecast - by Region
- 5.4.1. North America
- 5.4.2. Europe
- 5.4.3. Asia Pacific
- 5.4.4. Latin America
- 5.4.5. Middle East and Africa
- 5.1. Market Analysis, Insights and Forecast - by Packaging Gas
- 6. Global Modified Atmosphere Packaging Industry Analysis, Insights and Forecast, 2021-2033
- 6.1. Market Analysis, Insights and Forecast - by Packaging Gas
- 6.1.1. Oxygen
- 6.1.2. Nitrogen
- 6.1.3. Carbon Dioxide
- 6.1.4. Other Packaging Gases
- 6.2. Market Analysis, Insights and Forecast - by Packaging Material
- 6.2.1. Polyvinylchloride (PVC)
- 6.2.2. Polyethylene (PE)
- 6.2.3. Polypropylene (PP)
- 6.2.4. Other Packaging Materials
- 6.3. Market Analysis, Insights and Forecast - by Application
- 6.3.1. Fruits and Vegetables
- 6.3.2. Poultry, Seafood, and Meat Products
- 6.3.3. Bakery and Confectionery
- 6.3.4. Other Ap
- 6.1. Market Analysis, Insights and Forecast - by Packaging Gas
- 7. North America Modified Atmosphere Packaging Industry Analysis, Insights and Forecast, 2020-2032
- 7.1. Market Analysis, Insights and Forecast - by Packaging Gas
- 7.1.1. Oxygen
- 7.1.2. Nitrogen
- 7.1.3. Carbon Dioxide
- 7.1.4. Other Packaging Gases
- 7.2. Market Analysis, Insights and Forecast - by Packaging Material
- 7.2.1. Polyvinylchloride (PVC)
- 7.2.2. Polyethylene (PE)
- 7.2.3. Polypropylene (PP)
- 7.2.4. Other Packaging Materials
- 7.3. Market Analysis, Insights and Forecast - by Application
- 7.3.1. Fruits and Vegetables
- 7.3.2. Poultry, Seafood, and Meat Products
- 7.3.3. Bakery and Confectionery
- 7.3.4. Other Ap
- 7.1. Market Analysis, Insights and Forecast - by Packaging Gas
- 8. Europe Modified Atmosphere Packaging Industry Analysis, Insights and Forecast, 2020-2032
- 8.1. Market Analysis, Insights and Forecast - by Packaging Gas
- 8.1.1. Oxygen
- 8.1.2. Nitrogen
- 8.1.3. Carbon Dioxide
- 8.1.4. Other Packaging Gases
- 8.2. Market Analysis, Insights and Forecast - by Packaging Material
- 8.2.1. Polyvinylchloride (PVC)
- 8.2.2. Polyethylene (PE)
- 8.2.3. Polypropylene (PP)
- 8.2.4. Other Packaging Materials
- 8.3. Market Analysis, Insights and Forecast - by Application
- 8.3.1. Fruits and Vegetables
- 8.3.2. Poultry, Seafood, and Meat Products
- 8.3.3. Bakery and Confectionery
- 8.3.4. Other Ap
- 8.1. Market Analysis, Insights and Forecast - by Packaging Gas
- 9. Asia Pacific Modified Atmosphere Packaging Industry Analysis, Insights and Forecast, 2020-2032
- 9.1. Market Analysis, Insights and Forecast - by Packaging Gas
- 9.1.1. Oxygen
- 9.1.2. Nitrogen
- 9.1.3. Carbon Dioxide
- 9.1.4. Other Packaging Gases
- 9.2. Market Analysis, Insights and Forecast - by Packaging Material
- 9.2.1. Polyvinylchloride (PVC)
- 9.2.2. Polyethylene (PE)
- 9.2.3. Polypropylene (PP)
- 9.2.4. Other Packaging Materials
- 9.3. Market Analysis, Insights and Forecast - by Application
- 9.3.1. Fruits and Vegetables
- 9.3.2. Poultry, Seafood, and Meat Products
- 9.3.3. Bakery and Confectionery
- 9.3.4. Other Ap
- 9.1. Market Analysis, Insights and Forecast - by Packaging Gas
- 10. Latin America Modified Atmosphere Packaging Industry Analysis, Insights and Forecast, 2020-2032
- 10.1. Market Analysis, Insights and Forecast - by Packaging Gas
- 10.1.1. Oxygen
- 10.1.2. Nitrogen
- 10.1.3. Carbon Dioxide
- 10.1.4. Other Packaging Gases
- 10.2. Market Analysis, Insights and Forecast - by Packaging Material
- 10.2.1. Polyvinylchloride (PVC)
- 10.2.2. Polyethylene (PE)
- 10.2.3. Polypropylene (PP)
- 10.2.4. Other Packaging Materials
- 10.3. Market Analysis, Insights and Forecast - by Application
- 10.3.1. Fruits and Vegetables
- 10.3.2. Poultry, Seafood, and Meat Products
- 10.3.3. Bakery and Confectionery
- 10.3.4. Other Ap
- 10.1. Market Analysis, Insights and Forecast - by Packaging Gas
- 11. Middle East and Africa Modified Atmosphere Packaging Industry Analysis, Insights and Forecast, 2020-2032
- 11.1. Market Analysis, Insights and Forecast - by Packaging Gas
- 11.1.1. Oxygen
- 11.1.2. Nitrogen
- 11.1.3. Carbon Dioxide
- 11.1.4. Other Packaging Gases
- 11.2. Market Analysis, Insights and Forecast - by Packaging Material
- 11.2.1. Polyvinylchloride (PVC)
- 11.2.2. Polyethylene (PE)
- 11.2.3. Polypropylene (PP)
- 11.2.4. Other Packaging Materials
- 11.3. Market Analysis, Insights and Forecast - by Application
- 11.3.1. Fruits and Vegetables
- 11.3.2. Poultry, Seafood, and Meat Products
- 11.3.3. Bakery and Confectionery
- 11.3.4. Other Ap
- 11.1. Market Analysis, Insights and Forecast - by Packaging Gas
- 12. Competitive Analysis
- 12.1. Company Profiles
- 12.1.1 StePac Inc
- 12.1.1.1. Company Overview
- 12.1.1.2. Products
- 12.1.1.3. Company Financials
- 12.1.1.4. SWOT Analysis
- 12.1.2 Robert Reiser & Co Inc
- 12.1.2.1. Company Overview
- 12.1.2.2. Products
- 12.1.2.3. Company Financials
- 12.1.2.4. SWOT Analysis
- 12.1.3 Linde AG
- 12.1.3.1. Company Overview
- 12.1.3.2. Products
- 12.1.3.3. Company Financials
- 12.1.3.4. SWOT Analysis
- 12.1.4 Air Products and Chemicals Inc
- 12.1.4.1. Company Overview
- 12.1.4.2. Products
- 12.1.4.3. Company Financials
- 12.1.4.4. SWOT Analysis
- 12.1.5 Praxair Inc
- 12.1.5.1. Company Overview
- 12.1.5.2. Products
- 12.1.5.3. Company Financials
- 12.1.5.4. SWOT Analysis
- 12.1.6 Amcor PLC
- 12.1.6.1. Company Overview
- 12.1.6.2. Products
- 12.1.6.3. Company Financials
- 12.1.6.4. SWOT Analysis
- 12.1.7 Multisorb Technologies Inc
- 12.1.7.1. Company Overview
- 12.1.7.2. Products
- 12.1.7.3. Company Financials
- 12.1.7.4. SWOT Analysis
- 12.1.8 Mondi Grou
- 12.1.8.1. Company Overview
- 12.1.8.2. Products
- 12.1.8.3. Company Financials
- 12.1.8.4. SWOT Analysis
- 12.1.9 Berry Global Inc
- 12.1.9.1. Company Overview
- 12.1.9.2. Products
- 12.1.9.3. Company Financials
- 12.1.9.4. SWOT Analysis
- 12.1.10 Sealed Air Corporation
- 12.1.10.1. Company Overview
- 12.1.10.2. Products
- 12.1.10.3. Company Financials
- 12.1.10.4. SWOT Analysis
- 12.1.1 StePac Inc
- 12.2. Market Entropy
- 12.2.1 Company's Key Areas Served
- 12.2.2 Recent Developments
- 12.3. Company Market Share Analysis 2025
- 12.3.1 Top 5 Companies Market Share Analysis
- 12.3.2 Top 3 Companies Market Share Analysis
- 12.4. List of Potential Customers
- 13. Research Methodology
List of Figures
- Figure 1: Global Modified Atmosphere Packaging Industry Revenue Breakdown (Million, %) by Region 2025 & 2033
- Figure 2: North America Modified Atmosphere Packaging Industry Revenue (Million), by Packaging Gas 2025 & 2033
- Figure 3: North America Modified Atmosphere Packaging Industry Revenue Share (%), by Packaging Gas 2025 & 2033
- Figure 4: North America Modified Atmosphere Packaging Industry Revenue (Million), by Packaging Material 2025 & 2033
- Figure 5: North America Modified Atmosphere Packaging Industry Revenue Share (%), by Packaging Material 2025 & 2033
- Figure 6: North America Modified Atmosphere Packaging Industry Revenue (Million), by Application 2025 & 2033
- Figure 7: North America Modified Atmosphere Packaging Industry Revenue Share (%), by Application 2025 & 2033
- Figure 8: North America Modified Atmosphere Packaging Industry Revenue (Million), by Country 2025 & 2033
- Figure 9: North America Modified Atmosphere Packaging Industry Revenue Share (%), by Country 2025 & 2033
- Figure 10: Europe Modified Atmosphere Packaging Industry Revenue (Million), by Packaging Gas 2025 & 2033
- Figure 11: Europe Modified Atmosphere Packaging Industry Revenue Share (%), by Packaging Gas 2025 & 2033
- Figure 12: Europe Modified Atmosphere Packaging Industry Revenue (Million), by Packaging Material 2025 & 2033
- Figure 13: Europe Modified Atmosphere Packaging Industry Revenue Share (%), by Packaging Material 2025 & 2033
- Figure 14: Europe Modified Atmosphere Packaging Industry Revenue (Million), by Application 2025 & 2033
- Figure 15: Europe Modified Atmosphere Packaging Industry Revenue Share (%), by Application 2025 & 2033
- Figure 16: Europe Modified Atmosphere Packaging Industry Revenue (Million), by Country 2025 & 2033
- Figure 17: Europe Modified Atmosphere Packaging Industry Revenue Share (%), by Country 2025 & 2033
- Figure 18: Asia Pacific Modified Atmosphere Packaging Industry Revenue (Million), by Packaging Gas 2025 & 2033
- Figure 19: Asia Pacific Modified Atmosphere Packaging Industry Revenue Share (%), by Packaging Gas 2025 & 2033
- Figure 20: Asia Pacific Modified Atmosphere Packaging Industry Revenue (Million), by Packaging Material 2025 & 2033
- Figure 21: Asia Pacific Modified Atmosphere Packaging Industry Revenue Share (%), by Packaging Material 2025 & 2033
- Figure 22: Asia Pacific Modified Atmosphere Packaging Industry Revenue (Million), by Application 2025 & 2033
- Figure 23: Asia Pacific Modified Atmosphere Packaging Industry Revenue Share (%), by Application 2025 & 2033
- Figure 24: Asia Pacific Modified Atmosphere Packaging Industry Revenue (Million), by Country 2025 & 2033
- Figure 25: Asia Pacific Modified Atmosphere Packaging Industry Revenue Share (%), by Country 2025 & 2033
- Figure 26: Latin America Modified Atmosphere Packaging Industry Revenue (Million), by Packaging Gas 2025 & 2033
- Figure 27: Latin America Modified Atmosphere Packaging Industry Revenue Share (%), by Packaging Gas 2025 & 2033
- Figure 28: Latin America Modified Atmosphere Packaging Industry Revenue (Million), by Packaging Material 2025 & 2033
- Figure 29: Latin America Modified Atmosphere Packaging Industry Revenue Share (%), by Packaging Material 2025 & 2033
- Figure 30: Latin America Modified Atmosphere Packaging Industry Revenue (Million), by Application 2025 & 2033
- Figure 31: Latin America Modified Atmosphere Packaging Industry Revenue Share (%), by Application 2025 & 2033
- Figure 32: Latin America Modified Atmosphere Packaging Industry Revenue (Million), by Country 2025 & 2033
- Figure 33: Latin America Modified Atmosphere Packaging Industry Revenue Share (%), by Country 2025 & 2033
- Figure 34: Middle East and Africa Modified Atmosphere Packaging Industry Revenue (Million), by Packaging Gas 2025 & 2033
- Figure 35: Middle East and Africa Modified Atmosphere Packaging Industry Revenue Share (%), by Packaging Gas 2025 & 2033
- Figure 36: Middle East and Africa Modified Atmosphere Packaging Industry Revenue (Million), by Packaging Material 2025 & 2033
- Figure 37: Middle East and Africa Modified Atmosphere Packaging Industry Revenue Share (%), by Packaging Material 2025 & 2033
- Figure 38: Middle East and Africa Modified Atmosphere Packaging Industry Revenue (Million), by Application 2025 & 2033
- Figure 39: Middle East and Africa Modified Atmosphere Packaging Industry Revenue Share (%), by Application 2025 & 2033
- Figure 40: Middle East and Africa Modified Atmosphere Packaging Industry Revenue (Million), by Country 2025 & 2033
- Figure 41: Middle East and Africa Modified Atmosphere Packaging Industry Revenue Share (%), by Country 2025 & 2033
List of Tables
- Table 1: Global Modified Atmosphere Packaging Industry Revenue Million Forecast, by Packaging Gas 2020 & 2033
- Table 2: Global Modified Atmosphere Packaging Industry Revenue Million Forecast, by Packaging Material 2020 & 2033
- Table 3: Global Modified Atmosphere Packaging Industry Revenue Million Forecast, by Application 2020 & 2033
- Table 4: Global Modified Atmosphere Packaging Industry Revenue Million Forecast, by Region 2020 & 2033
- Table 5: Global Modified Atmosphere Packaging Industry Revenue Million Forecast, by Packaging Gas 2020 & 2033
- Table 6: Global Modified Atmosphere Packaging Industry Revenue Million Forecast, by Packaging Material 2020 & 2033
- Table 7: Global Modified Atmosphere Packaging Industry Revenue Million Forecast, by Application 2020 & 2033
- Table 8: Global Modified Atmosphere Packaging Industry Revenue Million Forecast, by Country 2020 & 2033
- Table 9: Global Modified Atmosphere Packaging Industry Revenue Million Forecast, by Packaging Gas 2020 & 2033
- Table 10: Global Modified Atmosphere Packaging Industry Revenue Million Forecast, by Packaging Material 2020 & 2033
- Table 11: Global Modified Atmosphere Packaging Industry Revenue Million Forecast, by Application 2020 & 2033
- Table 12: Global Modified Atmosphere Packaging Industry Revenue Million Forecast, by Country 2020 & 2033
- Table 13: Global Modified Atmosphere Packaging Industry Revenue Million Forecast, by Packaging Gas 2020 & 2033
- Table 14: Global Modified Atmosphere Packaging Industry Revenue Million Forecast, by Packaging Material 2020 & 2033
- Table 15: Global Modified Atmosphere Packaging Industry Revenue Million Forecast, by Application 2020 & 2033
- Table 16: Global Modified Atmosphere Packaging Industry Revenue Million Forecast, by Country 2020 & 2033
- Table 17: Global Modified Atmosphere Packaging Industry Revenue Million Forecast, by Packaging Gas 2020 & 2033
- Table 18: Global Modified Atmosphere Packaging Industry Revenue Million Forecast, by Packaging Material 2020 & 2033
- Table 19: Global Modified Atmosphere Packaging Industry Revenue Million Forecast, by Application 2020 & 2033
- Table 20: Global Modified Atmosphere Packaging Industry Revenue Million Forecast, by Country 2020 & 2033
- Table 21: Global Modified Atmosphere Packaging Industry Revenue Million Forecast, by Packaging Gas 2020 & 2033
- Table 22: Global Modified Atmosphere Packaging Industry Revenue Million Forecast, by Packaging Material 2020 & 2033
- Table 23: Global Modified Atmosphere Packaging Industry Revenue Million Forecast, by Application 2020 & 2033
- Table 24: Global Modified Atmosphere Packaging Industry Revenue Million Forecast, by Country 2020 & 2033
Frequently Asked Questions
1. What is the projected Compound Annual Growth Rate (CAGR) of the Modified Atmosphere Packaging Industry?
The projected CAGR is approximately 8.92%.
2. Which companies are prominent players in the Modified Atmosphere Packaging Industry?
Key companies in the market include StePac Inc, Robert Reiser & Co Inc, Linde AG, Air Products and Chemicals Inc, Praxair Inc, Amcor PLC, Multisorb Technologies Inc, Mondi Grou, Berry Global Inc, Sealed Air Corporation.
3. What are the main segments of the Modified Atmosphere Packaging Industry?
The market segments include Packaging Gas, Packaging Material, Application.
4. Can you provide details about the market size?
The market size is estimated to be USD 17.44 Million as of 2022.
5. What are some drivers contributing to market growth?
Rising Demand for Longer Shelf Life; Increasing Demand for Ready to Eat Food Items in the Developing Economies.
6. What are the notable trends driving market growth?
Carbon Dioxide is Expected to Hold a Major Position in the Market.
7. Are there any restraints impacting market growth?
High Investment Costs for MAP Equipment; Stringent Environmental Regulations.
8. Can you provide examples of recent developments in the market?
February 2021 - Berry Global Group, Inc., made investment of over USD 70 million in its United States wipe substrate capabilities. The investment includes a new line, producing additional capacity, and enabling the Company to better serve its global customers as well as support the continuing growth of its business.
9. What pricing options are available for accessing the report?
Pricing options include single-user, multi-user, and enterprise licenses priced at USD 4750, USD 5250, and USD 8750 respectively.
10. Is the market size provided in terms of value or volume?
The market size is provided in terms of value, measured in Million.
11. Are there any specific market keywords associated with the report?
Yes, the market keyword associated with the report is "Modified Atmosphere Packaging Industry," which aids in identifying and referencing the specific market segment covered.
12. How do I determine which pricing option suits my needs best?
The pricing options vary based on user requirements and access needs. Individual users may opt for single-user licenses, while businesses requiring broader access may choose multi-user or enterprise licenses for cost-effective access to the report.
13. Are there any additional resources or data provided in the Modified Atmosphere Packaging Industry report?
While the report offers comprehensive insights, it's advisable to review the specific contents or supplementary materials provided to ascertain if additional resources or data are available.
14. How can I stay updated on further developments or reports in the Modified Atmosphere Packaging Industry?
To stay informed about further developments, trends, and reports in the Modified Atmosphere Packaging Industry, consider subscribing to industry newsletters, following relevant companies and organizations, or regularly checking reputable industry news sources and publications.
Methodology
Step 1 - Identification of Relevant Samples Size from Population Database


Step 2 - Approaches for Defining Global Market Size (Value, Volume* & Price*)

Note*: In applicable scenarios
Step 3 - Data Sources
Primary Research
- Web Analytics
- Survey Reports
- Research Institute
- Latest Research Reports
- Opinion Leaders
Secondary Research
- Annual Reports
- White Paper
- Latest Press Release
- Industry Association
- Paid Database
- Investor Presentations

Step 4 - Data Triangulation
Involves using different sources of information in order to increase the validity of a study
These sources are likely to be stakeholders in a program - participants, other researchers, program staff, other community members, and so on.
Then we put all data in single framework & apply various statistical tools to find out the dynamic on the market.
During the analysis stage, feedback from the stakeholder groups would be compared to determine areas of agreement as well as areas of divergence