

Key Insights
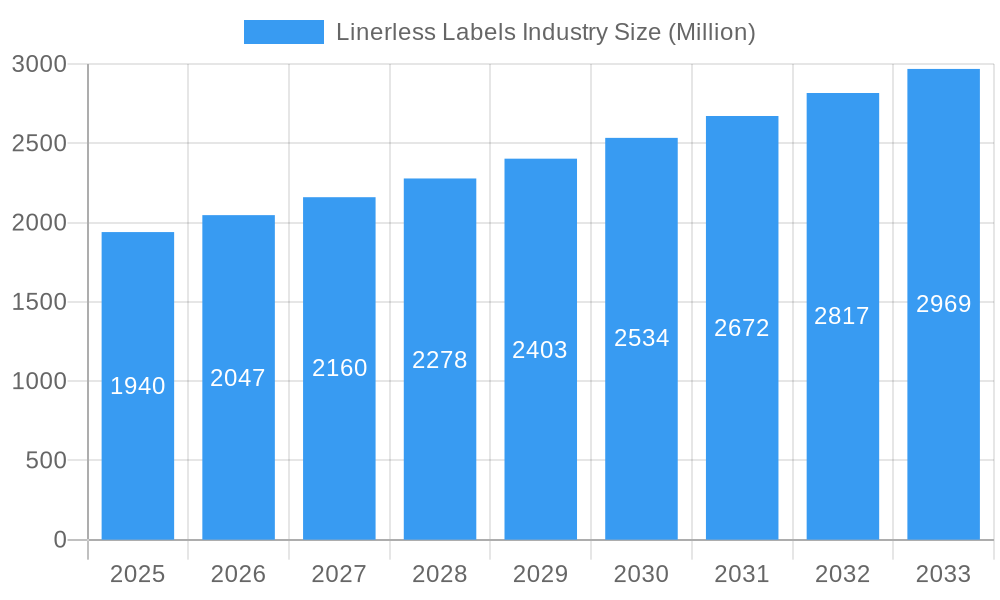
The linerless label market, valued at $1.94 billion in 2025, is projected to experience robust growth, driven by the increasing demand for sustainable packaging solutions and the rising adoption of e-commerce. The market's Compound Annual Growth Rate (CAGR) of 5.28% from 2019 to 2024 indicates a steady upward trajectory, expected to continue through 2033. Key drivers include the growing focus on reducing waste and environmental impact, alongside the convenience and efficiency offered by linerless labels in high-speed packaging applications. The food and beverage sector is a major end-user, followed by healthcare and cosmetics, each contributing significantly to market demand. Technological advancements in printing techniques, particularly the adoption of digital printing for shorter print runs and personalized labels, further fuel market expansion. While the market faces certain restraints like the higher initial investment in linerless labeling equipment compared to traditional methods, the long-term cost savings and sustainability benefits are compelling businesses to adopt this technology. The segmentation by printing technology (gravure, flexography, digital, others) reveals a dynamic landscape, with digital printing expected to gain significant market share due to its versatility and flexibility. Geographic analysis shows strong growth potential in the Asia-Pacific region, driven by rapid industrialization and increased consumer demand. North America and Europe also remain substantial markets.
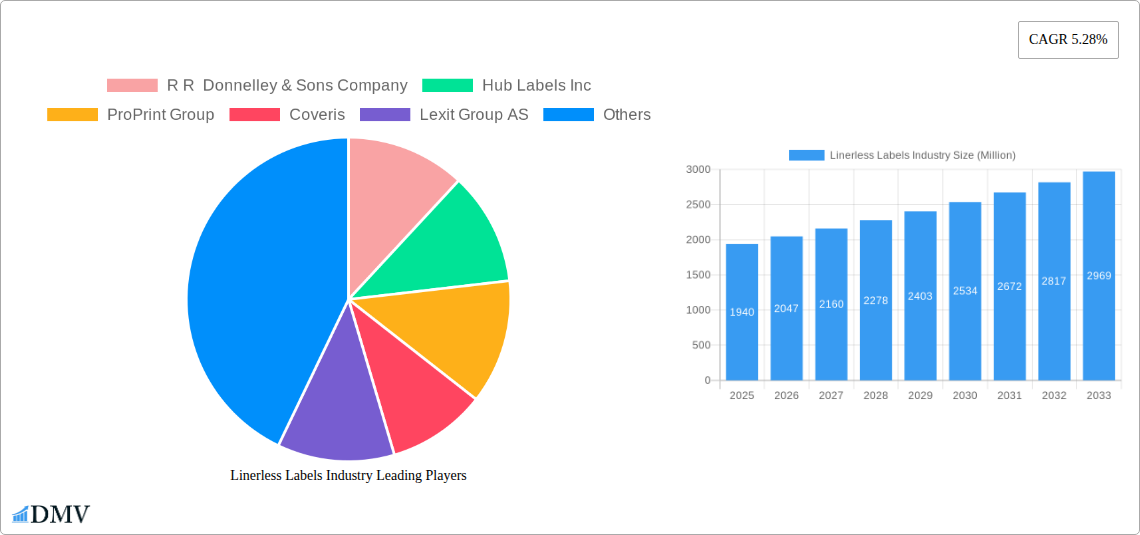
Linerless Labels Industry Market Size (In Billion)
The competitive landscape is marked by a mix of large multinational corporations and specialized label manufacturers. Companies like R R Donnelley & Sons Company, Hub Labels Inc., and Coveris are major players, leveraging their established infrastructure and expertise. However, smaller, agile companies specializing in digital printing and innovative label solutions are also emerging as key competitors. The future success within this market will depend on a company's ability to offer sustainable, cost-effective, and technologically advanced linerless label solutions tailored to the specific needs of various end-user industries. The market's continued expansion is expected to be driven by a continued focus on sustainability initiatives and advancements in printing technology that will further increase both efficiency and customization options.
Linerless Labels Industry Company Market Share
Linerless Labels Industry: A Comprehensive Market Report (2019-2033)
This insightful report provides a detailed analysis of the Linerless Labels market, projecting a robust growth trajectory from 2019 to 2033. Valued at XX Million in 2025 (Estimated Year), the market is poised for significant expansion, driven by technological advancements and evolving consumer preferences. This report examines key market dynamics, competitive landscapes, and future opportunities, providing crucial insights for stakeholders across the value chain. The study period covers 2019-2033, with 2025 as the base year and a forecast period spanning 2025-2033. The historical period analyzed is 2019-2024.
Linerless Labels Industry Market Composition & Trends
The Linerless Labels market exhibits a moderately consolidated structure, with key players such as R R Donnelley & Sons Company, Hub Labels Inc, ProPrint Group, Coveris, Lexit Group AS, Gipako UAB, Optimum Group, Skanem AS, NAStar Inc, Reflex Labels Ltd, Innovia Films (CCL Industries), and SATO Europe GmbH holding significant market share. However, the market also features several smaller, niche players. Market share distribution is dynamic, with ongoing M&A activity influencing the competitive landscape. Recent deals, though not all publicly disclosed, suggest a total M&A deal value of approximately XX Million in the last 5 years. Innovation is a key catalyst, driven by advancements in printing technologies (flexography, digital, gravure) and material science, leading to improved label performance and sustainability. Regulatory landscapes, varying across regions, influence material choices and labeling requirements. Substitute products, such as traditional pressure-sensitive labels, present ongoing competition. End-user profiles are diverse, spanning food, beverage, healthcare, cosmetics, household, industrial, and logistics sectors.
- Market Concentration: Moderately Consolidated
- Innovation Catalysts: Advancements in printing and material science
- Regulatory Landscape: Varies by region, impacting material choices
- Substitute Products: Traditional pressure-sensitive labels
- M&A Activity: XX Million in deal value over the last 5 years (estimated)
Linerless Labels Industry Evolution
The Linerless Labels market has witnessed significant growth throughout the historical period (2019-2024), with a Compound Annual Growth Rate (CAGR) of XX%. This growth is primarily attributed to increasing demand for sustainable packaging solutions, coupled with advancements in printing technologies enabling higher quality and cost-effective linerless label production. The shift towards e-commerce and personalized products has further fueled market expansion. Technological advancements, including the adoption of digital printing and improved adhesive technologies, have significantly enhanced label performance and application versatility. Consumer demand for environmentally friendly packaging is a major driving force, promoting the adoption of linerless labels due to their reduced material usage and waste generation. Adoption rates for linerless labels are accelerating across various end-user industries, particularly in the food and beverage and healthcare sectors. Growth is projected to continue at a CAGR of XX% during the forecast period (2025-2033), reaching a market value of XX Million by 2033.
Leading Regions, Countries, or Segments in Linerless Labels Industry
The North American region currently dominates the Linerless Labels market, driven by robust demand from the food and beverage, healthcare, and logistics sectors. Europe follows closely, with significant growth in Western European countries. Within end-user industries, food and beverage lead, followed by healthcare and cosmetics. Flexography remains the dominant printing technology, although digital printing is gaining traction due to its versatility and cost-effectiveness for shorter print runs.
- Key Drivers for North American Dominance: Strong demand from multiple end-user sectors, established manufacturing infrastructure, and early adoption of linerless technology.
- Key Drivers for Food & Beverage Segment Leadership: Growing consumer demand for sustainable packaging, increasing product variety, and the need for high-quality, visually appealing labels.
- Key Drivers for Flexography Dominance: Established infrastructure, cost-effectiveness for large-scale production, and suitability for various label materials.
Linerless Labels Industry Product Innovations
Recent innovations in linerless label technology focus on enhancing adhesive performance, improving printability on various substrates, and expanding application versatility. New adhesive formulations provide better adhesion to challenging surfaces while maintaining ease of application. Advances in printing technologies, particularly digital printing, allow for highly customized and personalized labels. These innovations are driven by the need for sustainable, high-performing labels that meet the evolving demands of various end-user industries. Unique selling propositions center around improved sustainability, enhanced printability, and cost-effectiveness.
Propelling Factors for Linerless Labels Industry Growth
Several factors are driving the growth of the linerless labels industry. Technological advancements, such as improved adhesive formulations and digital printing capabilities, enhance label performance and application versatility. The increasing consumer preference for sustainable packaging solutions is a major driver, with linerless labels offering reduced material consumption and waste. Favorable government regulations and incentives promoting sustainable practices further support market expansion. Economic factors such as increasing disposable income in developing countries contribute to higher packaging consumption.
Obstacles in the Linerless Labels Industry Market
The linerless labels industry faces certain challenges. Regulatory hurdles and varying standards across different regions can create complexities for manufacturers. Supply chain disruptions, particularly related to raw materials, can impact production and pricing. Intense competition from traditional pressure-sensitive labels and other substitute products exerts pricing pressure. Furthermore, the high initial investment required for advanced printing equipment might hinder entry for smaller players.
Future Opportunities in Linerless Labels Industry
Future opportunities lie in expanding into new and emerging markets, particularly in developing economies with growing consumer demand. Advancements in material science and printing technologies present avenues for creating more sustainable and high-performance labels. The growing trend toward personalized and customized packaging offers significant opportunities for linerless label manufacturers. Exploring innovative applications, such as smart labels with embedded sensors and RFID technology, could unlock further market expansion.
Major Players in the Linerless Labels Industry Ecosystem
- R R Donnelley & Sons Company
- Hub Labels Inc
- ProPrint Group
- Coveris
- Lexit Group AS
- Gipako UAB
- Optimum Group
- Skanem AS
- NAStar Inc
- Reflex Labels Ltd
- Innovia Films (CCL Industries)
- SATO Europe GmbH
Key Developments in Linerless Labels Industry Industry
- February 2022: ProPrint Group invested almost EUR 1 Million in its linerless labels segment, installing a new Ravenwood Com500 Coater and a 10-colour Edale FL3 flexo press, significantly boosting its capacity and positioning it as a leading linerless label provider.
- February 2022: Lexit Group partnered with Markem-Imaje (MI) to distribute their products and solutions in Norway, Sweden, and Denmark, expanding its market reach and product portfolio.
Strategic Linerless Labels Industry Market Forecast
The Linerless Labels market is projected to experience substantial growth over the forecast period, driven by sustained demand for sustainable packaging, technological innovations, and expanding applications across diverse end-user industries. Emerging markets and the adoption of innovative printing technologies will further contribute to market expansion. The overall market potential is significant, presenting attractive opportunities for both established players and new entrants.
Linerless Labels Industry Segmentation
-
1. Printing Technology
- 1.1. Gravure
- 1.2. Flexography
- 1.3. Digital
- 1.4. Other Processes of Printing
-
2. End-user Industry
- 2.1. Food
- 2.2. Beverage
- 2.3. Healthcare
- 2.4. Cosmetics
- 2.5. Household
- 2.6. Industrial
- 2.7. Logistics
- 2.8. Other End-user Industries
Linerless Labels Industry Segmentation By Geography
- 1. North America
- 2. Europe
- 3. Asia Pacific
- 4. Latin America
- 5. Middle East and Africa
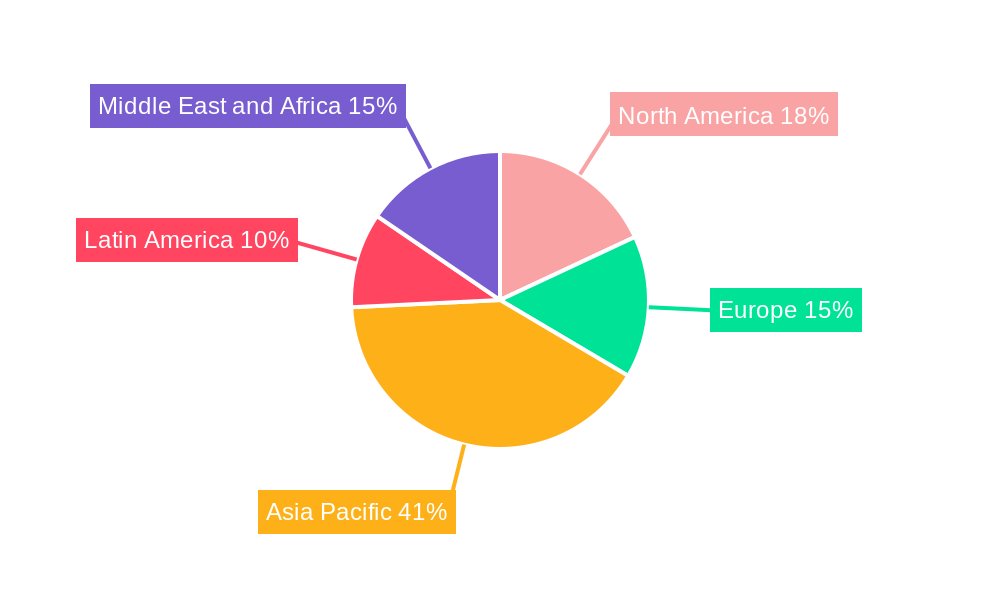
Linerless Labels Industry Regional Market Share
Geographic Coverage of Linerless Labels Industry
Linerless Labels Industry REPORT HIGHLIGHTS
| Aspects | Details |
|---|---|
| Study Period | 2020-2034 |
| Base Year | 2025 |
| Estimated Year | 2026 |
| Forecast Period | 2026-2034 |
| Historical Period | 2020-2025 |
| Growth Rate | CAGR of 5.28% from 2020-2034 |
| Segmentation |
|
Table of Contents
- 1. Introduction
- 1.1. Research Scope
- 1.2. Market Segmentation
- 1.3. Research Objective
- 1.4. Definitions and Assumptions
- 2. Executive Summary
- 2.1. Market Snapshot
- 3. Market Dynamics
- 3.1. Market Drivers
- 3.2. Market Restrains
- 3.3. Market Trends
- 3.4. Market Opportunities
- 4. Market Factor Analysis
- 4.1. Porters Five Forces
- 4.1.1. Bargaining Power of Suppliers
- 4.1.2. Bargaining Power of Buyers
- 4.1.3. Threat of New Entrants
- 4.1.4. Threat of Substitutes
- 4.1.5. Competitive Rivalry
- 4.2. PESTEL analysis
- 4.3. BCG Analysis
- 4.3.1. Stars (High Growth, High Market Share)
- 4.3.2. Cash Cows (Low Growth, High Market Share)
- 4.3.3. Question Mark (High Growth, Low Market Share)
- 4.3.4. Dogs (Low Growth, Low Market Share)
- 4.4. Ansoff Matrix Analysis
- 4.5. Supply Chain Analysis
- 4.6. Regulatory Landscape
- 4.7. Current Market Potential and Opportunity Assessment (TAM–SAM–SOM Framework)
- 4.8. DMV Analyst Note
- 4.1. Porters Five Forces
- 5. Market Analysis, Insights and Forecast 2021-2033
- 5.1. Market Analysis, Insights and Forecast - by Printing Technology
- 5.1.1. Gravure
- 5.1.2. Flexography
- 5.1.3. Digital
- 5.1.4. Other Processes of Printing
- 5.2. Market Analysis, Insights and Forecast - by End-user Industry
- 5.2.1. Food
- 5.2.2. Beverage
- 5.2.3. Healthcare
- 5.2.4. Cosmetics
- 5.2.5. Household
- 5.2.6. Industrial
- 5.2.7. Logistics
- 5.2.8. Other End-user Industries
- 5.3. Market Analysis, Insights and Forecast - by Region
- 5.3.1. North America
- 5.3.2. Europe
- 5.3.3. Asia Pacific
- 5.3.4. Latin America
- 5.3.5. Middle East and Africa
- 5.1. Market Analysis, Insights and Forecast - by Printing Technology
- 6. Global Linerless Labels Industry Analysis, Insights and Forecast, 2021-2033
- 6.1. Market Analysis, Insights and Forecast - by Printing Technology
- 6.1.1. Gravure
- 6.1.2. Flexography
- 6.1.3. Digital
- 6.1.4. Other Processes of Printing
- 6.2. Market Analysis, Insights and Forecast - by End-user Industry
- 6.2.1. Food
- 6.2.2. Beverage
- 6.2.3. Healthcare
- 6.2.4. Cosmetics
- 6.2.5. Household
- 6.2.6. Industrial
- 6.2.7. Logistics
- 6.2.8. Other End-user Industries
- 6.1. Market Analysis, Insights and Forecast - by Printing Technology
- 7. North America Linerless Labels Industry Analysis, Insights and Forecast, 2020-2032
- 7.1. Market Analysis, Insights and Forecast - by Printing Technology
- 7.1.1. Gravure
- 7.1.2. Flexography
- 7.1.3. Digital
- 7.1.4. Other Processes of Printing
- 7.2. Market Analysis, Insights and Forecast - by End-user Industry
- 7.2.1. Food
- 7.2.2. Beverage
- 7.2.3. Healthcare
- 7.2.4. Cosmetics
- 7.2.5. Household
- 7.2.6. Industrial
- 7.2.7. Logistics
- 7.2.8. Other End-user Industries
- 7.1. Market Analysis, Insights and Forecast - by Printing Technology
- 8. Europe Linerless Labels Industry Analysis, Insights and Forecast, 2020-2032
- 8.1. Market Analysis, Insights and Forecast - by Printing Technology
- 8.1.1. Gravure
- 8.1.2. Flexography
- 8.1.3. Digital
- 8.1.4. Other Processes of Printing
- 8.2. Market Analysis, Insights and Forecast - by End-user Industry
- 8.2.1. Food
- 8.2.2. Beverage
- 8.2.3. Healthcare
- 8.2.4. Cosmetics
- 8.2.5. Household
- 8.2.6. Industrial
- 8.2.7. Logistics
- 8.2.8. Other End-user Industries
- 8.1. Market Analysis, Insights and Forecast - by Printing Technology
- 9. Asia Pacific Linerless Labels Industry Analysis, Insights and Forecast, 2020-2032
- 9.1. Market Analysis, Insights and Forecast - by Printing Technology
- 9.1.1. Gravure
- 9.1.2. Flexography
- 9.1.3. Digital
- 9.1.4. Other Processes of Printing
- 9.2. Market Analysis, Insights and Forecast - by End-user Industry
- 9.2.1. Food
- 9.2.2. Beverage
- 9.2.3. Healthcare
- 9.2.4. Cosmetics
- 9.2.5. Household
- 9.2.6. Industrial
- 9.2.7. Logistics
- 9.2.8. Other End-user Industries
- 9.1. Market Analysis, Insights and Forecast - by Printing Technology
- 10. Latin America Linerless Labels Industry Analysis, Insights and Forecast, 2020-2032
- 10.1. Market Analysis, Insights and Forecast - by Printing Technology
- 10.1.1. Gravure
- 10.1.2. Flexography
- 10.1.3. Digital
- 10.1.4. Other Processes of Printing
- 10.2. Market Analysis, Insights and Forecast - by End-user Industry
- 10.2.1. Food
- 10.2.2. Beverage
- 10.2.3. Healthcare
- 10.2.4. Cosmetics
- 10.2.5. Household
- 10.2.6. Industrial
- 10.2.7. Logistics
- 10.2.8. Other End-user Industries
- 10.1. Market Analysis, Insights and Forecast - by Printing Technology
- 11. Middle East and Africa Linerless Labels Industry Analysis, Insights and Forecast, 2020-2032
- 11.1. Market Analysis, Insights and Forecast - by Printing Technology
- 11.1.1. Gravure
- 11.1.2. Flexography
- 11.1.3. Digital
- 11.1.4. Other Processes of Printing
- 11.2. Market Analysis, Insights and Forecast - by End-user Industry
- 11.2.1. Food
- 11.2.2. Beverage
- 11.2.3. Healthcare
- 11.2.4. Cosmetics
- 11.2.5. Household
- 11.2.6. Industrial
- 11.2.7. Logistics
- 11.2.8. Other End-user Industries
- 11.1. Market Analysis, Insights and Forecast - by Printing Technology
- 12. Competitive Analysis
- 12.1. Company Profiles
- 12.1.1 R R Donnelley & Sons Company
- 12.1.1.1. Company Overview
- 12.1.1.2. Products
- 12.1.1.3. Company Financials
- 12.1.1.4. SWOT Analysis
- 12.1.2 Hub Labels Inc
- 12.1.2.1. Company Overview
- 12.1.2.2. Products
- 12.1.2.3. Company Financials
- 12.1.2.4. SWOT Analysis
- 12.1.3 ProPrint Group
- 12.1.3.1. Company Overview
- 12.1.3.2. Products
- 12.1.3.3. Company Financials
- 12.1.3.4. SWOT Analysis
- 12.1.4 Coveris
- 12.1.4.1. Company Overview
- 12.1.4.2. Products
- 12.1.4.3. Company Financials
- 12.1.4.4. SWOT Analysis
- 12.1.5 Lexit Group AS
- 12.1.5.1. Company Overview
- 12.1.5.2. Products
- 12.1.5.3. Company Financials
- 12.1.5.4. SWOT Analysis
- 12.1.6 Gipako UAB*List Not Exhaustive
- 12.1.6.1. Company Overview
- 12.1.6.2. Products
- 12.1.6.3. Company Financials
- 12.1.6.4. SWOT Analysis
- 12.1.7 Optimum Group
- 12.1.7.1. Company Overview
- 12.1.7.2. Products
- 12.1.7.3. Company Financials
- 12.1.7.4. SWOT Analysis
- 12.1.8 Skanem AS
- 12.1.8.1. Company Overview
- 12.1.8.2. Products
- 12.1.8.3. Company Financials
- 12.1.8.4. SWOT Analysis
- 12.1.9 NAStar Inc
- 12.1.9.1. Company Overview
- 12.1.9.2. Products
- 12.1.9.3. Company Financials
- 12.1.9.4. SWOT Analysis
- 12.1.10 Reflex Labels Ltd
- 12.1.10.1. Company Overview
- 12.1.10.2. Products
- 12.1.10.3. Company Financials
- 12.1.10.4. SWOT Analysis
- 12.1.11 Innovia Films (CCL Industries)
- 12.1.11.1. Company Overview
- 12.1.11.2. Products
- 12.1.11.3. Company Financials
- 12.1.11.4. SWOT Analysis
- 12.1.12 SATO Europe GmbH
- 12.1.12.1. Company Overview
- 12.1.12.2. Products
- 12.1.12.3. Company Financials
- 12.1.12.4. SWOT Analysis
- 12.1.1 R R Donnelley & Sons Company
- 12.2. Market Entropy
- 12.2.1 Company's Key Areas Served
- 12.2.2 Recent Developments
- 12.3. Company Market Share Analysis 2025
- 12.3.1 Top 5 Companies Market Share Analysis
- 12.3.2 Top 3 Companies Market Share Analysis
- 12.4. List of Potential Customers
- 13. Research Methodology
List of Figures
- Figure 1: Global Linerless Labels Industry Revenue Breakdown (Million, %) by Region 2025 & 2033
- Figure 2: North America Linerless Labels Industry Revenue (Million), by Printing Technology 2025 & 2033
- Figure 3: North America Linerless Labels Industry Revenue Share (%), by Printing Technology 2025 & 2033
- Figure 4: North America Linerless Labels Industry Revenue (Million), by End-user Industry 2025 & 2033
- Figure 5: North America Linerless Labels Industry Revenue Share (%), by End-user Industry 2025 & 2033
- Figure 6: North America Linerless Labels Industry Revenue (Million), by Country 2025 & 2033
- Figure 7: North America Linerless Labels Industry Revenue Share (%), by Country 2025 & 2033
- Figure 8: Europe Linerless Labels Industry Revenue (Million), by Printing Technology 2025 & 2033
- Figure 9: Europe Linerless Labels Industry Revenue Share (%), by Printing Technology 2025 & 2033
- Figure 10: Europe Linerless Labels Industry Revenue (Million), by End-user Industry 2025 & 2033
- Figure 11: Europe Linerless Labels Industry Revenue Share (%), by End-user Industry 2025 & 2033
- Figure 12: Europe Linerless Labels Industry Revenue (Million), by Country 2025 & 2033
- Figure 13: Europe Linerless Labels Industry Revenue Share (%), by Country 2025 & 2033
- Figure 14: Asia Pacific Linerless Labels Industry Revenue (Million), by Printing Technology 2025 & 2033
- Figure 15: Asia Pacific Linerless Labels Industry Revenue Share (%), by Printing Technology 2025 & 2033
- Figure 16: Asia Pacific Linerless Labels Industry Revenue (Million), by End-user Industry 2025 & 2033
- Figure 17: Asia Pacific Linerless Labels Industry Revenue Share (%), by End-user Industry 2025 & 2033
- Figure 18: Asia Pacific Linerless Labels Industry Revenue (Million), by Country 2025 & 2033
- Figure 19: Asia Pacific Linerless Labels Industry Revenue Share (%), by Country 2025 & 2033
- Figure 20: Latin America Linerless Labels Industry Revenue (Million), by Printing Technology 2025 & 2033
- Figure 21: Latin America Linerless Labels Industry Revenue Share (%), by Printing Technology 2025 & 2033
- Figure 22: Latin America Linerless Labels Industry Revenue (Million), by End-user Industry 2025 & 2033
- Figure 23: Latin America Linerless Labels Industry Revenue Share (%), by End-user Industry 2025 & 2033
- Figure 24: Latin America Linerless Labels Industry Revenue (Million), by Country 2025 & 2033
- Figure 25: Latin America Linerless Labels Industry Revenue Share (%), by Country 2025 & 2033
- Figure 26: Middle East and Africa Linerless Labels Industry Revenue (Million), by Printing Technology 2025 & 2033
- Figure 27: Middle East and Africa Linerless Labels Industry Revenue Share (%), by Printing Technology 2025 & 2033
- Figure 28: Middle East and Africa Linerless Labels Industry Revenue (Million), by End-user Industry 2025 & 2033
- Figure 29: Middle East and Africa Linerless Labels Industry Revenue Share (%), by End-user Industry 2025 & 2033
- Figure 30: Middle East and Africa Linerless Labels Industry Revenue (Million), by Country 2025 & 2033
- Figure 31: Middle East and Africa Linerless Labels Industry Revenue Share (%), by Country 2025 & 2033
List of Tables
- Table 1: Global Linerless Labels Industry Revenue Million Forecast, by Printing Technology 2020 & 2033
- Table 2: Global Linerless Labels Industry Revenue Million Forecast, by End-user Industry 2020 & 2033
- Table 3: Global Linerless Labels Industry Revenue Million Forecast, by Region 2020 & 2033
- Table 4: Global Linerless Labels Industry Revenue Million Forecast, by Printing Technology 2020 & 2033
- Table 5: Global Linerless Labels Industry Revenue Million Forecast, by End-user Industry 2020 & 2033
- Table 6: Global Linerless Labels Industry Revenue Million Forecast, by Country 2020 & 2033
- Table 7: Global Linerless Labels Industry Revenue Million Forecast, by Printing Technology 2020 & 2033
- Table 8: Global Linerless Labels Industry Revenue Million Forecast, by End-user Industry 2020 & 2033
- Table 9: Global Linerless Labels Industry Revenue Million Forecast, by Country 2020 & 2033
- Table 10: Global Linerless Labels Industry Revenue Million Forecast, by Printing Technology 2020 & 2033
- Table 11: Global Linerless Labels Industry Revenue Million Forecast, by End-user Industry 2020 & 2033
- Table 12: Global Linerless Labels Industry Revenue Million Forecast, by Country 2020 & 2033
- Table 13: Global Linerless Labels Industry Revenue Million Forecast, by Printing Technology 2020 & 2033
- Table 14: Global Linerless Labels Industry Revenue Million Forecast, by End-user Industry 2020 & 2033
- Table 15: Global Linerless Labels Industry Revenue Million Forecast, by Country 2020 & 2033
- Table 16: Global Linerless Labels Industry Revenue Million Forecast, by Printing Technology 2020 & 2033
- Table 17: Global Linerless Labels Industry Revenue Million Forecast, by End-user Industry 2020 & 2033
- Table 18: Global Linerless Labels Industry Revenue Million Forecast, by Country 2020 & 2033
Frequently Asked Questions
1. What is the projected Compound Annual Growth Rate (CAGR) of the Linerless Labels Industry?
The projected CAGR is approximately 5.28%.
2. Which companies are prominent players in the Linerless Labels Industry?
Key companies in the market include R R Donnelley & Sons Company, Hub Labels Inc, ProPrint Group, Coveris, Lexit Group AS, Gipako UAB*List Not Exhaustive, Optimum Group, Skanem AS, NAStar Inc, Reflex Labels Ltd, Innovia Films (CCL Industries), SATO Europe GmbH.
3. What are the main segments of the Linerless Labels Industry?
The market segments include Printing Technology, End-user Industry.
4. Can you provide details about the market size?
The market size is estimated to be USD 1.94 Million as of 2022.
5. What are some drivers contributing to market growth?
Increasing Demand for Packaged Foods and Beverages; Increasing Demand for Pharmaceutical Supplies.
6. What are the notable trends driving market growth?
Food and Beverage Expected to Hold the Largest Market Share.
7. Are there any restraints impacting market growth?
Fluctuation in the Prices of Raw Materials.
8. Can you provide examples of recent developments in the market?
Feb 2022 - ProPrintGroup installed a new Ravenwood Com500 Coater. There will also be a new advanced 10-colour EdaleFL3 flexo press. As a result, ProPrint'sLinerless Labels segment now has a total investment of almost EUR 1 million. ProPrintwill becomes a first-class Linerless Labels provider as a result of the transfer, which will greatly increase Linerless Labeling capacity.
9. What pricing options are available for accessing the report?
Pricing options include single-user, multi-user, and enterprise licenses priced at USD 4750, USD 5250, and USD 8750 respectively.
10. Is the market size provided in terms of value or volume?
The market size is provided in terms of value, measured in Million.
11. Are there any specific market keywords associated with the report?
Yes, the market keyword associated with the report is "Linerless Labels Industry," which aids in identifying and referencing the specific market segment covered.
12. How do I determine which pricing option suits my needs best?
The pricing options vary based on user requirements and access needs. Individual users may opt for single-user licenses, while businesses requiring broader access may choose multi-user or enterprise licenses for cost-effective access to the report.
13. Are there any additional resources or data provided in the Linerless Labels Industry report?
While the report offers comprehensive insights, it's advisable to review the specific contents or supplementary materials provided to ascertain if additional resources or data are available.
14. How can I stay updated on further developments or reports in the Linerless Labels Industry?
To stay informed about further developments, trends, and reports in the Linerless Labels Industry, consider subscribing to industry newsletters, following relevant companies and organizations, or regularly checking reputable industry news sources and publications.
Methodology
Step 1 - Identification of Relevant Samples Size from Population Database


Step 2 - Approaches for Defining Global Market Size (Value, Volume* & Price*)

Note*: In applicable scenarios
Step 3 - Data Sources
Primary Research
- Web Analytics
- Survey Reports
- Research Institute
- Latest Research Reports
- Opinion Leaders
Secondary Research
- Annual Reports
- White Paper
- Latest Press Release
- Industry Association
- Paid Database
- Investor Presentations

Step 4 - Data Triangulation
Involves using different sources of information in order to increase the validity of a study
These sources are likely to be stakeholders in a program - participants, other researchers, program staff, other community members, and so on.
Then we put all data in single framework & apply various statistical tools to find out the dynamic on the market.
During the analysis stage, feedback from the stakeholder groups would be compared to determine areas of agreement as well as areas of divergence