

Key Insights
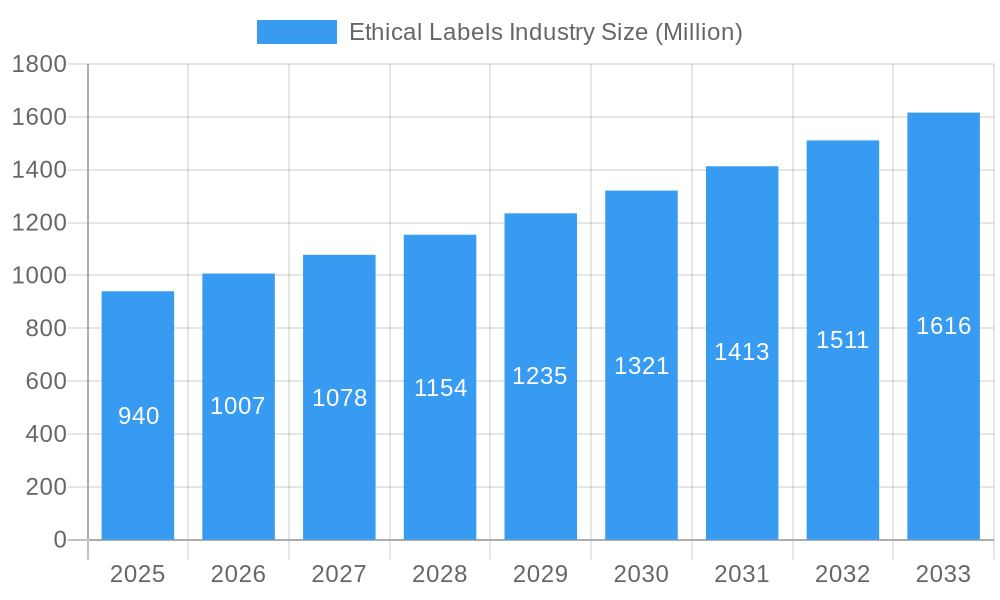
The ethical labels market, valued at $0.94 billion in 2025, is experiencing robust growth, projected to expand at a compound annual growth rate (CAGR) of 7.10% from 2025 to 2033. This expansion is fueled by rising consumer awareness of ethical sourcing and production practices, increasing demand for transparency in supply chains, and a growing preference for sustainable and responsibly produced goods. Key drivers include heightened consumer concern for animal welfare, environmental sustainability, and fair labor practices. The market is segmented by label type (Halal, organic, clean, sustainability & fairtrade, animal welfare, vegan, and others), product type (food and beverages), and distribution channel (offline and online). The food segment currently dominates, driven by increasing demand for ethically sourced ingredients and products, reflecting a shift towards mindful consumption habits. Online distribution channels are witnessing faster growth compared to offline channels, reflecting the increasing penetration of e-commerce and the convenience it offers consumers seeking ethical products. Major players like PepsiCo, Ingredion, DSM, Kraft Heinz, Kerry Group, Cargill, and others are actively shaping the market through product innovation and strategic partnerships, further accelerating market expansion.
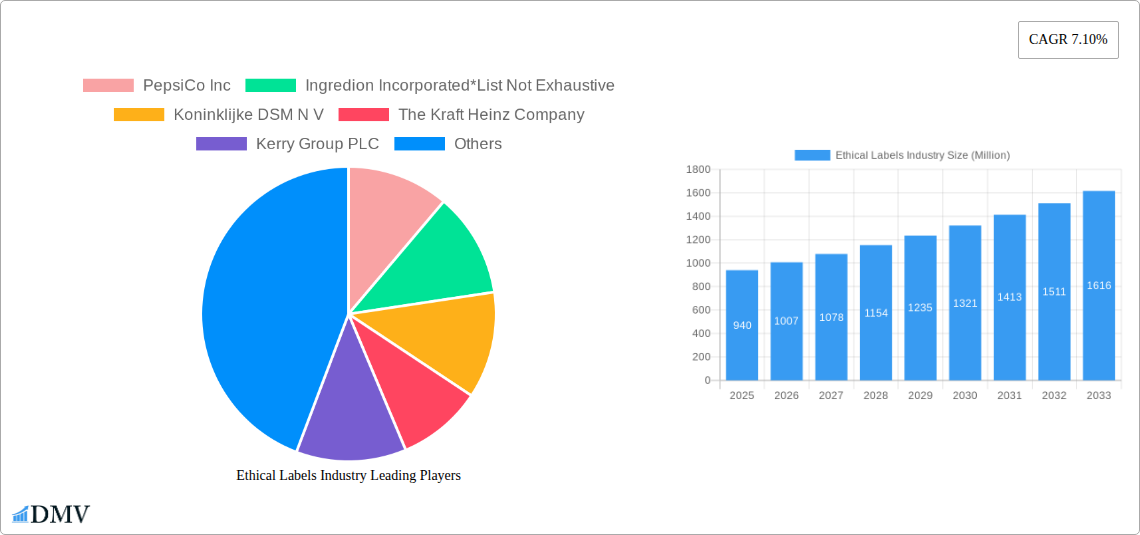
Ethical Labels Industry Market Size (In Million)
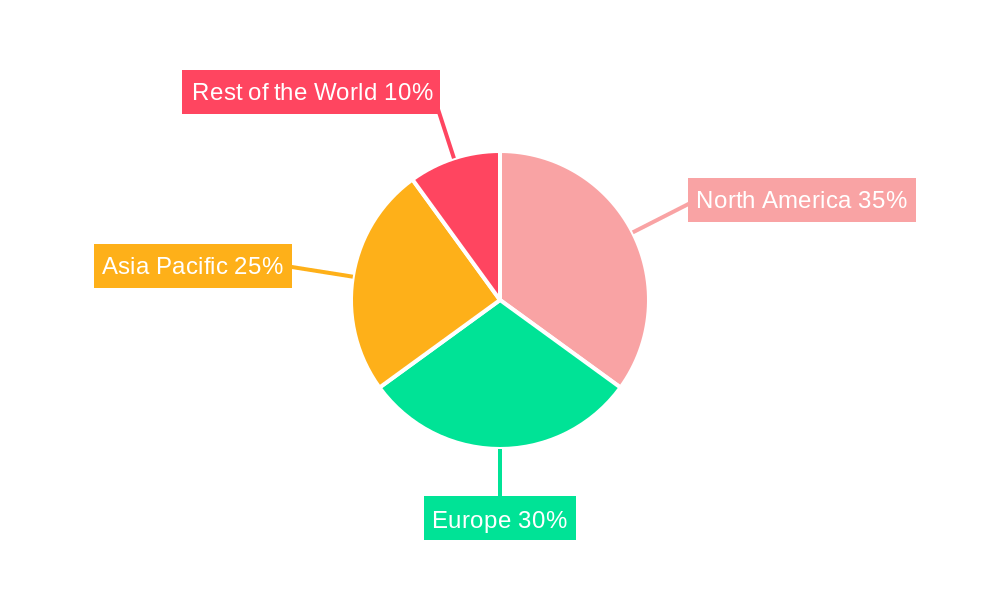
The market's growth trajectory is expected to be influenced by several factors. Government regulations promoting ethical sourcing and labeling will likely boost market growth. Conversely, challenges such as the high cost of ethical certification and potential for "greenwashing" (misleading environmental claims) could act as restraints. Regional variations in consumer preferences and regulatory frameworks will also influence market performance. North America and Europe are expected to maintain significant market share, owing to established consumer awareness and stringent regulations. However, the Asia-Pacific region is anticipated to witness substantial growth driven by rising disposable incomes and increasing awareness of ethical consumption. The continued focus on product innovation and the development of new and credible ethical labels will be critical to maintaining the market's growth momentum and building consumer trust.
Ethical Labels Industry Company Market Share
Ethical Labels Industry Market Report: 2019-2033
This comprehensive report provides an in-depth analysis of the Ethical Labels Industry, projecting a market value exceeding $XX Million by 2033. The study covers the historical period (2019-2024), base year (2025), and forecast period (2025-2033), offering valuable insights for stakeholders across the value chain. From market segmentation by label type (Halal, Organic, Clean, Sustainability & Fairtrade, Animal Welfare, Vegan, and Others) and product type (Food, Beverages) to distribution channels (Offline, Online), this report paints a complete picture of this rapidly evolving industry. Key players like PepsiCo Inc, Ingredion Incorporated, Koninklijke DSM N V, The Kraft Heinz Company, Kerry Group PLC, Cargill Inc, Go Macro LLC, Archer-Daniels-Midland Company, Garden of Life (Nestlé S A), and The Hershey Company are analyzed, highlighting their strategic moves and market impact.
Ethical Labels Industry Market Composition & Trends
The Ethical Labels Industry is characterized by a moderately concentrated market, with a few large players holding significant shares, though a large number of smaller niche players also exist. The market share distribution shows a leading few holding approximately xx% collectively, while the remaining share is fragmented among numerous smaller companies. Innovation is driven by increasing consumer demand for ethical and sustainable products, coupled with evolving regulatory landscapes. Substitute products pose a challenge, primarily through 'greenwashing' and misleading claims which can erode consumer trust in the sector. The industry has seen notable M&A activity, with deal values exceeding $XX Million in recent years.
- Market Concentration: Moderately concentrated, with top players holding xx% market share.
- Innovation Catalysts: Growing consumer awareness, stringent regulations, and technological advancements in labeling and traceability.
- Regulatory Landscape: Varying regulations across regions, impacting both market access and product compliance. Ongoing efforts to standardize and harmonize ethical labeling standards.
- Substitute Products: Products with misleading or unsubstantiated ethical claims pose a significant threat.
- End-User Profiles: Conscious consumers, large food and beverage manufacturers, and retailers focusing on sustainability initiatives.
- M&A Activities: Several significant mergers and acquisitions have occurred, valued at over $XX Million in the last 5 years, demonstrating the desire for consolidation and expansion within the market.
Ethical Labels Industry Industry Evolution
The Ethical Labels Industry has experienced substantial growth over the past few years, fueled by rising consumer demand for ethically sourced and sustainably produced goods. The historical period (2019-2024) saw a compound annual growth rate (CAGR) of xx%, indicating strong market momentum. Technological advancements, such as blockchain technology for improved traceability and AI-powered verification systems, are playing a crucial role in enhancing transparency and trust. Shifting consumer preferences, driven by growing environmental and social awareness, are further accelerating market growth. The projected CAGR for the forecast period (2025-2033) is xx%, indicating continued strong growth. Adoption of ethical labels across various product categories is increasing, with notable growth in the organic and vegan segments. This growth trajectory is expected to continue, driven by both increased consumer demand and the implementation of new regulations and technologies. The industry is evolving towards greater transparency, accountability, and standardization in ethical labeling practices.
Leading Regions, Countries, or Segments in Ethical Labels Industry
The Organic and Vegan label segments, driven by increasing health consciousness and the demand for cruelty-free products, hold a significant market share. Europe and North America currently lead in adoption of various ethical labels, due to strong regulatory frameworks and high consumer awareness. The online distribution channel shows higher growth rates compared to offline channels, with increased e-commerce sales and direct-to-consumer models.
- Key Drivers (Europe & North America): Stringent regulations, high consumer awareness of ethical and sustainable practices, strong investments in innovative solutions, increased government incentives.
- Dominance Factors: High consumer demand, established supply chains, proactive regulatory environments, robust market infrastructure.
- Organic & Vegan Segment: Strong growth driven by increased consumer awareness of health and environmental implications.
- Online Distribution Channel: High growth rate compared to offline due to convenience and wide reach.
Ethical Labels Industry Product Innovations
Recent innovations in the Ethical Labels Industry are revolutionizing how products are presented to consumers. A primary focus is on **enhancing product traceability**, utilizing advanced technologies like blockchain to create immutable records of a product's journey from origin to shelf. This surge in transparency directly combats concerns about greenwashing by providing verifiable proof of ethical claims. Alongside this, significant strides are being made in **improving label verification methods, employing AI-powered scanning and secure digital platforms to ensure authenticity and compliance. Furthermore, there's a concerted effort to **simplify complex ethical information for consumers, translating intricate data into easily understandable metrics and symbols. This evolution includes the development of dynamic labels that can update in real-time with crucial information. The integration of standardized certification processes, validated by independent bodies, is also gaining traction, aiming to build greater consumer trust and differentiate genuinely ethical products in a crowded market. Emerging label types are now designed to communicate specific, quantifiable environmental or social impact metrics, empowering consumers to make informed decisions based on concrete data.
Propelling Factors for Ethical Labels Industry Growth
The Ethical Labels Industry is propelled by several key factors. Firstly, increasing consumer awareness of social and environmental issues is driving a strong demand for ethically sourced products. Secondly, stringent government regulations and incentives promoting sustainable practices are fostering innovation and market expansion. Finally, technological advancements, such as blockchain, are enhancing transparency and traceability, further boosting consumer trust.
Obstacles in the Ethical Labels Industry Market
The Ethical Labels Industry, while promising, navigates several significant obstacles. A key challenge is the **inconsistency of labeling standards across different regions and product categories, which complicates the aspiration for global standardization and creates a complex compliance landscape for multinational corporations. The inherent complexity of modern supply chains makes them susceptible to disruptions, which can compromise the integrity of ethical sourcing claims and create opportunities for fraudulent labeling. The persistent threat of greenwashing continues to erode consumer confidence, as misleading claims can overshadow genuine ethical efforts. Moreover, the high cost of certification and rigorous verification processes acts as a substantial barrier, particularly for smaller businesses and startups, limiting their ability to compete with larger entities that can absorb these expenses. Bridging the gap between rigorous ethical verification and consumer accessibility remains an ongoing challenge.
Future Opportunities in Ethical Labels Industry
The future of the Ethical Labels Industry is brimming with exciting opportunities, largely driven by evolving consumer consciousness and technological advancements. The burgeoning demand in emerging markets, where consumers are increasingly aware of and concerned about ethical sourcing and sustainability, presents a significant growth avenue. Technological breakthroughs, particularly in Artificial Intelligence (AI) and blockchain, are poised to redefine the industry. AI can enhance data analysis for verification and personalize ethical information for consumers, while blockchain offers unparalleled transparency and security in supply chain tracking. The development of novel label types addressing specific consumer needs and emerging trends, such as dedicated labels for the circular economy, regenerative agriculture practices, or fair labor conditions, will create new market niches and drive innovation. Collaborations between industry stakeholders, NGOs, and technology providers will foster a more robust and trustworthy ethical labeling ecosystem.
Major Players in the Ethical Labels Industry Ecosystem
- PepsiCo Inc
- Ingredion Incorporated
- Koninklijke DSM N V
- The Kraft Heinz Company
- Kerry Group PLC
- Cargill Inc
- Go Macro LLC
- Archer-Daniels-Midland Company
- Garden of Life (Nestlé S A)
- The Hershey Company
Key Developments in Ethical Labels Industry Industry
- June 2023: Kerry Group PLC introduced Biobake EgR, an enzyme solution reducing egg usage in baking, enabling cost-effective transitions to free-range or organic eggs and meeting growing consumer demand for ethical labels in egg-based products.
- September 2023: Maranello launched its "Maranello on Earth" ethical label, requiring products to meet one of four criteria: sustainability, low carbon footprint, social contribution, or use of local resources and know-how.
Strategic Ethical Labels Industry Market Forecast
The Ethical Labels Industry is on a trajectory of significant and sustained growth, fueled by a confluence of powerful drivers. Sustained consumer demand for ethically sourced, environmentally friendly, and socially responsible products remains the primary engine of this expansion. This demand is further amplified by robust technological advancements that are continuously enhancing product traceability, supply chain transparency, and the verification of ethical claims. Governments and regulatory bodies worldwide are increasingly implementing supportive policies and frameworks, creating a more favorable environment for ethical labeling practices to thrive. The market's expansion is not merely incremental; it is expected to be substantial, presenting considerable opportunities for both established industry leaders and innovative new entrants. As global awareness of critical environmental and social issues continues to deepen, the imperative for transparent and verifiable ethical labeling will only accelerate market growth in the coming years, making it a dynamic and increasingly vital sector.
Ethical Labels Industry Segmentation
-
1. Label Type
- 1.1. Halal
- 1.2. Organic
- 1.3. Clean
- 1.4. Sustainability and Fairtrade labels
- 1.5. Animal Welfare Labels
- 1.6. Vegan Labels
- 1.7. Other Label Types
-
2. Product Type
- 2.1. Food
- 2.2. Beverages
-
3. Distribution Channel
- 3.1. Offline
- 3.2. Online
Ethical Labels Industry Segmentation By Geography
- 1. North America
- 2. Europe
- 3. Asia
- 4. Australia and New Zealand
- 5. Latin America
- 6. Middle East and Africa
Ethical Labels Industry Regional Market Share
Geographic Coverage of Ethical Labels Industry
Ethical Labels Industry REPORT HIGHLIGHTS
| Aspects | Details |
|---|---|
| Study Period | 2020-2034 |
| Base Year | 2025 |
| Estimated Year | 2026 |
| Forecast Period | 2026-2034 |
| Historical Period | 2020-2025 |
| Growth Rate | CAGR of 7.10% from 2020-2034 |
| Segmentation |
|
Table of Contents
- 1. Introduction
- 1.1. Research Scope
- 1.2. Market Segmentation
- 1.3. Research Objective
- 1.4. Definitions and Assumptions
- 2. Executive Summary
- 2.1. Market Snapshot
- 3. Market Dynamics
- 3.1. Market Drivers
- 3.2. Market Restrains
- 3.3. Market Trends
- 3.4. Market Opportunities
- 4. Market Factor Analysis
- 4.1. Porters Five Forces
- 4.1.1. Bargaining Power of Suppliers
- 4.1.2. Bargaining Power of Buyers
- 4.1.3. Threat of New Entrants
- 4.1.4. Threat of Substitutes
- 4.1.5. Competitive Rivalry
- 4.2. PESTEL analysis
- 4.3. BCG Analysis
- 4.3.1. Stars (High Growth, High Market Share)
- 4.3.2. Cash Cows (Low Growth, High Market Share)
- 4.3.3. Question Mark (High Growth, Low Market Share)
- 4.3.4. Dogs (Low Growth, Low Market Share)
- 4.4. Ansoff Matrix Analysis
- 4.5. Supply Chain Analysis
- 4.6. Regulatory Landscape
- 4.7. Current Market Potential and Opportunity Assessment (TAM–SAM–SOM Framework)
- 4.8. DMV Analyst Note
- 4.1. Porters Five Forces
- 5. Market Analysis, Insights and Forecast 2021-2033
- 5.1. Market Analysis, Insights and Forecast - by Label Type
- 5.1.1. Halal
- 5.1.2. Organic
- 5.1.3. Clean
- 5.1.4. Sustainability and Fairtrade labels
- 5.1.5. Animal Welfare Labels
- 5.1.6. Vegan Labels
- 5.1.7. Other Label Types
- 5.2. Market Analysis, Insights and Forecast - by Product Type
- 5.2.1. Food
- 5.2.2. Beverages
- 5.3. Market Analysis, Insights and Forecast - by Distribution Channel
- 5.3.1. Offline
- 5.3.2. Online
- 5.4. Market Analysis, Insights and Forecast - by Region
- 5.4.1. North America
- 5.4.2. Europe
- 5.4.3. Asia
- 5.4.4. Australia and New Zealand
- 5.4.5. Latin America
- 5.4.6. Middle East and Africa
- 5.1. Market Analysis, Insights and Forecast - by Label Type
- 6. Global Ethical Labels Industry Analysis, Insights and Forecast, 2021-2033
- 6.1. Market Analysis, Insights and Forecast - by Label Type
- 6.1.1. Halal
- 6.1.2. Organic
- 6.1.3. Clean
- 6.1.4. Sustainability and Fairtrade labels
- 6.1.5. Animal Welfare Labels
- 6.1.6. Vegan Labels
- 6.1.7. Other Label Types
- 6.2. Market Analysis, Insights and Forecast - by Product Type
- 6.2.1. Food
- 6.2.2. Beverages
- 6.3. Market Analysis, Insights and Forecast - by Distribution Channel
- 6.3.1. Offline
- 6.3.2. Online
- 6.1. Market Analysis, Insights and Forecast - by Label Type
- 7. North America Ethical Labels Industry Analysis, Insights and Forecast, 2020-2032
- 7.1. Market Analysis, Insights and Forecast - by Label Type
- 7.1.1. Halal
- 7.1.2. Organic
- 7.1.3. Clean
- 7.1.4. Sustainability and Fairtrade labels
- 7.1.5. Animal Welfare Labels
- 7.1.6. Vegan Labels
- 7.1.7. Other Label Types
- 7.2. Market Analysis, Insights and Forecast - by Product Type
- 7.2.1. Food
- 7.2.2. Beverages
- 7.3. Market Analysis, Insights and Forecast - by Distribution Channel
- 7.3.1. Offline
- 7.3.2. Online
- 7.1. Market Analysis, Insights and Forecast - by Label Type
- 8. Europe Ethical Labels Industry Analysis, Insights and Forecast, 2020-2032
- 8.1. Market Analysis, Insights and Forecast - by Label Type
- 8.1.1. Halal
- 8.1.2. Organic
- 8.1.3. Clean
- 8.1.4. Sustainability and Fairtrade labels
- 8.1.5. Animal Welfare Labels
- 8.1.6. Vegan Labels
- 8.1.7. Other Label Types
- 8.2. Market Analysis, Insights and Forecast - by Product Type
- 8.2.1. Food
- 8.2.2. Beverages
- 8.3. Market Analysis, Insights and Forecast - by Distribution Channel
- 8.3.1. Offline
- 8.3.2. Online
- 8.1. Market Analysis, Insights and Forecast - by Label Type
- 9. Asia Ethical Labels Industry Analysis, Insights and Forecast, 2020-2032
- 9.1. Market Analysis, Insights and Forecast - by Label Type
- 9.1.1. Halal
- 9.1.2. Organic
- 9.1.3. Clean
- 9.1.4. Sustainability and Fairtrade labels
- 9.1.5. Animal Welfare Labels
- 9.1.6. Vegan Labels
- 9.1.7. Other Label Types
- 9.2. Market Analysis, Insights and Forecast - by Product Type
- 9.2.1. Food
- 9.2.2. Beverages
- 9.3. Market Analysis, Insights and Forecast - by Distribution Channel
- 9.3.1. Offline
- 9.3.2. Online
- 9.1. Market Analysis, Insights and Forecast - by Label Type
- 10. Australia and New Zealand Ethical Labels Industry Analysis, Insights and Forecast, 2020-2032
- 10.1. Market Analysis, Insights and Forecast - by Label Type
- 10.1.1. Halal
- 10.1.2. Organic
- 10.1.3. Clean
- 10.1.4. Sustainability and Fairtrade labels
- 10.1.5. Animal Welfare Labels
- 10.1.6. Vegan Labels
- 10.1.7. Other Label Types
- 10.2. Market Analysis, Insights and Forecast - by Product Type
- 10.2.1. Food
- 10.2.2. Beverages
- 10.3. Market Analysis, Insights and Forecast - by Distribution Channel
- 10.3.1. Offline
- 10.3.2. Online
- 10.1. Market Analysis, Insights and Forecast - by Label Type
- 11. Latin America Ethical Labels Industry Analysis, Insights and Forecast, 2020-2032
- 11.1. Market Analysis, Insights and Forecast - by Label Type
- 11.1.1. Halal
- 11.1.2. Organic
- 11.1.3. Clean
- 11.1.4. Sustainability and Fairtrade labels
- 11.1.5. Animal Welfare Labels
- 11.1.6. Vegan Labels
- 11.1.7. Other Label Types
- 11.2. Market Analysis, Insights and Forecast - by Product Type
- 11.2.1. Food
- 11.2.2. Beverages
- 11.3. Market Analysis, Insights and Forecast - by Distribution Channel
- 11.3.1. Offline
- 11.3.2. Online
- 11.1. Market Analysis, Insights and Forecast - by Label Type
- 12. Middle East and Africa Ethical Labels Industry Analysis, Insights and Forecast, 2020-2032
- 12.1. Market Analysis, Insights and Forecast - by Label Type
- 12.1.1. Halal
- 12.1.2. Organic
- 12.1.3. Clean
- 12.1.4. Sustainability and Fairtrade labels
- 12.1.5. Animal Welfare Labels
- 12.1.6. Vegan Labels
- 12.1.7. Other Label Types
- 12.2. Market Analysis, Insights and Forecast - by Product Type
- 12.2.1. Food
- 12.2.2. Beverages
- 12.3. Market Analysis, Insights and Forecast - by Distribution Channel
- 12.3.1. Offline
- 12.3.2. Online
- 12.1. Market Analysis, Insights and Forecast - by Label Type
- 13. Competitive Analysis
- 13.1. Company Profiles
- 13.1.1 PepsiCo Inc
- 13.1.1.1. Company Overview
- 13.1.1.2. Products
- 13.1.1.3. Company Financials
- 13.1.1.4. SWOT Analysis
- 13.1.2 Ingredion Incorporated*List Not Exhaustive
- 13.1.2.1. Company Overview
- 13.1.2.2. Products
- 13.1.2.3. Company Financials
- 13.1.2.4. SWOT Analysis
- 13.1.3 Koninklijke DSM N V
- 13.1.3.1. Company Overview
- 13.1.3.2. Products
- 13.1.3.3. Company Financials
- 13.1.3.4. SWOT Analysis
- 13.1.4 The Kraft Heinz Company
- 13.1.4.1. Company Overview
- 13.1.4.2. Products
- 13.1.4.3. Company Financials
- 13.1.4.4. SWOT Analysis
- 13.1.5 Kerry Group PLC
- 13.1.5.1. Company Overview
- 13.1.5.2. Products
- 13.1.5.3. Company Financials
- 13.1.5.4. SWOT Analysis
- 13.1.6 Cargill Inc
- 13.1.6.1. Company Overview
- 13.1.6.2. Products
- 13.1.6.3. Company Financials
- 13.1.6.4. SWOT Analysis
- 13.1.7 Go Macro LLC
- 13.1.7.1. Company Overview
- 13.1.7.2. Products
- 13.1.7.3. Company Financials
- 13.1.7.4. SWOT Analysis
- 13.1.8 Archer-Daniels-Midland Company
- 13.1.8.1. Company Overview
- 13.1.8.2. Products
- 13.1.8.3. Company Financials
- 13.1.8.4. SWOT Analysis
- 13.1.9 Garden of Life (Nestlé S A )
- 13.1.9.1. Company Overview
- 13.1.9.2. Products
- 13.1.9.3. Company Financials
- 13.1.9.4. SWOT Analysis
- 13.1.10 The Hershey Company
- 13.1.10.1. Company Overview
- 13.1.10.2. Products
- 13.1.10.3. Company Financials
- 13.1.10.4. SWOT Analysis
- 13.1.1 PepsiCo Inc
- 13.2. Market Entropy
- 13.2.1 Company's Key Areas Served
- 13.2.2 Recent Developments
- 13.3. Company Market Share Analysis 2025
- 13.3.1 Top 5 Companies Market Share Analysis
- 13.3.2 Top 3 Companies Market Share Analysis
- 13.4. List of Potential Customers
- 14. Research Methodology
List of Figures
- Figure 1: Global Ethical Labels Industry Revenue Breakdown (Million, %) by Region 2025 & 2033
- Figure 2: North America Ethical Labels Industry Revenue (Million), by Label Type 2025 & 2033
- Figure 3: North America Ethical Labels Industry Revenue Share (%), by Label Type 2025 & 2033
- Figure 4: North America Ethical Labels Industry Revenue (Million), by Product Type 2025 & 2033
- Figure 5: North America Ethical Labels Industry Revenue Share (%), by Product Type 2025 & 2033
- Figure 6: North America Ethical Labels Industry Revenue (Million), by Distribution Channel 2025 & 2033
- Figure 7: North America Ethical Labels Industry Revenue Share (%), by Distribution Channel 2025 & 2033
- Figure 8: North America Ethical Labels Industry Revenue (Million), by Country 2025 & 2033
- Figure 9: North America Ethical Labels Industry Revenue Share (%), by Country 2025 & 2033
- Figure 10: Europe Ethical Labels Industry Revenue (Million), by Label Type 2025 & 2033
- Figure 11: Europe Ethical Labels Industry Revenue Share (%), by Label Type 2025 & 2033
- Figure 12: Europe Ethical Labels Industry Revenue (Million), by Product Type 2025 & 2033
- Figure 13: Europe Ethical Labels Industry Revenue Share (%), by Product Type 2025 & 2033
- Figure 14: Europe Ethical Labels Industry Revenue (Million), by Distribution Channel 2025 & 2033
- Figure 15: Europe Ethical Labels Industry Revenue Share (%), by Distribution Channel 2025 & 2033
- Figure 16: Europe Ethical Labels Industry Revenue (Million), by Country 2025 & 2033
- Figure 17: Europe Ethical Labels Industry Revenue Share (%), by Country 2025 & 2033
- Figure 18: Asia Ethical Labels Industry Revenue (Million), by Label Type 2025 & 2033
- Figure 19: Asia Ethical Labels Industry Revenue Share (%), by Label Type 2025 & 2033
- Figure 20: Asia Ethical Labels Industry Revenue (Million), by Product Type 2025 & 2033
- Figure 21: Asia Ethical Labels Industry Revenue Share (%), by Product Type 2025 & 2033
- Figure 22: Asia Ethical Labels Industry Revenue (Million), by Distribution Channel 2025 & 2033
- Figure 23: Asia Ethical Labels Industry Revenue Share (%), by Distribution Channel 2025 & 2033
- Figure 24: Asia Ethical Labels Industry Revenue (Million), by Country 2025 & 2033
- Figure 25: Asia Ethical Labels Industry Revenue Share (%), by Country 2025 & 2033
- Figure 26: Australia and New Zealand Ethical Labels Industry Revenue (Million), by Label Type 2025 & 2033
- Figure 27: Australia and New Zealand Ethical Labels Industry Revenue Share (%), by Label Type 2025 & 2033
- Figure 28: Australia and New Zealand Ethical Labels Industry Revenue (Million), by Product Type 2025 & 2033
- Figure 29: Australia and New Zealand Ethical Labels Industry Revenue Share (%), by Product Type 2025 & 2033
- Figure 30: Australia and New Zealand Ethical Labels Industry Revenue (Million), by Distribution Channel 2025 & 2033
- Figure 31: Australia and New Zealand Ethical Labels Industry Revenue Share (%), by Distribution Channel 2025 & 2033
- Figure 32: Australia and New Zealand Ethical Labels Industry Revenue (Million), by Country 2025 & 2033
- Figure 33: Australia and New Zealand Ethical Labels Industry Revenue Share (%), by Country 2025 & 2033
- Figure 34: Latin America Ethical Labels Industry Revenue (Million), by Label Type 2025 & 2033
- Figure 35: Latin America Ethical Labels Industry Revenue Share (%), by Label Type 2025 & 2033
- Figure 36: Latin America Ethical Labels Industry Revenue (Million), by Product Type 2025 & 2033
- Figure 37: Latin America Ethical Labels Industry Revenue Share (%), by Product Type 2025 & 2033
- Figure 38: Latin America Ethical Labels Industry Revenue (Million), by Distribution Channel 2025 & 2033
- Figure 39: Latin America Ethical Labels Industry Revenue Share (%), by Distribution Channel 2025 & 2033
- Figure 40: Latin America Ethical Labels Industry Revenue (Million), by Country 2025 & 2033
- Figure 41: Latin America Ethical Labels Industry Revenue Share (%), by Country 2025 & 2033
- Figure 42: Middle East and Africa Ethical Labels Industry Revenue (Million), by Label Type 2025 & 2033
- Figure 43: Middle East and Africa Ethical Labels Industry Revenue Share (%), by Label Type 2025 & 2033
- Figure 44: Middle East and Africa Ethical Labels Industry Revenue (Million), by Product Type 2025 & 2033
- Figure 45: Middle East and Africa Ethical Labels Industry Revenue Share (%), by Product Type 2025 & 2033
- Figure 46: Middle East and Africa Ethical Labels Industry Revenue (Million), by Distribution Channel 2025 & 2033
- Figure 47: Middle East and Africa Ethical Labels Industry Revenue Share (%), by Distribution Channel 2025 & 2033
- Figure 48: Middle East and Africa Ethical Labels Industry Revenue (Million), by Country 2025 & 2033
- Figure 49: Middle East and Africa Ethical Labels Industry Revenue Share (%), by Country 2025 & 2033
List of Tables
- Table 1: Global Ethical Labels Industry Revenue Million Forecast, by Label Type 2020 & 2033
- Table 2: Global Ethical Labels Industry Revenue Million Forecast, by Product Type 2020 & 2033
- Table 3: Global Ethical Labels Industry Revenue Million Forecast, by Distribution Channel 2020 & 2033
- Table 4: Global Ethical Labels Industry Revenue Million Forecast, by Region 2020 & 2033
- Table 5: Global Ethical Labels Industry Revenue Million Forecast, by Label Type 2020 & 2033
- Table 6: Global Ethical Labels Industry Revenue Million Forecast, by Product Type 2020 & 2033
- Table 7: Global Ethical Labels Industry Revenue Million Forecast, by Distribution Channel 2020 & 2033
- Table 8: Global Ethical Labels Industry Revenue Million Forecast, by Country 2020 & 2033
- Table 9: Global Ethical Labels Industry Revenue Million Forecast, by Label Type 2020 & 2033
- Table 10: Global Ethical Labels Industry Revenue Million Forecast, by Product Type 2020 & 2033
- Table 11: Global Ethical Labels Industry Revenue Million Forecast, by Distribution Channel 2020 & 2033
- Table 12: Global Ethical Labels Industry Revenue Million Forecast, by Country 2020 & 2033
- Table 13: Global Ethical Labels Industry Revenue Million Forecast, by Label Type 2020 & 2033
- Table 14: Global Ethical Labels Industry Revenue Million Forecast, by Product Type 2020 & 2033
- Table 15: Global Ethical Labels Industry Revenue Million Forecast, by Distribution Channel 2020 & 2033
- Table 16: Global Ethical Labels Industry Revenue Million Forecast, by Country 2020 & 2033
- Table 17: Global Ethical Labels Industry Revenue Million Forecast, by Label Type 2020 & 2033
- Table 18: Global Ethical Labels Industry Revenue Million Forecast, by Product Type 2020 & 2033
- Table 19: Global Ethical Labels Industry Revenue Million Forecast, by Distribution Channel 2020 & 2033
- Table 20: Global Ethical Labels Industry Revenue Million Forecast, by Country 2020 & 2033
- Table 21: Global Ethical Labels Industry Revenue Million Forecast, by Label Type 2020 & 2033
- Table 22: Global Ethical Labels Industry Revenue Million Forecast, by Product Type 2020 & 2033
- Table 23: Global Ethical Labels Industry Revenue Million Forecast, by Distribution Channel 2020 & 2033
- Table 24: Global Ethical Labels Industry Revenue Million Forecast, by Country 2020 & 2033
- Table 25: Global Ethical Labels Industry Revenue Million Forecast, by Label Type 2020 & 2033
- Table 26: Global Ethical Labels Industry Revenue Million Forecast, by Product Type 2020 & 2033
- Table 27: Global Ethical Labels Industry Revenue Million Forecast, by Distribution Channel 2020 & 2033
- Table 28: Global Ethical Labels Industry Revenue Million Forecast, by Country 2020 & 2033
Frequently Asked Questions
1. What is the projected Compound Annual Growth Rate (CAGR) of the Ethical Labels Industry?
The projected CAGR is approximately 7.10%.
2. Which companies are prominent players in the Ethical Labels Industry?
Key companies in the market include PepsiCo Inc, Ingredion Incorporated*List Not Exhaustive, Koninklijke DSM N V, The Kraft Heinz Company, Kerry Group PLC, Cargill Inc, Go Macro LLC, Archer-Daniels-Midland Company, Garden of Life (Nestlé S A ), The Hershey Company.
3. What are the main segments of the Ethical Labels Industry?
The market segments include Label Type, Product Type, Distribution Channel.
4. Can you provide details about the market size?
The market size is estimated to be USD 0.94 Million as of 2022.
5. What are some drivers contributing to market growth?
Increased Consumer Conscious toward Health and Ethical Values; Growth due to Online Retailing and CSR Activities; Reduction in Meat Consumption for Environmental Sustainability.
6. What are the notable trends driving market growth?
Beverages To Occupy Highest Market Share.
7. Are there any restraints impacting market growth?
Increasing Competition Among Players.
8. Can you provide examples of recent developments in the market?
September 2023: Maranello launched its ethical label. To obtain the Maranello on Earth label, a product must fulfill one of 4 criteria: a useful, sustainable promotional object that can be recycled and that is biodegradable, or a renewable promotional object that uses fewer materials or eco-designed materials produced using organic and recycled materials. It can also be a promotional object with a low carbon footprint, using locally-produced raw materials and green transport over short distances, or a promotional object with a socially positive contribution, environmentally ethical, using European, national, or even local know-how; using local or international, charity-based, socially responsible or fair-trade manufacture.
9. What pricing options are available for accessing the report?
Pricing options include single-user, multi-user, and enterprise licenses priced at USD 4750, USD 5250, and USD 8750 respectively.
10. Is the market size provided in terms of value or volume?
The market size is provided in terms of value, measured in Million.
11. Are there any specific market keywords associated with the report?
Yes, the market keyword associated with the report is "Ethical Labels Industry," which aids in identifying and referencing the specific market segment covered.
12. How do I determine which pricing option suits my needs best?
The pricing options vary based on user requirements and access needs. Individual users may opt for single-user licenses, while businesses requiring broader access may choose multi-user or enterprise licenses for cost-effective access to the report.
13. Are there any additional resources or data provided in the Ethical Labels Industry report?
While the report offers comprehensive insights, it's advisable to review the specific contents or supplementary materials provided to ascertain if additional resources or data are available.
14. How can I stay updated on further developments or reports in the Ethical Labels Industry?
To stay informed about further developments, trends, and reports in the Ethical Labels Industry, consider subscribing to industry newsletters, following relevant companies and organizations, or regularly checking reputable industry news sources and publications.
Methodology
Step 1 - Identification of Relevant Samples Size from Population Database


Step 2 - Approaches for Defining Global Market Size (Value, Volume* & Price*)

Note*: In applicable scenarios
Step 3 - Data Sources
Primary Research
- Web Analytics
- Survey Reports
- Research Institute
- Latest Research Reports
- Opinion Leaders
Secondary Research
- Annual Reports
- White Paper
- Latest Press Release
- Industry Association
- Paid Database
- Investor Presentations

Step 4 - Data Triangulation
Involves using different sources of information in order to increase the validity of a study
These sources are likely to be stakeholders in a program - participants, other researchers, program staff, other community members, and so on.
Then we put all data in single framework & apply various statistical tools to find out the dynamic on the market.
During the analysis stage, feedback from the stakeholder groups would be compared to determine areas of agreement as well as areas of divergence