

Key Insights
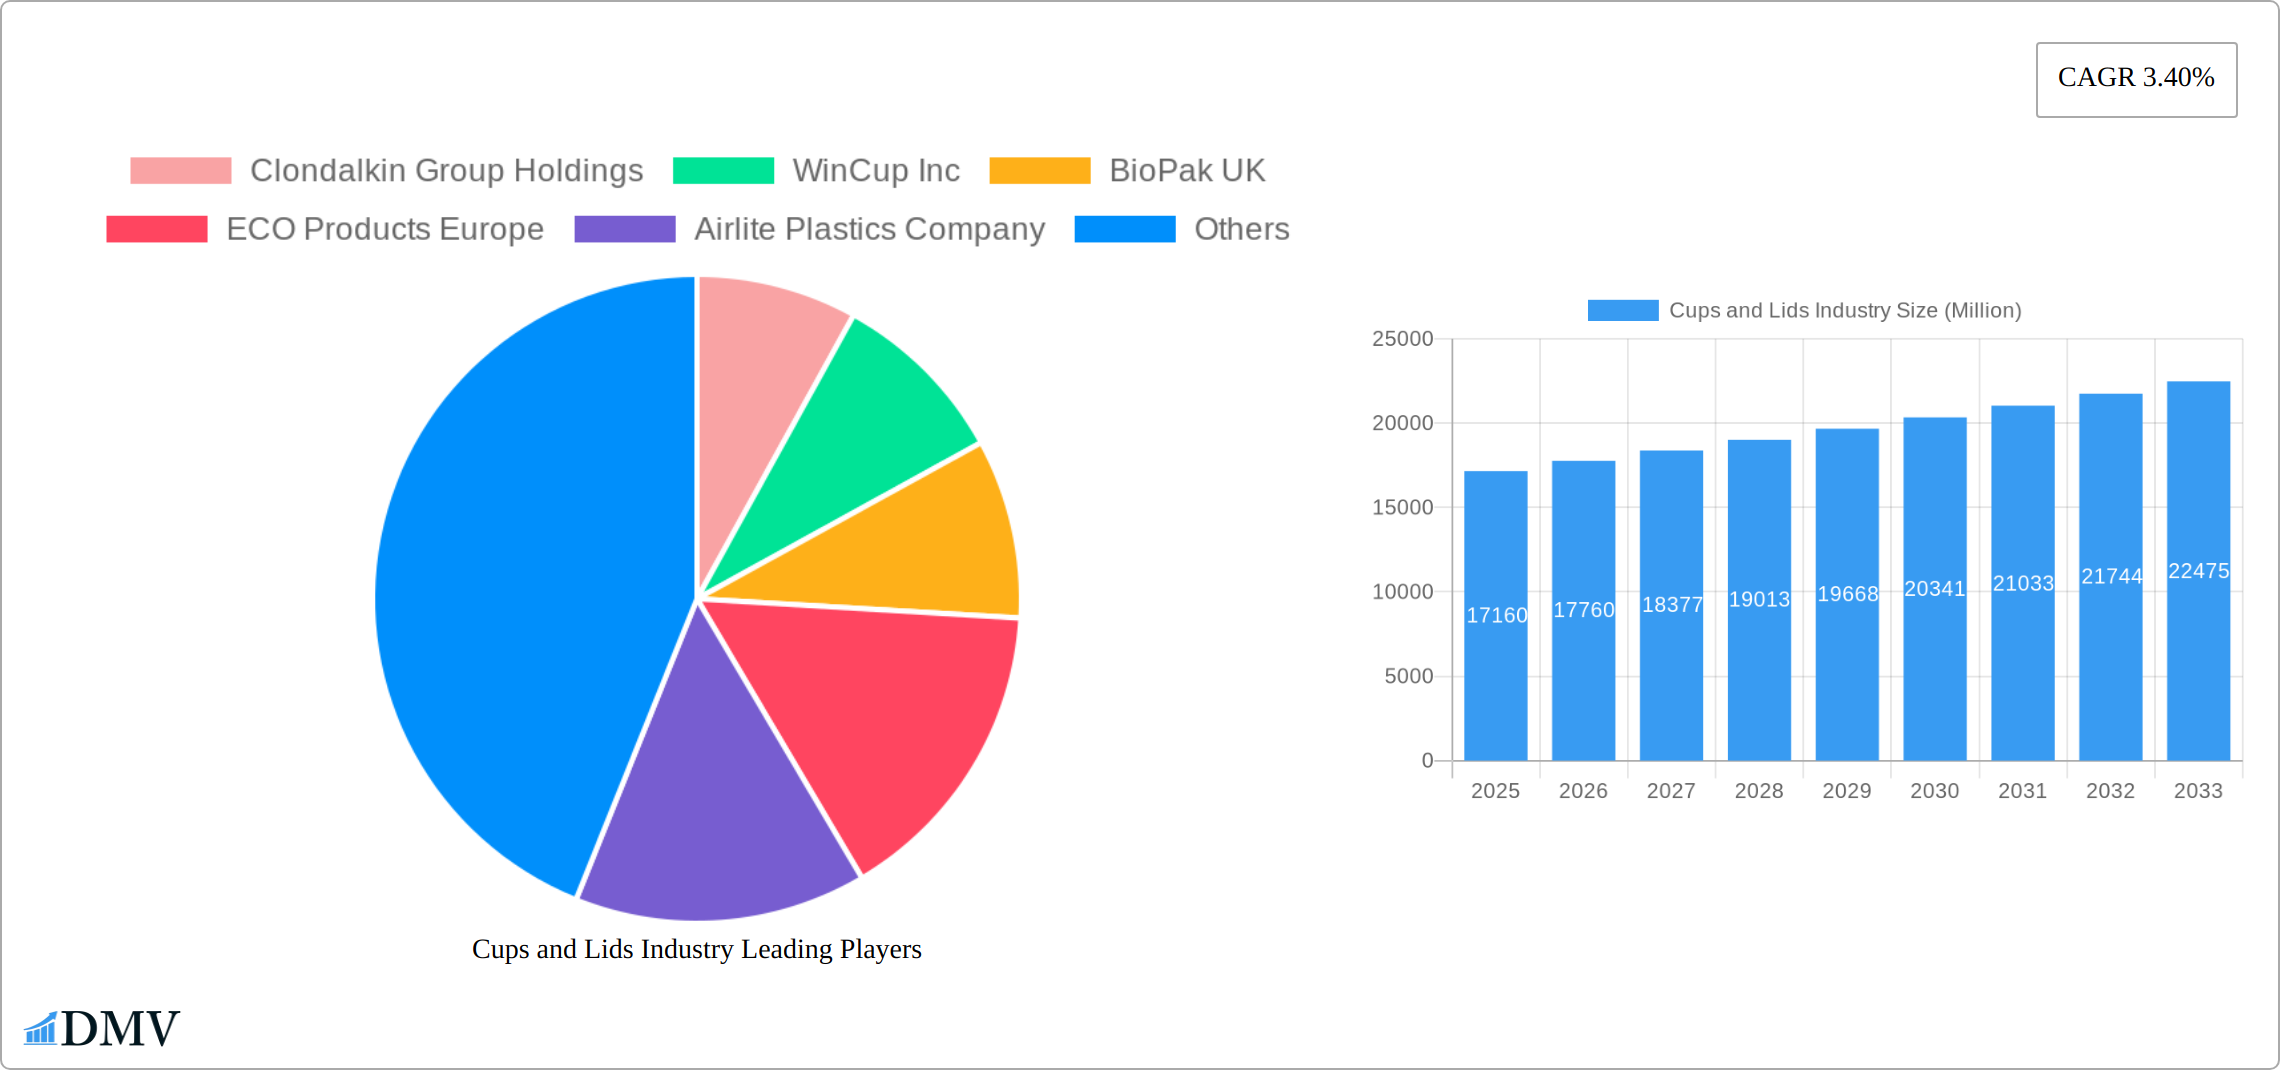
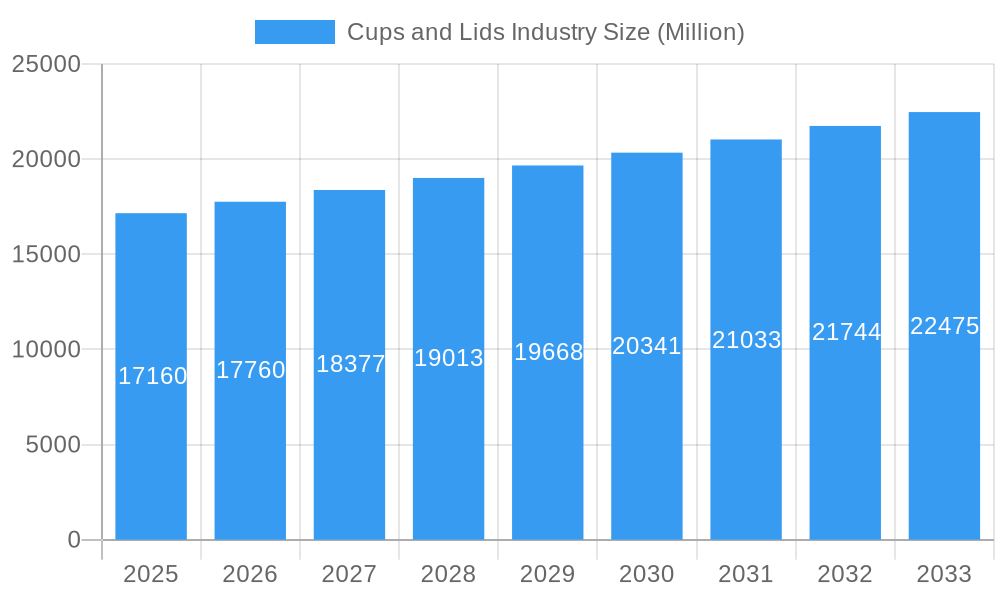
The global cups and lids market, valued at $17.16 billion in 2025, is projected to experience steady growth, driven by several key factors. The increasing demand for convenient food and beverage packaging across various end-user verticals, such as foodservice and retail, fuels market expansion. The rising popularity of takeaway and delivery services, particularly in urban areas, significantly contributes to this demand. Furthermore, advancements in material science are leading to the development of eco-friendly and sustainable cups and lids made from biodegradable materials like paper and plant-based plastics, catering to growing environmental concerns. This shift towards sustainability is a major trend shaping the market's future, with manufacturers investing heavily in research and development to offer more environmentally conscious options. Competitive pressures within the industry are also driving innovation, with companies constantly striving to improve product design, functionality, and cost-effectiveness. The market segmentation by material (plastic, paper, foam, other) and product type (drinking cups, packaging cups, lids) reflects this diverse landscape, providing opportunities for specialized players to cater to specific niche demands. Geographic variations in consumption patterns and regulatory landscapes influence regional market performance, with North America and Europe expected to maintain significant market share, while Asia-Pacific exhibits considerable growth potential due to its expanding population and developing economies.
Cups and Lids Industry Market Size (In Billion)
Despite the positive outlook, the market faces some challenges. Fluctuations in raw material prices, particularly for plastics and paper, can impact profitability. Stringent environmental regulations and increasing consumer awareness of plastic waste are pushing manufacturers towards sustainable alternatives, potentially increasing production costs in the short term. However, this also presents long-term opportunities for companies able to successfully navigate the transition towards eco-friendly materials and processes. Competition among established players and emerging market entrants remains intense, requiring companies to focus on differentiation, brand building, and efficient supply chain management to maintain their market position. The forecast period of 2025-2033 suggests continuous market expansion, though the rate of growth will be influenced by the interplay of these driving forces, trends, and restraints. Overall, the cups and lids market presents a dynamic and evolving landscape with significant growth potential for companies that can effectively adapt to changing consumer preferences and environmental concerns.
Cups and Lids Industry Company Market Share
Cups and Lids Industry Market Report: 2019-2033
This comprehensive report provides an in-depth analysis of the global Cups and Lids industry, projecting a market valuation of $XX Million by 2033. The study covers the period from 2019 to 2033, with a base year of 2025 and a forecast period spanning 2025-2033. This insightful analysis is crucial for stakeholders seeking to understand market dynamics, identify growth opportunities, and make informed strategic decisions in this ever-evolving sector.
Cups and Lids Industry Market Composition & Trends
The global cups and lids market, valued at $XX Million in 2024, is characterized by a moderately concentrated landscape. Key players like Clondalkin Group Holdings, WinCup Inc, BioPak UK, and ECO Products Europe hold significant market share, with ongoing M&A activity shaping the competitive dynamics. The industry is witnessing a surge in demand driven by the thriving food and beverage sector and the rise of single-serve consumption. However, increasing environmental concerns are prompting a shift towards sustainable materials and packaging solutions, creating both opportunities and challenges.
- Market Share Distribution (2024): Clondalkin Group Holdings (XX%), WinCup Inc (XX%), BioPak UK (XX%), Others (XX%). (Note: Precise figures require further proprietary data analysis)
- Innovation Catalysts: Growing demand for eco-friendly materials, advancements in manufacturing technologies (e.g., injection molding for rPET), and the increasing adoption of digital printing technologies for customized packaging.
- Regulatory Landscape: Stringent regulations regarding material composition, recyclability, and labeling are influencing product development and packaging choices.
- Substitute Products: Reusable cups and containers are emerging as a significant substitute, presenting challenges to traditional disposable cup manufacturers.
- End-User Profiles: Food services (restaurants, cafes), retail outlets (supermarkets, convenience stores), and food and beverage manufacturers are primary end users.
- M&A Activities: Recent mergers and acquisitions have involved investments valued at approximately $XX Million, indicating consolidation within the sector. Further research is required to gather complete data.
Cups and Lids Industry Evolution
The cups and lids industry has experienced consistent growth over the historical period (2019-2024), with a Compound Annual Growth Rate (CAGR) of XX%. This growth is largely attributed to rising disposable incomes, changing consumer lifestyles, and the expanding food service industry. Technological advancements, such as the development of biodegradable and compostable materials and improved printing techniques, have further fueled market expansion. However, fluctuating raw material prices and evolving consumer preferences towards sustainability have presented challenges. Consumer demand is shifting towards eco-friendly options, prompting manufacturers to invest heavily in research and development of sustainable alternatives. Growth rates are expected to moderate slightly in the forecast period due to increased competition and economic fluctuations but overall the sector maintains a promising outlook.
Leading Regions, Countries, or Segments in Cups and Lids Industry
- By Material: While plastic maintains market dominance due to its affordability and versatility, the paper segment experiences robust growth fueled by the escalating demand for eco-friendly alternatives. This shift reflects a growing consumer and regulatory emphasis on sustainability. Other materials, such as biodegradable polymers, are also gaining traction, albeit from a smaller market share.
- By Product: Drinking cups constitute the largest market segment, driven by substantial demand from the food service and retail sectors. However, the market for packaging cups and lids, particularly those designed for takeout and delivery services, shows significant and consistent growth, reflecting changing consumer habits and the expansion of the food delivery industry.
- By End-User Vertical: The foodservice industry remains the primary end-user, accounting for a substantial portion of market revenue. Nevertheless, the retail sector, along with other significant verticals like healthcare (hospitals, clinics), offices, and educational institutions, exhibit considerable growth potential, presenting lucrative opportunities for manufacturers.
Geographic Dominance Factors:
- North America: The robust food service industry, coupled with high disposable incomes and a mature retail infrastructure, creates a consistently high demand for cups and lids. Furthermore, a well-established recycling infrastructure in certain areas supports the growth of sustainable packaging options.
- Europe: The increasing adoption of sustainable packaging solutions is driven by stringent environmental regulations and consumer awareness. A well-developed recycling infrastructure further incentivizes the use of eco-friendly materials.
- Asia-Pacific: Rapid economic expansion, population growth, and urbanization fuel market expansion. This region represents a significant growth opportunity, particularly in emerging markets with increasing disposable incomes.
The market share of each segment and geographic region is dynamic and influenced by various factors, including fluctuating consumer preferences, economic growth rates, evolving environmental regulations, and the introduction of innovative products. Precise market share data requires ongoing and detailed market research.
Cups and Lids Industry Product Innovations
Recent advancements demonstrate a clear trend toward sustainability and enhanced functionality. Examples include the development of lightweight, thin-walled rPET cups (as seen in collaborations with companies like Greiner Packaging), which improve sustainability and manufacturing efficiency. The incorporation of water and oil barriers in molded fiber packaging expands the applicability of eco-friendly options while boosting recyclability. Furthermore, advancements in digital printing technologies enable customized designs and branding, providing brands with increased marketing flexibility and opportunities for unique product differentiation.
Propelling Factors for Cups and Lids Industry Growth
Several key factors are driving market expansion:
- Technological Advancements: The development of sustainable materials (such as PLA and rPET), improved manufacturing processes (e.g., automation and optimized production lines), and the increasing sophistication of digital printing capabilities are all significant growth drivers.
- Economic Growth and Changing Consumer Habits: Rising disposable incomes in developing economies, coupled with evolving consumer preferences towards convenience and on-the-go consumption, lead to increased demand for packaged food and beverages.
- Favorable Regulatory Environment: Governments worldwide are increasingly implementing policies that promote sustainable packaging, creating incentives for innovation and the adoption of eco-friendly materials. This includes regulations that restrict the use of certain materials and promote the use of recyclable or compostable alternatives.
- Expansion of Food Delivery Services: The explosive growth of food delivery platforms contributes significantly to the demand for disposable cups and lids.
Obstacles in the Cups and Lids Industry Market
Significant obstacles include:
- Regulatory challenges: Stringent regulations regarding material composition and recyclability increase production costs and complexity.
- Supply chain disruptions: Fluctuations in raw material prices and potential supply chain bottlenecks can impact profitability.
- Competitive pressure: Intense competition from established players and emerging sustainable packaging alternatives puts pressure on profit margins.
Future Opportunities in Cups and Lids Industry
Emerging opportunities are primarily in the areas of:
- Sustainable Packaging: Development and commercialization of biodegradable, compostable, and fully recyclable materials.
- Smart Packaging: Integration of technology to enhance product tracking and consumer engagement.
- Growth in Emerging Markets: Expanding into regions with high population density and growing foodservice sectors.
Major Players in the Cups and Lids Industry Ecosystem
- Clondalkin Group Holdings
- WinCup Inc
- BioPak UK
- ECO Products Europe
- Airlite Plastics Company
- Brendos Ltd
- Dart Container
- Paper Cup Company
- Solo Cup Operating Corporation
- Mondi Group
- Georgia-Pacific LLC
- Greiner Holding AG
- Greiner AG
- Graphic Packaging International LLC
- Berry Global
- Printpack Inc
- Reynolds Consumer Products
- Huhtamaki Oyj
- Michael Procos SA
Key Developments in Cups and Lids Industry Industry
- April 2023: Greiner Packaging, Engel, and Brink jointly developed a thin-walled rPET cup using injection molding, reducing CO2e emissions.
- April 2022: PulPac and HSMG collaborated on water and oil barriers for PulPac Dry Molded Fiber technology, improving molded fiber packaging recyclability.
Strategic Cups and Lids Industry Market Forecast
The Cups and Lids industry is poised for continued growth, driven by innovation in sustainable materials, technological advancements in manufacturing, and the expansion of the food and beverage sector. The increasing focus on environmentally friendly packaging presents significant opportunities for manufacturers to develop and market innovative solutions that meet evolving consumer demands. The market is expected to reach $XX Million by 2033, presenting a lucrative investment opportunity for stakeholders.
Cups and Lids Industry Segmentation
-
1. Material
- 1.1. Plastic
- 1.2. Paper
- 1.3. Foam
- 1.4. Other Materials
-
2. Product
- 2.1. Drinking Cups
- 2.2. Packagin
- 2.3. Lids
-
3. End-User Vertical
- 3.1. Food and Beverage
- 3.2. Foodservices
- 3.3. Retail and Other End User Verticals
Cups and Lids Industry Segmentation By Geography
-
1. North America
- 1.1. United States
- 1.2. Canada
-
2. Europe
- 2.1. United kingdom
- 2.2. France
- 2.3. Germany
-
3. Asia
- 3.1. China
- 3.2. Japan
- 3.3. India
- 3.4. Australia and New Zealand
-
4. Latin America
- 4.1. Brazil
- 4.2. Mexico
-
5. Middle East and Africa
- 5.1. United Arab Emirates
- 5.2. South Africa
- 5.3. Saudi Arabia
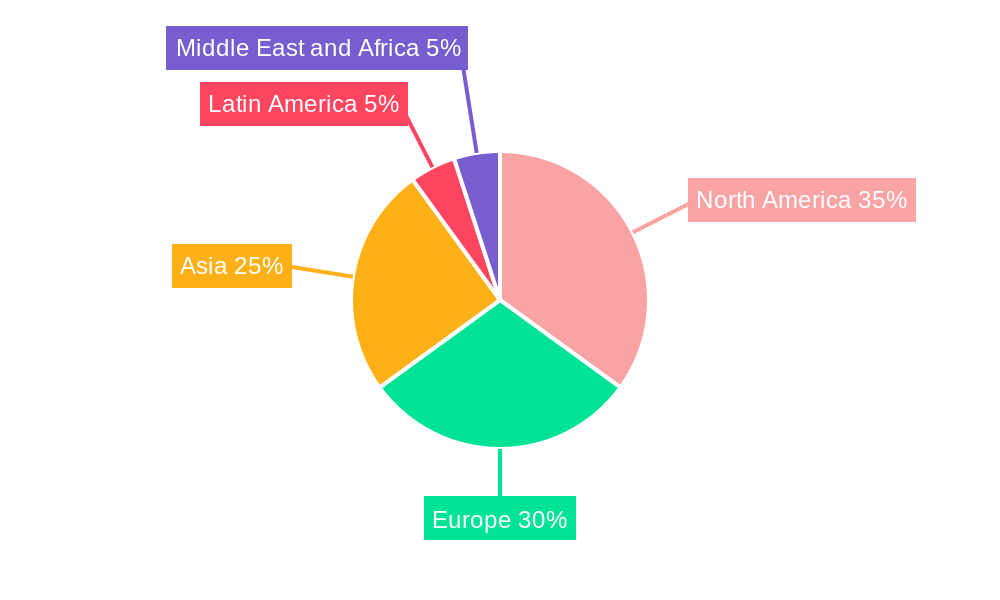
Cups and Lids Industry Regional Market Share
Geographic Coverage of Cups and Lids Industry
Cups and Lids Industry REPORT HIGHLIGHTS
| Aspects | Details |
|---|---|
| Study Period | 2020-2034 |
| Base Year | 2025 |
| Estimated Year | 2026 |
| Forecast Period | 2026-2034 |
| Historical Period | 2020-2025 |
| Growth Rate | CAGR of 3.40% from 2020-2034 |
| Segmentation |
|
Table of Contents
- 1. Introduction
- 1.1. Research Scope
- 1.2. Market Segmentation
- 1.3. Research Objective
- 1.4. Definitions and Assumptions
- 2. Executive Summary
- 2.1. Market Snapshot
- 3. Market Dynamics
- 3.1. Market Drivers
- 3.2. Market Restrains
- 3.3. Market Trends
- 3.4. Market Opportunities
- 4. Market Factor Analysis
- 4.1. Porters Five Forces
- 4.1.1. Bargaining Power of Suppliers
- 4.1.2. Bargaining Power of Buyers
- 4.1.3. Threat of New Entrants
- 4.1.4. Threat of Substitutes
- 4.1.5. Competitive Rivalry
- 4.2. PESTEL analysis
- 4.3. BCG Analysis
- 4.3.1. Stars (High Growth, High Market Share)
- 4.3.2. Cash Cows (Low Growth, High Market Share)
- 4.3.3. Question Mark (High Growth, Low Market Share)
- 4.3.4. Dogs (Low Growth, Low Market Share)
- 4.4. Ansoff Matrix Analysis
- 4.5. Supply Chain Analysis
- 4.6. Regulatory Landscape
- 4.7. Current Market Potential and Opportunity Assessment (TAM–SAM–SOM Framework)
- 4.8. DMV Analyst Note
- 4.1. Porters Five Forces
- 5. Market Analysis, Insights and Forecast 2021-2033
- 5.1. Market Analysis, Insights and Forecast - by Material
- 5.1.1. Plastic
- 5.1.2. Paper
- 5.1.3. Foam
- 5.1.4. Other Materials
- 5.2. Market Analysis, Insights and Forecast - by Product
- 5.2.1. Drinking Cups
- 5.2.2. Packagin
- 5.2.3. Lids
- 5.3. Market Analysis, Insights and Forecast - by End-User Vertical
- 5.3.1. Food and Beverage
- 5.3.2. Foodservices
- 5.3.3. Retail and Other End User Verticals
- 5.4. Market Analysis, Insights and Forecast - by Region
- 5.4.1. North America
- 5.4.2. Europe
- 5.4.3. Asia
- 5.4.4. Latin America
- 5.4.5. Middle East and Africa
- 5.1. Market Analysis, Insights and Forecast - by Material
- 6. Global Cups and Lids Industry Analysis, Insights and Forecast, 2021-2033
- 6.1. Market Analysis, Insights and Forecast - by Material
- 6.1.1. Plastic
- 6.1.2. Paper
- 6.1.3. Foam
- 6.1.4. Other Materials
- 6.2. Market Analysis, Insights and Forecast - by Product
- 6.2.1. Drinking Cups
- 6.2.2. Packagin
- 6.2.3. Lids
- 6.3. Market Analysis, Insights and Forecast - by End-User Vertical
- 6.3.1. Food and Beverage
- 6.3.2. Foodservices
- 6.3.3. Retail and Other End User Verticals
- 6.1. Market Analysis, Insights and Forecast - by Material
- 7. North America Cups and Lids Industry Analysis, Insights and Forecast, 2020-2032
- 7.1. Market Analysis, Insights and Forecast - by Material
- 7.1.1. Plastic
- 7.1.2. Paper
- 7.1.3. Foam
- 7.1.4. Other Materials
- 7.2. Market Analysis, Insights and Forecast - by Product
- 7.2.1. Drinking Cups
- 7.2.2. Packagin
- 7.2.3. Lids
- 7.3. Market Analysis, Insights and Forecast - by End-User Vertical
- 7.3.1. Food and Beverage
- 7.3.2. Foodservices
- 7.3.3. Retail and Other End User Verticals
- 7.1. Market Analysis, Insights and Forecast - by Material
- 8. Europe Cups and Lids Industry Analysis, Insights and Forecast, 2020-2032
- 8.1. Market Analysis, Insights and Forecast - by Material
- 8.1.1. Plastic
- 8.1.2. Paper
- 8.1.3. Foam
- 8.1.4. Other Materials
- 8.2. Market Analysis, Insights and Forecast - by Product
- 8.2.1. Drinking Cups
- 8.2.2. Packagin
- 8.2.3. Lids
- 8.3. Market Analysis, Insights and Forecast - by End-User Vertical
- 8.3.1. Food and Beverage
- 8.3.2. Foodservices
- 8.3.3. Retail and Other End User Verticals
- 8.1. Market Analysis, Insights and Forecast - by Material
- 9. Asia Cups and Lids Industry Analysis, Insights and Forecast, 2020-2032
- 9.1. Market Analysis, Insights and Forecast - by Material
- 9.1.1. Plastic
- 9.1.2. Paper
- 9.1.3. Foam
- 9.1.4. Other Materials
- 9.2. Market Analysis, Insights and Forecast - by Product
- 9.2.1. Drinking Cups
- 9.2.2. Packagin
- 9.2.3. Lids
- 9.3. Market Analysis, Insights and Forecast - by End-User Vertical
- 9.3.1. Food and Beverage
- 9.3.2. Foodservices
- 9.3.3. Retail and Other End User Verticals
- 9.1. Market Analysis, Insights and Forecast - by Material
- 10. Latin America Cups and Lids Industry Analysis, Insights and Forecast, 2020-2032
- 10.1. Market Analysis, Insights and Forecast - by Material
- 10.1.1. Plastic
- 10.1.2. Paper
- 10.1.3. Foam
- 10.1.4. Other Materials
- 10.2. Market Analysis, Insights and Forecast - by Product
- 10.2.1. Drinking Cups
- 10.2.2. Packagin
- 10.2.3. Lids
- 10.3. Market Analysis, Insights and Forecast - by End-User Vertical
- 10.3.1. Food and Beverage
- 10.3.2. Foodservices
- 10.3.3. Retail and Other End User Verticals
- 10.1. Market Analysis, Insights and Forecast - by Material
- 11. Middle East and Africa Cups and Lids Industry Analysis, Insights and Forecast, 2020-2032
- 11.1. Market Analysis, Insights and Forecast - by Material
- 11.1.1. Plastic
- 11.1.2. Paper
- 11.1.3. Foam
- 11.1.4. Other Materials
- 11.2. Market Analysis, Insights and Forecast - by Product
- 11.2.1. Drinking Cups
- 11.2.2. Packagin
- 11.2.3. Lids
- 11.3. Market Analysis, Insights and Forecast - by End-User Vertical
- 11.3.1. Food and Beverage
- 11.3.2. Foodservices
- 11.3.3. Retail and Other End User Verticals
- 11.1. Market Analysis, Insights and Forecast - by Material
- 12. Competitive Analysis
- 12.1. Company Profiles
- 12.1.1 Clondalkin Group Holdings
- 12.1.1.1. Company Overview
- 12.1.1.2. Products
- 12.1.1.3. Company Financials
- 12.1.1.4. SWOT Analysis
- 12.1.2 WinCup Inc
- 12.1.2.1. Company Overview
- 12.1.2.2. Products
- 12.1.2.3. Company Financials
- 12.1.2.4. SWOT Analysis
- 12.1.3 BioPak UK
- 12.1.3.1. Company Overview
- 12.1.3.2. Products
- 12.1.3.3. Company Financials
- 12.1.3.4. SWOT Analysis
- 12.1.4 ECO Products Europe
- 12.1.4.1. Company Overview
- 12.1.4.2. Products
- 12.1.4.3. Company Financials
- 12.1.4.4. SWOT Analysis
- 12.1.5 Airlite Plastics Company
- 12.1.5.1. Company Overview
- 12.1.5.2. Products
- 12.1.5.3. Company Financials
- 12.1.5.4. SWOT Analysis
- 12.1.6 Brendos Ltd
- 12.1.6.1. Company Overview
- 12.1.6.2. Products
- 12.1.6.3. Company Financials
- 12.1.6.4. SWOT Analysis
- 12.1.7 Dart Containe
- 12.1.7.1. Company Overview
- 12.1.7.2. Products
- 12.1.7.3. Company Financials
- 12.1.7.4. SWOT Analysis
- 12.1.8 Paper Cup Company
- 12.1.8.1. Company Overview
- 12.1.8.2. Products
- 12.1.8.3. Company Financials
- 12.1.8.4. SWOT Analysis
- 12.1.9 Solo Cup Operating Corporation
- 12.1.9.1. Company Overview
- 12.1.9.2. Products
- 12.1.9.3. Company Financials
- 12.1.9.4. SWOT Analysis
- 12.1.10 Mondi Group
- 12.1.10.1. Company Overview
- 12.1.10.2. Products
- 12.1.10.3. Company Financials
- 12.1.10.4. SWOT Analysis
- 12.1.11 Georgia-Pacific LLC
- 12.1.11.1. Company Overview
- 12.1.11.2. Products
- 12.1.11.3. Company Financials
- 12.1.11.4. SWOT Analysis
- 12.1.12 Greiner Holding AG
- 12.1.12.1. Company Overview
- 12.1.12.2. Products
- 12.1.12.3. Company Financials
- 12.1.12.4. SWOT Analysis
- 12.1.13 Greiner AG
- 12.1.13.1. Company Overview
- 12.1.13.2. Products
- 12.1.13.3. Company Financials
- 12.1.13.4. SWOT Analysis
- 12.1.14 Graphic Packaging International LLC
- 12.1.14.1. Company Overview
- 12.1.14.2. Products
- 12.1.14.3. Company Financials
- 12.1.14.4. SWOT Analysis
- 12.1.15 Berry Global
- 12.1.15.1. Company Overview
- 12.1.15.2. Products
- 12.1.15.3. Company Financials
- 12.1.15.4. SWOT Analysis
- 12.1.16 Printpack Inc
- 12.1.16.1. Company Overview
- 12.1.16.2. Products
- 12.1.16.3. Company Financials
- 12.1.16.4. SWOT Analysis
- 12.1.17 Reynolds Consumer Products
- 12.1.17.1. Company Overview
- 12.1.17.2. Products
- 12.1.17.3. Company Financials
- 12.1.17.4. SWOT Analysis
- 12.1.18 Huhtamaki Oyj
- 12.1.18.1. Company Overview
- 12.1.18.2. Products
- 12.1.18.3. Company Financials
- 12.1.18.4. SWOT Analysis
- 12.1.19 Michael Procos SA
- 12.1.19.1. Company Overview
- 12.1.19.2. Products
- 12.1.19.3. Company Financials
- 12.1.19.4. SWOT Analysis
- 12.1.1 Clondalkin Group Holdings
- 12.2. Market Entropy
- 12.2.1 Company's Key Areas Served
- 12.2.2 Recent Developments
- 12.3. Company Market Share Analysis 2025
- 12.3.1 Top 5 Companies Market Share Analysis
- 12.3.2 Top 3 Companies Market Share Analysis
- 12.4. List of Potential Customers
- 13. Research Methodology
List of Figures
- Figure 1: Global Cups and Lids Industry Revenue Breakdown (Million, %) by Region 2025 & 2033
- Figure 2: North America Cups and Lids Industry Revenue (Million), by Material 2025 & 2033
- Figure 3: North America Cups and Lids Industry Revenue Share (%), by Material 2025 & 2033
- Figure 4: North America Cups and Lids Industry Revenue (Million), by Product 2025 & 2033
- Figure 5: North America Cups and Lids Industry Revenue Share (%), by Product 2025 & 2033
- Figure 6: North America Cups and Lids Industry Revenue (Million), by End-User Vertical 2025 & 2033
- Figure 7: North America Cups and Lids Industry Revenue Share (%), by End-User Vertical 2025 & 2033
- Figure 8: North America Cups and Lids Industry Revenue (Million), by Country 2025 & 2033
- Figure 9: North America Cups and Lids Industry Revenue Share (%), by Country 2025 & 2033
- Figure 10: Europe Cups and Lids Industry Revenue (Million), by Material 2025 & 2033
- Figure 11: Europe Cups and Lids Industry Revenue Share (%), by Material 2025 & 2033
- Figure 12: Europe Cups and Lids Industry Revenue (Million), by Product 2025 & 2033
- Figure 13: Europe Cups and Lids Industry Revenue Share (%), by Product 2025 & 2033
- Figure 14: Europe Cups and Lids Industry Revenue (Million), by End-User Vertical 2025 & 2033
- Figure 15: Europe Cups and Lids Industry Revenue Share (%), by End-User Vertical 2025 & 2033
- Figure 16: Europe Cups and Lids Industry Revenue (Million), by Country 2025 & 2033
- Figure 17: Europe Cups and Lids Industry Revenue Share (%), by Country 2025 & 2033
- Figure 18: Asia Cups and Lids Industry Revenue (Million), by Material 2025 & 2033
- Figure 19: Asia Cups and Lids Industry Revenue Share (%), by Material 2025 & 2033
- Figure 20: Asia Cups and Lids Industry Revenue (Million), by Product 2025 & 2033
- Figure 21: Asia Cups and Lids Industry Revenue Share (%), by Product 2025 & 2033
- Figure 22: Asia Cups and Lids Industry Revenue (Million), by End-User Vertical 2025 & 2033
- Figure 23: Asia Cups and Lids Industry Revenue Share (%), by End-User Vertical 2025 & 2033
- Figure 24: Asia Cups and Lids Industry Revenue (Million), by Country 2025 & 2033
- Figure 25: Asia Cups and Lids Industry Revenue Share (%), by Country 2025 & 2033
- Figure 26: Latin America Cups and Lids Industry Revenue (Million), by Material 2025 & 2033
- Figure 27: Latin America Cups and Lids Industry Revenue Share (%), by Material 2025 & 2033
- Figure 28: Latin America Cups and Lids Industry Revenue (Million), by Product 2025 & 2033
- Figure 29: Latin America Cups and Lids Industry Revenue Share (%), by Product 2025 & 2033
- Figure 30: Latin America Cups and Lids Industry Revenue (Million), by End-User Vertical 2025 & 2033
- Figure 31: Latin America Cups and Lids Industry Revenue Share (%), by End-User Vertical 2025 & 2033
- Figure 32: Latin America Cups and Lids Industry Revenue (Million), by Country 2025 & 2033
- Figure 33: Latin America Cups and Lids Industry Revenue Share (%), by Country 2025 & 2033
- Figure 34: Middle East and Africa Cups and Lids Industry Revenue (Million), by Material 2025 & 2033
- Figure 35: Middle East and Africa Cups and Lids Industry Revenue Share (%), by Material 2025 & 2033
- Figure 36: Middle East and Africa Cups and Lids Industry Revenue (Million), by Product 2025 & 2033
- Figure 37: Middle East and Africa Cups and Lids Industry Revenue Share (%), by Product 2025 & 2033
- Figure 38: Middle East and Africa Cups and Lids Industry Revenue (Million), by End-User Vertical 2025 & 2033
- Figure 39: Middle East and Africa Cups and Lids Industry Revenue Share (%), by End-User Vertical 2025 & 2033
- Figure 40: Middle East and Africa Cups and Lids Industry Revenue (Million), by Country 2025 & 2033
- Figure 41: Middle East and Africa Cups and Lids Industry Revenue Share (%), by Country 2025 & 2033
List of Tables
- Table 1: Global Cups and Lids Industry Revenue Million Forecast, by Material 2020 & 2033
- Table 2: Global Cups and Lids Industry Revenue Million Forecast, by Product 2020 & 2033
- Table 3: Global Cups and Lids Industry Revenue Million Forecast, by End-User Vertical 2020 & 2033
- Table 4: Global Cups and Lids Industry Revenue Million Forecast, by Region 2020 & 2033
- Table 5: Global Cups and Lids Industry Revenue Million Forecast, by Material 2020 & 2033
- Table 6: Global Cups and Lids Industry Revenue Million Forecast, by Product 2020 & 2033
- Table 7: Global Cups and Lids Industry Revenue Million Forecast, by End-User Vertical 2020 & 2033
- Table 8: Global Cups and Lids Industry Revenue Million Forecast, by Country 2020 & 2033
- Table 9: United States Cups and Lids Industry Revenue (Million) Forecast, by Application 2020 & 2033
- Table 10: Canada Cups and Lids Industry Revenue (Million) Forecast, by Application 2020 & 2033
- Table 11: Global Cups and Lids Industry Revenue Million Forecast, by Material 2020 & 2033
- Table 12: Global Cups and Lids Industry Revenue Million Forecast, by Product 2020 & 2033
- Table 13: Global Cups and Lids Industry Revenue Million Forecast, by End-User Vertical 2020 & 2033
- Table 14: Global Cups and Lids Industry Revenue Million Forecast, by Country 2020 & 2033
- Table 15: United kingdom Cups and Lids Industry Revenue (Million) Forecast, by Application 2020 & 2033
- Table 16: France Cups and Lids Industry Revenue (Million) Forecast, by Application 2020 & 2033
- Table 17: Germany Cups and Lids Industry Revenue (Million) Forecast, by Application 2020 & 2033
- Table 18: Global Cups and Lids Industry Revenue Million Forecast, by Material 2020 & 2033
- Table 19: Global Cups and Lids Industry Revenue Million Forecast, by Product 2020 & 2033
- Table 20: Global Cups and Lids Industry Revenue Million Forecast, by End-User Vertical 2020 & 2033
- Table 21: Global Cups and Lids Industry Revenue Million Forecast, by Country 2020 & 2033
- Table 22: China Cups and Lids Industry Revenue (Million) Forecast, by Application 2020 & 2033
- Table 23: Japan Cups and Lids Industry Revenue (Million) Forecast, by Application 2020 & 2033
- Table 24: India Cups and Lids Industry Revenue (Million) Forecast, by Application 2020 & 2033
- Table 25: Australia and New Zealand Cups and Lids Industry Revenue (Million) Forecast, by Application 2020 & 2033
- Table 26: Global Cups and Lids Industry Revenue Million Forecast, by Material 2020 & 2033
- Table 27: Global Cups and Lids Industry Revenue Million Forecast, by Product 2020 & 2033
- Table 28: Global Cups and Lids Industry Revenue Million Forecast, by End-User Vertical 2020 & 2033
- Table 29: Global Cups and Lids Industry Revenue Million Forecast, by Country 2020 & 2033
- Table 30: Brazil Cups and Lids Industry Revenue (Million) Forecast, by Application 2020 & 2033
- Table 31: Mexico Cups and Lids Industry Revenue (Million) Forecast, by Application 2020 & 2033
- Table 32: Global Cups and Lids Industry Revenue Million Forecast, by Material 2020 & 2033
- Table 33: Global Cups and Lids Industry Revenue Million Forecast, by Product 2020 & 2033
- Table 34: Global Cups and Lids Industry Revenue Million Forecast, by End-User Vertical 2020 & 2033
- Table 35: Global Cups and Lids Industry Revenue Million Forecast, by Country 2020 & 2033
- Table 36: United Arab Emirates Cups and Lids Industry Revenue (Million) Forecast, by Application 2020 & 2033
- Table 37: South Africa Cups and Lids Industry Revenue (Million) Forecast, by Application 2020 & 2033
- Table 38: Saudi Arabia Cups and Lids Industry Revenue (Million) Forecast, by Application 2020 & 2033
Frequently Asked Questions
1. What is the projected Compound Annual Growth Rate (CAGR) of the Cups and Lids Industry?
The projected CAGR is approximately 3.40%.
2. Which companies are prominent players in the Cups and Lids Industry?
Key companies in the market include Clondalkin Group Holdings, WinCup Inc, BioPak UK, ECO Products Europe, Airlite Plastics Company, Brendos Ltd, Dart Containe, Paper Cup Company, Solo Cup Operating Corporation, Mondi Group, Georgia-Pacific LLC, Greiner Holding AG, Greiner AG, Graphic Packaging International LLC, Berry Global, Printpack Inc, Reynolds Consumer Products, Huhtamaki Oyj, Michael Procos SA.
3. What are the main segments of the Cups and Lids Industry?
The market segments include Material, Product, End-User Vertical.
4. Can you provide details about the market size?
The market size is estimated to be USD 17.16 Million as of 2022.
5. What are some drivers contributing to market growth?
Food and Beverage Segment to Witness Significant Growth; Growing Number of QSR Aids to Market Growth.
6. What are the notable trends driving market growth?
Food and Beverage Segment to Witness Significant Growth.
7. Are there any restraints impacting market growth?
Various Regulations Pertaining to Plastic Usage.
8. Can you provide examples of recent developments in the market?
April 2023 - Greiner Packaging, Engel, and Brink have jointly developed a thin-walled cup of rPET that can be produced using injection molding technology and claims to reduce CO2 equivalent CO2e emissions.
9. What pricing options are available for accessing the report?
Pricing options include single-user, multi-user, and enterprise licenses priced at USD 4750, USD 5250, and USD 8750 respectively.
10. Is the market size provided in terms of value or volume?
The market size is provided in terms of value, measured in Million.
11. Are there any specific market keywords associated with the report?
Yes, the market keyword associated with the report is "Cups and Lids Industry," which aids in identifying and referencing the specific market segment covered.
12. How do I determine which pricing option suits my needs best?
The pricing options vary based on user requirements and access needs. Individual users may opt for single-user licenses, while businesses requiring broader access may choose multi-user or enterprise licenses for cost-effective access to the report.
13. Are there any additional resources or data provided in the Cups and Lids Industry report?
While the report offers comprehensive insights, it's advisable to review the specific contents or supplementary materials provided to ascertain if additional resources or data are available.
14. How can I stay updated on further developments or reports in the Cups and Lids Industry?
To stay informed about further developments, trends, and reports in the Cups and Lids Industry, consider subscribing to industry newsletters, following relevant companies and organizations, or regularly checking reputable industry news sources and publications.
Methodology
Step 1 - Identification of Relevant Samples Size from Population Database


Step 2 - Approaches for Defining Global Market Size (Value, Volume* & Price*)

Note*: In applicable scenarios
Step 3 - Data Sources
Primary Research
- Web Analytics
- Survey Reports
- Research Institute
- Latest Research Reports
- Opinion Leaders
Secondary Research
- Annual Reports
- White Paper
- Latest Press Release
- Industry Association
- Paid Database
- Investor Presentations

Step 4 - Data Triangulation
Involves using different sources of information in order to increase the validity of a study
These sources are likely to be stakeholders in a program - participants, other researchers, program staff, other community members, and so on.
Then we put all data in single framework & apply various statistical tools to find out the dynamic on the market.
During the analysis stage, feedback from the stakeholder groups would be compared to determine areas of agreement as well as areas of divergence