

Key Insights
The global van tire market is experiencing robust growth, driven by the expanding light commercial vehicle (LCV) segment and the increasing demand for efficient and durable tires. The market's Compound Annual Growth Rate (CAGR) is estimated to be around 5-7% between 2025 and 2033, based on industry trends and the historical growth of related sectors. This growth is fueled by several key factors. Firstly, the e-commerce boom continues to drive the need for efficient last-mile delivery solutions, boosting demand for LCVs and their associated tires. Secondly, advancements in tire technology, focusing on improved fuel efficiency, longer lifespan, and enhanced safety features, are also contributing to market expansion. Finally, growing infrastructure development globally, especially in emerging economies, is further stimulating demand for van tires.
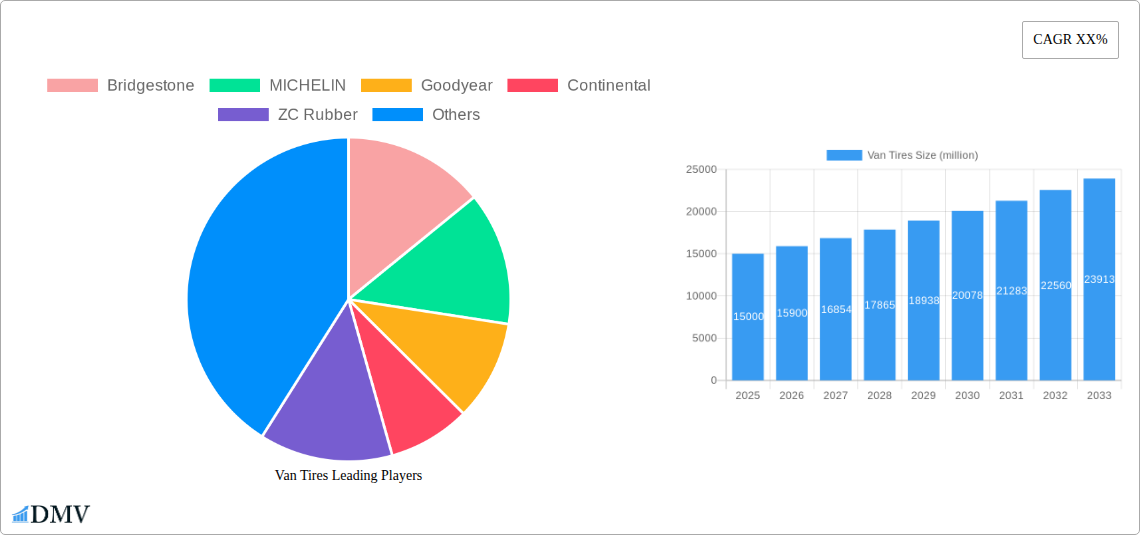
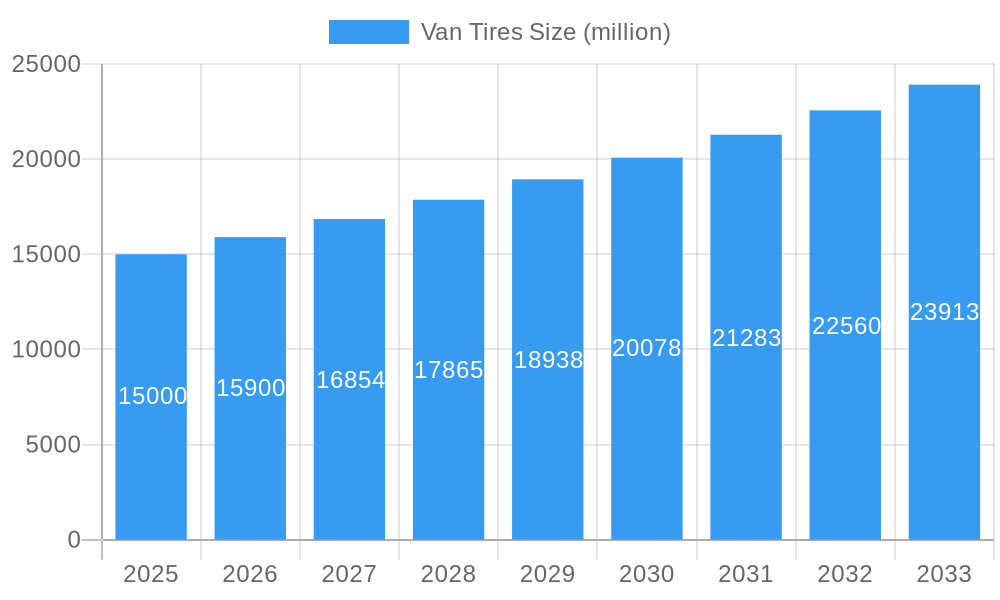
Van Tires Market Size (In Billion)
However, several factors restrain market growth. Fluctuations in raw material prices, particularly natural rubber and synthetic rubber, significantly impact production costs and profitability. Furthermore, stringent environmental regulations regarding tire manufacturing and disposal present challenges for manufacturers. Competitive pressures from established players and the emergence of new entrants also contribute to the complexities of the market. Segment analysis reveals a strong preference for all-season tires due to their versatility, while the regional breakdown shows significant market shares in North America, Europe, and Asia-Pacific, reflecting the high concentration of LCV manufacturing and usage in these regions. Leading players like Bridgestone, Michelin, Goodyear, and Continental are leveraging their brand recognition and extensive distribution networks to maintain their market dominance, while regional players are focusing on capturing niche markets and providing cost-effective solutions.
Van Tires Company Market Share
Van Tires Market: A Comprehensive Report (2019-2033)
This insightful report provides a detailed analysis of the global van tire market, projecting a robust growth trajectory driven by technological advancements and evolving consumer demands. Spanning the period from 2019 to 2033, with a focus on 2025, this comprehensive study unveils key market dynamics, competitive landscapes, and future opportunities within the multi-million dollar van tire industry. This report is indispensable for stakeholders seeking to navigate the complexities of this dynamic market and make informed strategic decisions.
Van Tires Market Composition & Trends
This section meticulously examines the market structure, highlighting concentration levels and identifying key players shaping the competitive landscape. We analyze the impact of innovation, regulatory changes, substitute products, and evolving end-user profiles on market dynamics. Furthermore, we delve into the significant mergers and acquisitions (M&A) activities within the industry, quantifying deal values in millions of dollars and assessing their influence on market share distribution. The analysis covers the historical period (2019-2024), the base year (2025), and the forecast period (2025-2033).
- Market Concentration: The global van tire market exhibits a moderately concentrated structure, with the top five players commanding approximately xx% of the market share in 2024.
- Innovation Catalysts: Advancements in tire materials, tread patterns, and manufacturing processes are driving significant innovation, leading to improved fuel efficiency, enhanced grip, and extended tire life.
- Regulatory Landscape: Stringent safety and environmental regulations are influencing tire design and manufacturing processes, pushing manufacturers to adopt sustainable practices.
- Substitute Products: Limited viable substitutes exist for van tires, reinforcing the market’s growth trajectory. Retreaded tires represent a significant portion of the substitute market, accounting for approximately xx million units in 2024.
- End-User Profiles: The primary end-users include logistics companies, delivery services, small businesses, and individual van owners. The increasing demand from e-commerce and the expansion of delivery networks are key drivers of market growth.
- M&A Activities: Significant M&A activities have been observed in the period of 2019-2024, totaling approximately $xx million in deal value. These transactions primarily aimed at expanding market reach, acquiring technological capabilities, and enhancing product portfolios.
Van Tires Industry Evolution
This section provides a comprehensive analysis of the van tire industry's evolution from 2019 to 2033. We dissect historical growth trajectories, highlighting technological advancements that have reshaped the market and the changing consumer preferences that are influencing product development and marketing strategies. Detailed analysis of growth rates, technological adoption, and consumer behavior shifts provides valuable insights into the industry's ongoing transformation. The global van tire market is predicted to experience a compound annual growth rate (CAGR) of xx% during the forecast period (2025-2033), reaching a market volume of xx million units by 2033. This growth is primarily fueled by the increasing demand from the burgeoning e-commerce sector and the expansion of logistics networks.
Leading Regions, Countries, or Segments in Van Tires
This segment pinpoints the dominant regions, countries, and market segments within the global van tire industry. A detailed examination of the leading market reveals the key factors that contribute to its dominance.
- Key Drivers of Dominance:
- Robust infrastructure development: Significant investments in infrastructure projects are propelling demand in the dominant region.
- Favorable government policies: Supportive regulatory frameworks and incentives for the transportation sector further enhance market growth.
- Strong economic growth: A robust economy contributes to increased vehicle ownership and transportation activities.
- Expanding logistics sector: Growth in e-commerce and other delivery services is driving the demand for reliable van tires.
The dominance of this region is further cemented by its established manufacturing base, robust distribution networks, and strong consumer preference for high-quality van tires.
Van Tires Product Innovations
This section highlights recent product innovations, focusing on advancements in materials, construction techniques, and performance characteristics. The development of fuel-efficient tires, enhanced tread designs for improved grip, and the incorporation of puncture-resistant materials represent key innovations driving market growth and addressing consumer needs for improved safety and durability. These advancements are resulting in extended tire life and reduced maintenance costs, thus enhancing the overall value proposition for end-users.
Propelling Factors for Van Tires Growth
The global van tire market is experiencing robust growth driven by a confluence of factors. The rise of e-commerce and the resulting surge in last-mile delivery services are significantly boosting demand. Technological advancements leading to fuel-efficient and longer-lasting tires are also major contributors. Furthermore, favorable government regulations supporting the transportation sector and ongoing infrastructure development projects worldwide are creating a supportive environment for market expansion.
Obstacles in the Van Tires Market
Despite positive growth prospects, the van tire market faces several challenges. Fluctuations in raw material prices, particularly natural rubber, pose a significant threat to profitability. Supply chain disruptions caused by geopolitical events and the impact of economic downturns on consumer spending represent further obstacles. Intense competition among established players also creates pressure on profit margins.
Future Opportunities in Van Tires
Future opportunities in the van tire market center around the adoption of advanced materials, sustainable manufacturing processes, and the development of intelligent tire technology. The expanding electric vehicle market also presents significant growth potential as van manufacturers adapt their fleets to utilize this technology. Further market expansion is expected in emerging economies with developing transportation and logistics sectors.
Major Players in the Van Tires Ecosystem
Key Developments in Van Tires Industry
- Jan 2023: Bridgestone launched a new line of fuel-efficient van tires.
- Mar 2022: MICHELIN announced a significant investment in a new tire manufacturing facility.
- Oct 2021: Goodyear and Continental formed a strategic partnership to develop sustainable tire materials. (Further developments to be added based on actual data)
Strategic Van Tires Market Forecast
The van tire market is poised for continued expansion driven by the factors outlined earlier. The increasing adoption of electric vehicles and the growth of the e-commerce sector will continue to fuel demand. Technological advancements will further enhance product performance, durability, and safety, bolstering market growth. The market is anticipated to maintain a significant CAGR throughout the forecast period, presenting substantial opportunities for existing players and new entrants alike.
Van Tires Segmentation
-
1. Application
- 1.1. Passenger Vehicles
- 1.2. Commercial Vehicles
-
2. Types
- 2.1. OEM Tire
- 2.2. Replacement Tire
Van Tires Segmentation By Geography
-
1. North America
- 1.1. United States
- 1.2. Canada
- 1.3. Mexico
-
2. South America
- 2.1. Brazil
- 2.2. Argentina
- 2.3. Rest of South America
-
3. Europe
- 3.1. United Kingdom
- 3.2. Germany
- 3.3. France
- 3.4. Italy
- 3.5. Spain
- 3.6. Russia
- 3.7. Benelux
- 3.8. Nordics
- 3.9. Rest of Europe
-
4. Middle East & Africa
- 4.1. Turkey
- 4.2. Israel
- 4.3. GCC
- 4.4. North Africa
- 4.5. South Africa
- 4.6. Rest of Middle East & Africa
-
5. Asia Pacific
- 5.1. China
- 5.2. India
- 5.3. Japan
- 5.4. South Korea
- 5.5. ASEAN
- 5.6. Oceania
- 5.7. Rest of Asia Pacific
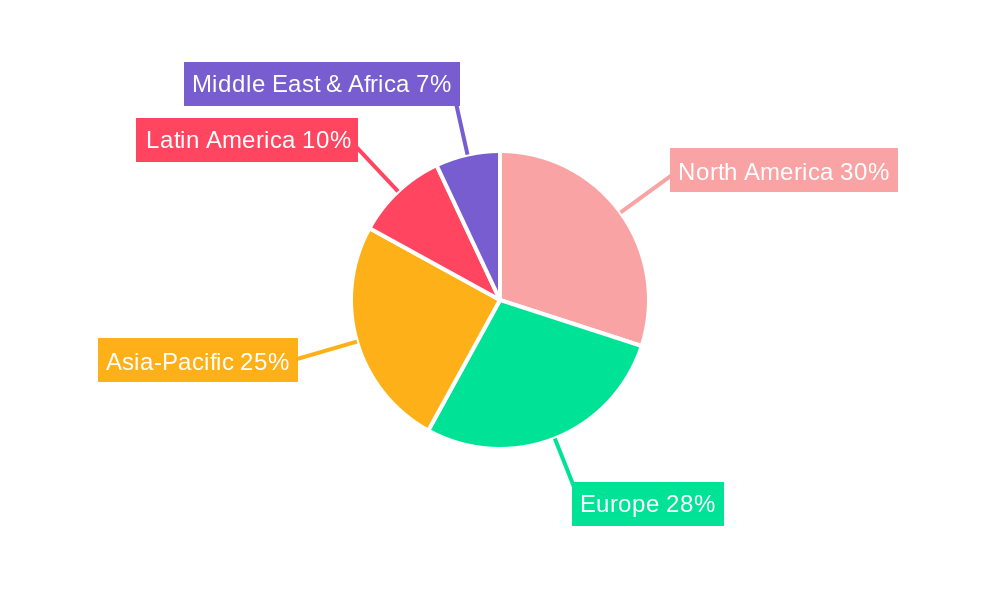
Van Tires Regional Market Share
Geographic Coverage of Van Tires
Van Tires REPORT HIGHLIGHTS
| Aspects | Details |
|---|---|
| Study Period | 2020-2034 |
| Base Year | 2025 |
| Estimated Year | 2026 |
| Forecast Period | 2026-2034 |
| Historical Period | 2020-2025 |
| Growth Rate | CAGR of 4.16% from 2020-2034 |
| Segmentation |
|
Table of Contents
- 1. Introduction
- 1.1. Research Scope
- 1.2. Market Segmentation
- 1.3. Research Methodology
- 1.4. Definitions and Assumptions
- 2. Executive Summary
- 2.1. Introduction
- 3. Market Dynamics
- 3.1. Introduction
- 3.2. Market Drivers
- 3.3. Market Restrains
- 3.4. Market Trends
- 4. Market Factor Analysis
- 4.1. Porters Five Forces
- 4.2. Supply/Value Chain
- 4.3. PESTEL analysis
- 4.4. Market Entropy
- 4.5. Patent/Trademark Analysis
- 5. Global Van Tires Analysis, Insights and Forecast, 2020-2032
- 5.1. Market Analysis, Insights and Forecast - by Application
- 5.1.1. Passenger Vehicles
- 5.1.2. Commercial Vehicles
- 5.2. Market Analysis, Insights and Forecast - by Types
- 5.2.1. OEM Tire
- 5.2.2. Replacement Tire
- 5.3. Market Analysis, Insights and Forecast - by Region
- 5.3.1. North America
- 5.3.2. South America
- 5.3.3. Europe
- 5.3.4. Middle East & Africa
- 5.3.5. Asia Pacific
- 5.1. Market Analysis, Insights and Forecast - by Application
- 6. North America Van Tires Analysis, Insights and Forecast, 2020-2032
- 6.1. Market Analysis, Insights and Forecast - by Application
- 6.1.1. Passenger Vehicles
- 6.1.2. Commercial Vehicles
- 6.2. Market Analysis, Insights and Forecast - by Types
- 6.2.1. OEM Tire
- 6.2.2. Replacement Tire
- 6.1. Market Analysis, Insights and Forecast - by Application
- 7. South America Van Tires Analysis, Insights and Forecast, 2020-2032
- 7.1. Market Analysis, Insights and Forecast - by Application
- 7.1.1. Passenger Vehicles
- 7.1.2. Commercial Vehicles
- 7.2. Market Analysis, Insights and Forecast - by Types
- 7.2.1. OEM Tire
- 7.2.2. Replacement Tire
- 7.1. Market Analysis, Insights and Forecast - by Application
- 8. Europe Van Tires Analysis, Insights and Forecast, 2020-2032
- 8.1. Market Analysis, Insights and Forecast - by Application
- 8.1.1. Passenger Vehicles
- 8.1.2. Commercial Vehicles
- 8.2. Market Analysis, Insights and Forecast - by Types
- 8.2.1. OEM Tire
- 8.2.2. Replacement Tire
- 8.1. Market Analysis, Insights and Forecast - by Application
- 9. Middle East & Africa Van Tires Analysis, Insights and Forecast, 2020-2032
- 9.1. Market Analysis, Insights and Forecast - by Application
- 9.1.1. Passenger Vehicles
- 9.1.2. Commercial Vehicles
- 9.2. Market Analysis, Insights and Forecast - by Types
- 9.2.1. OEM Tire
- 9.2.2. Replacement Tire
- 9.1. Market Analysis, Insights and Forecast - by Application
- 10. Asia Pacific Van Tires Analysis, Insights and Forecast, 2020-2032
- 10.1. Market Analysis, Insights and Forecast - by Application
- 10.1.1. Passenger Vehicles
- 10.1.2. Commercial Vehicles
- 10.2. Market Analysis, Insights and Forecast - by Types
- 10.2.1. OEM Tire
- 10.2.2. Replacement Tire
- 10.1. Market Analysis, Insights and Forecast - by Application
- 11. Competitive Analysis
- 11.1. Global Market Share Analysis 2025
- 11.2. Company Profiles
- 11.2.1 Bridgestone
- 11.2.1.1. Overview
- 11.2.1.2. Products
- 11.2.1.3. SWOT Analysis
- 11.2.1.4. Recent Developments
- 11.2.1.5. Financials (Based on Availability)
- 11.2.2 MICHELIN
- 11.2.2.1. Overview
- 11.2.2.2. Products
- 11.2.2.3. SWOT Analysis
- 11.2.2.4. Recent Developments
- 11.2.2.5. Financials (Based on Availability)
- 11.2.3 Goodyear
- 11.2.3.1. Overview
- 11.2.3.2. Products
- 11.2.3.3. SWOT Analysis
- 11.2.3.4. Recent Developments
- 11.2.3.5. Financials (Based on Availability)
- 11.2.4 Continental
- 11.2.4.1. Overview
- 11.2.4.2. Products
- 11.2.4.3. SWOT Analysis
- 11.2.4.4. Recent Developments
- 11.2.4.5. Financials (Based on Availability)
- 11.2.5 ZC Rubber
- 11.2.5.1. Overview
- 11.2.5.2. Products
- 11.2.5.3. SWOT Analysis
- 11.2.5.4. Recent Developments
- 11.2.5.5. Financials (Based on Availability)
- 11.2.6 Sumitomo Rubber
- 11.2.6.1. Overview
- 11.2.6.2. Products
- 11.2.6.3. SWOT Analysis
- 11.2.6.4. Recent Developments
- 11.2.6.5. Financials (Based on Availability)
- 11.2.7 Double Coin
- 11.2.7.1. Overview
- 11.2.7.2. Products
- 11.2.7.3. SWOT Analysis
- 11.2.7.4. Recent Developments
- 11.2.7.5. Financials (Based on Availability)
- 11.2.8 Pirelli
- 11.2.8.1. Overview
- 11.2.8.2. Products
- 11.2.8.3. SWOT Analysis
- 11.2.8.4. Recent Developments
- 11.2.8.5. Financials (Based on Availability)
- 11.2.9 Aeolus Tyre
- 11.2.9.1. Overview
- 11.2.9.2. Products
- 11.2.9.3. SWOT Analysis
- 11.2.9.4. Recent Developments
- 11.2.9.5. Financials (Based on Availability)
- 11.2.10 Sailun jinyu Group
- 11.2.10.1. Overview
- 11.2.10.2. Products
- 11.2.10.3. SWOT Analysis
- 11.2.10.4. Recent Developments
- 11.2.10.5. Financials (Based on Availability)
- 11.2.11 Cooper tire
- 11.2.11.1. Overview
- 11.2.11.2. Products
- 11.2.11.3. SWOT Analysis
- 11.2.11.4. Recent Developments
- 11.2.11.5. Financials (Based on Availability)
- 11.2.12 Hankook
- 11.2.12.1. Overview
- 11.2.12.2. Products
- 11.2.12.3. SWOT Analysis
- 11.2.12.4. Recent Developments
- 11.2.12.5. Financials (Based on Availability)
- 11.2.13 YOKOHAMA
- 11.2.13.1. Overview
- 11.2.13.2. Products
- 11.2.13.3. SWOT Analysis
- 11.2.13.4. Recent Developments
- 11.2.13.5. Financials (Based on Availability)
- 11.2.14 Giti Tire
- 11.2.14.1. Overview
- 11.2.14.2. Products
- 11.2.14.3. SWOT Analysis
- 11.2.14.4. Recent Developments
- 11.2.14.5. Financials (Based on Availability)
- 11.2.15 KUMHO TIRE
- 11.2.15.1. Overview
- 11.2.15.2. Products
- 11.2.15.3. SWOT Analysis
- 11.2.15.4. Recent Developments
- 11.2.15.5. Financials (Based on Availability)
- 11.2.16 Triangle Tire Group
- 11.2.16.1. Overview
- 11.2.16.2. Products
- 11.2.16.3. SWOT Analysis
- 11.2.16.4. Recent Developments
- 11.2.16.5. Financials (Based on Availability)
- 11.2.17 Cheng Shin Rubber
- 11.2.17.1. Overview
- 11.2.17.2. Products
- 11.2.17.3. SWOT Analysis
- 11.2.17.4. Recent Developments
- 11.2.17.5. Financials (Based on Availability)
- 11.2.18 Linglong Tire
- 11.2.18.1. Overview
- 11.2.18.2. Products
- 11.2.18.3. SWOT Analysis
- 11.2.18.4. Recent Developments
- 11.2.18.5. Financials (Based on Availability)
- 11.2.19 Toyo Tires
- 11.2.19.1. Overview
- 11.2.19.2. Products
- 11.2.19.3. SWOT Analysis
- 11.2.19.4. Recent Developments
- 11.2.19.5. Financials (Based on Availability)
- 11.2.20 Xingyuan group
- 11.2.20.1. Overview
- 11.2.20.2. Products
- 11.2.20.3. SWOT Analysis
- 11.2.20.4. Recent Developments
- 11.2.20.5. Financials (Based on Availability)
- 11.2.1 Bridgestone
List of Figures
- Figure 1: Global Van Tires Revenue Breakdown (undefined, %) by Region 2025 & 2033
- Figure 2: North America Van Tires Revenue (undefined), by Application 2025 & 2033
- Figure 3: North America Van Tires Revenue Share (%), by Application 2025 & 2033
- Figure 4: North America Van Tires Revenue (undefined), by Types 2025 & 2033
- Figure 5: North America Van Tires Revenue Share (%), by Types 2025 & 2033
- Figure 6: North America Van Tires Revenue (undefined), by Country 2025 & 2033
- Figure 7: North America Van Tires Revenue Share (%), by Country 2025 & 2033
- Figure 8: South America Van Tires Revenue (undefined), by Application 2025 & 2033
- Figure 9: South America Van Tires Revenue Share (%), by Application 2025 & 2033
- Figure 10: South America Van Tires Revenue (undefined), by Types 2025 & 2033
- Figure 11: South America Van Tires Revenue Share (%), by Types 2025 & 2033
- Figure 12: South America Van Tires Revenue (undefined), by Country 2025 & 2033
- Figure 13: South America Van Tires Revenue Share (%), by Country 2025 & 2033
- Figure 14: Europe Van Tires Revenue (undefined), by Application 2025 & 2033
- Figure 15: Europe Van Tires Revenue Share (%), by Application 2025 & 2033
- Figure 16: Europe Van Tires Revenue (undefined), by Types 2025 & 2033
- Figure 17: Europe Van Tires Revenue Share (%), by Types 2025 & 2033
- Figure 18: Europe Van Tires Revenue (undefined), by Country 2025 & 2033
- Figure 19: Europe Van Tires Revenue Share (%), by Country 2025 & 2033
- Figure 20: Middle East & Africa Van Tires Revenue (undefined), by Application 2025 & 2033
- Figure 21: Middle East & Africa Van Tires Revenue Share (%), by Application 2025 & 2033
- Figure 22: Middle East & Africa Van Tires Revenue (undefined), by Types 2025 & 2033
- Figure 23: Middle East & Africa Van Tires Revenue Share (%), by Types 2025 & 2033
- Figure 24: Middle East & Africa Van Tires Revenue (undefined), by Country 2025 & 2033
- Figure 25: Middle East & Africa Van Tires Revenue Share (%), by Country 2025 & 2033
- Figure 26: Asia Pacific Van Tires Revenue (undefined), by Application 2025 & 2033
- Figure 27: Asia Pacific Van Tires Revenue Share (%), by Application 2025 & 2033
- Figure 28: Asia Pacific Van Tires Revenue (undefined), by Types 2025 & 2033
- Figure 29: Asia Pacific Van Tires Revenue Share (%), by Types 2025 & 2033
- Figure 30: Asia Pacific Van Tires Revenue (undefined), by Country 2025 & 2033
- Figure 31: Asia Pacific Van Tires Revenue Share (%), by Country 2025 & 2033
List of Tables
- Table 1: Global Van Tires Revenue undefined Forecast, by Application 2020 & 2033
- Table 2: Global Van Tires Revenue undefined Forecast, by Types 2020 & 2033
- Table 3: Global Van Tires Revenue undefined Forecast, by Region 2020 & 2033
- Table 4: Global Van Tires Revenue undefined Forecast, by Application 2020 & 2033
- Table 5: Global Van Tires Revenue undefined Forecast, by Types 2020 & 2033
- Table 6: Global Van Tires Revenue undefined Forecast, by Country 2020 & 2033
- Table 7: United States Van Tires Revenue (undefined) Forecast, by Application 2020 & 2033
- Table 8: Canada Van Tires Revenue (undefined) Forecast, by Application 2020 & 2033
- Table 9: Mexico Van Tires Revenue (undefined) Forecast, by Application 2020 & 2033
- Table 10: Global Van Tires Revenue undefined Forecast, by Application 2020 & 2033
- Table 11: Global Van Tires Revenue undefined Forecast, by Types 2020 & 2033
- Table 12: Global Van Tires Revenue undefined Forecast, by Country 2020 & 2033
- Table 13: Brazil Van Tires Revenue (undefined) Forecast, by Application 2020 & 2033
- Table 14: Argentina Van Tires Revenue (undefined) Forecast, by Application 2020 & 2033
- Table 15: Rest of South America Van Tires Revenue (undefined) Forecast, by Application 2020 & 2033
- Table 16: Global Van Tires Revenue undefined Forecast, by Application 2020 & 2033
- Table 17: Global Van Tires Revenue undefined Forecast, by Types 2020 & 2033
- Table 18: Global Van Tires Revenue undefined Forecast, by Country 2020 & 2033
- Table 19: United Kingdom Van Tires Revenue (undefined) Forecast, by Application 2020 & 2033
- Table 20: Germany Van Tires Revenue (undefined) Forecast, by Application 2020 & 2033
- Table 21: France Van Tires Revenue (undefined) Forecast, by Application 2020 & 2033
- Table 22: Italy Van Tires Revenue (undefined) Forecast, by Application 2020 & 2033
- Table 23: Spain Van Tires Revenue (undefined) Forecast, by Application 2020 & 2033
- Table 24: Russia Van Tires Revenue (undefined) Forecast, by Application 2020 & 2033
- Table 25: Benelux Van Tires Revenue (undefined) Forecast, by Application 2020 & 2033
- Table 26: Nordics Van Tires Revenue (undefined) Forecast, by Application 2020 & 2033
- Table 27: Rest of Europe Van Tires Revenue (undefined) Forecast, by Application 2020 & 2033
- Table 28: Global Van Tires Revenue undefined Forecast, by Application 2020 & 2033
- Table 29: Global Van Tires Revenue undefined Forecast, by Types 2020 & 2033
- Table 30: Global Van Tires Revenue undefined Forecast, by Country 2020 & 2033
- Table 31: Turkey Van Tires Revenue (undefined) Forecast, by Application 2020 & 2033
- Table 32: Israel Van Tires Revenue (undefined) Forecast, by Application 2020 & 2033
- Table 33: GCC Van Tires Revenue (undefined) Forecast, by Application 2020 & 2033
- Table 34: North Africa Van Tires Revenue (undefined) Forecast, by Application 2020 & 2033
- Table 35: South Africa Van Tires Revenue (undefined) Forecast, by Application 2020 & 2033
- Table 36: Rest of Middle East & Africa Van Tires Revenue (undefined) Forecast, by Application 2020 & 2033
- Table 37: Global Van Tires Revenue undefined Forecast, by Application 2020 & 2033
- Table 38: Global Van Tires Revenue undefined Forecast, by Types 2020 & 2033
- Table 39: Global Van Tires Revenue undefined Forecast, by Country 2020 & 2033
- Table 40: China Van Tires Revenue (undefined) Forecast, by Application 2020 & 2033
- Table 41: India Van Tires Revenue (undefined) Forecast, by Application 2020 & 2033
- Table 42: Japan Van Tires Revenue (undefined) Forecast, by Application 2020 & 2033
- Table 43: South Korea Van Tires Revenue (undefined) Forecast, by Application 2020 & 2033
- Table 44: ASEAN Van Tires Revenue (undefined) Forecast, by Application 2020 & 2033
- Table 45: Oceania Van Tires Revenue (undefined) Forecast, by Application 2020 & 2033
- Table 46: Rest of Asia Pacific Van Tires Revenue (undefined) Forecast, by Application 2020 & 2033
Frequently Asked Questions
1. What is the projected Compound Annual Growth Rate (CAGR) of the Van Tires?
The projected CAGR is approximately 4.16%.
2. Which companies are prominent players in the Van Tires?
Key companies in the market include Bridgestone, MICHELIN, Goodyear, Continental, ZC Rubber, Sumitomo Rubber, Double Coin, Pirelli, Aeolus Tyre, Sailun jinyu Group, Cooper tire, Hankook, YOKOHAMA, Giti Tire, KUMHO TIRE, Triangle Tire Group, Cheng Shin Rubber, Linglong Tire, Toyo Tires, Xingyuan group.
3. What are the main segments of the Van Tires?
The market segments include Application, Types.
4. Can you provide details about the market size?
The market size is estimated to be USD XXX N/A as of 2022.
5. What are some drivers contributing to market growth?
N/A
6. What are the notable trends driving market growth?
N/A
7. Are there any restraints impacting market growth?
N/A
8. Can you provide examples of recent developments in the market?
N/A
9. What pricing options are available for accessing the report?
Pricing options include single-user, multi-user, and enterprise licenses priced at USD 4900.00, USD 7350.00, and USD 9800.00 respectively.
10. Is the market size provided in terms of value or volume?
The market size is provided in terms of value, measured in N/A.
11. Are there any specific market keywords associated with the report?
Yes, the market keyword associated with the report is "Van Tires," which aids in identifying and referencing the specific market segment covered.
12. How do I determine which pricing option suits my needs best?
The pricing options vary based on user requirements and access needs. Individual users may opt for single-user licenses, while businesses requiring broader access may choose multi-user or enterprise licenses for cost-effective access to the report.
13. Are there any additional resources or data provided in the Van Tires report?
While the report offers comprehensive insights, it's advisable to review the specific contents or supplementary materials provided to ascertain if additional resources or data are available.
14. How can I stay updated on further developments or reports in the Van Tires?
To stay informed about further developments, trends, and reports in the Van Tires, consider subscribing to industry newsletters, following relevant companies and organizations, or regularly checking reputable industry news sources and publications.
Methodology
Step 1 - Identification of Relevant Samples Size from Population Database


Step 2 - Approaches for Defining Global Market Size (Value, Volume* & Price*)

Note*: In applicable scenarios
Step 3 - Data Sources
Primary Research
- Web Analytics
- Survey Reports
- Research Institute
- Latest Research Reports
- Opinion Leaders
Secondary Research
- Annual Reports
- White Paper
- Latest Press Release
- Industry Association
- Paid Database
- Investor Presentations

Step 4 - Data Triangulation
Involves using different sources of information in order to increase the validity of a study
These sources are likely to be stakeholders in a program - participants, other researchers, program staff, other community members, and so on.
Then we put all data in single framework & apply various statistical tools to find out the dynamic on the market.
During the analysis stage, feedback from the stakeholder groups would be compared to determine areas of agreement as well as areas of divergence