

Key Insights
The US Advanced Composites Market is poised for significant expansion, projected to reach $52.4 billion by 2033, with a robust Compound Annual Growth Rate (CAGR) of 8.9% from a 2025 base year. This growth is propelled by escalating demand across key sectors such as automotive, aerospace, and wind energy. In automotive, the imperative for lightweighting to enhance fuel efficiency is a primary driver. The aerospace industry is increasingly integrating composites for superior performance and reduced structural weight. Furthermore, the expanding renewable energy landscape, particularly wind power, relies heavily on advanced composites for turbine blade construction. Continuous innovation in material science, including the development of advanced fibers like carbon fiber and enhanced resin systems, is broadening application possibilities and fueling market growth.
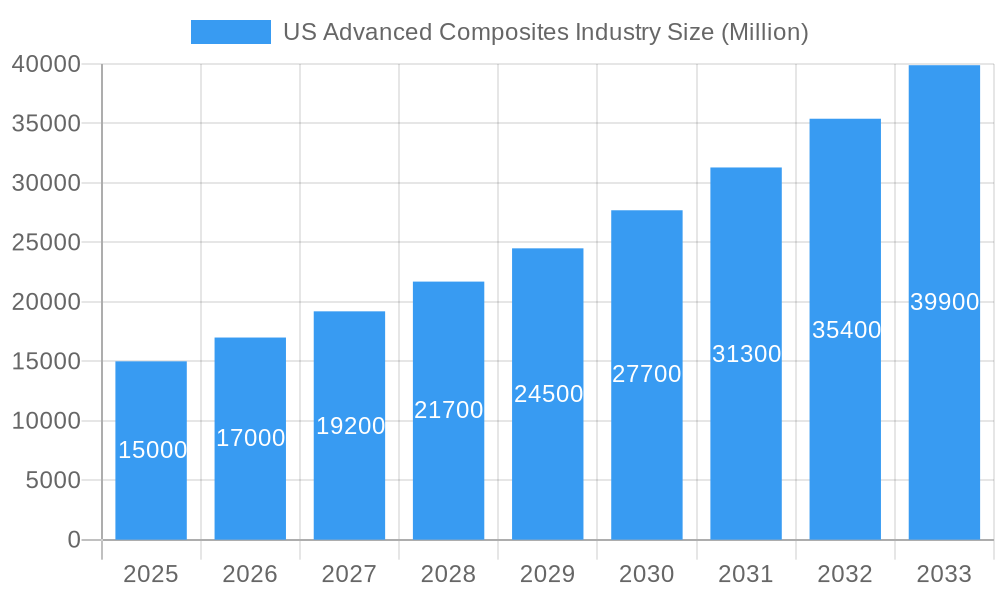
US Advanced Composites Industry Market Size (In Billion)
The market is segmented by production method, with resin transfer molding and vacuum infusion processing gaining prominence due to their efficiency and precision. Material composition plays a critical role, with thermoset polymers leading due to their exceptional strength-to-weight ratio, while thermoplastics are emerging as a viable option owing to their recyclability. Key applications span structural assemblies and powertrain components in the automotive sector, alongside critical aerospace components. Leading companies are strategically investing in research, development, and production capacity expansion to capture market share. Regional markets, notably those with established automotive and aerospace manufacturing hubs, are expected to be strong performers, though growth is anticipated nationwide.
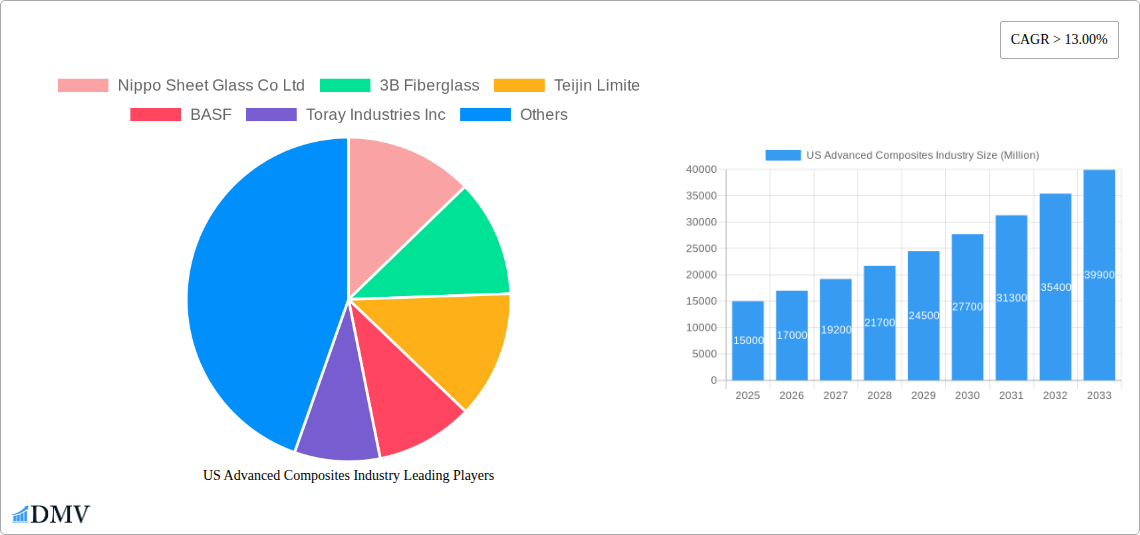
US Advanced Composites Industry Company Market Share
US Advanced Composites Industry Market Report: 2019-2033
This comprehensive report delivers an in-depth analysis of the US Advanced Composites Industry, providing crucial insights for stakeholders seeking to navigate this dynamic market. The study covers the period 2019-2033, with a focus on the 2025-2033 forecast period and a base year of 2025. Expect detailed market sizing, segmentation, and future projections valued in Millions, covering key production types, material types, and application areas. The report analyzes market trends, competitive landscapes, and growth drivers, identifying significant opportunities and potential challenges.
US Advanced Composites Industry Market Composition & Trends
This section meticulously examines the competitive landscape of the US advanced composites market, detailing market concentration, innovation drivers, regulatory frameworks, substitute product analysis, end-user profiles, and mergers & acquisitions (M&A) activities. We analyze the market share distribution among key players, including Nippo Sheet Glass Co Ltd, 3B Fiberglass, Teijin Limited, BASF, Toray Industries Inc, General Motors Company, Base Group, Cytec Industries Inc, BMW, Delphi Auto, and SGL Group. The report quantifies the impact of M&A activities, estimating deal values at approximately $XX Million over the study period. The analysis also considers the influence of regulatory changes, such as those impacting material safety and environmental regulations, on market dynamics and innovation. We detail the prevalence of substitute materials and their impact on market share, considering factors like cost, performance, and environmental impact. End-user segmentation highlights the relative importance of automotive, aerospace, and other key sectors.
- Market Concentration: The market is characterized by [Describe market concentration - e.g., a moderately concentrated market with a few dominant players].
- Innovation Catalysts: Government funding for R&D in lightweight materials and advancements in manufacturing technologies are key drivers.
- Regulatory Landscape: Environmental regulations (e.g., regarding VOC emissions) and safety standards (e.g., for automotive applications) significantly shape market development.
- Substitute Products: Metals and other traditional materials pose competitive pressure, with their market share analyzed in detail.
- End-User Profiles: Automotive, aerospace, and wind energy sectors represent the major end-use segments. Their relative contributions to market demand are assessed.
- M&A Activity: The total value of M&A transactions within the US advanced composites industry between 2019 and 2024 is estimated at approximately $XX Million. Key acquisitions and their impacts are highlighted.
US Advanced Composites Industry Industry Evolution
This section provides a comprehensive overview of the evolution of the US advanced composites industry, tracing its growth trajectory, technological advancements, and evolving consumer preferences from 2019 to 2033. We detail the market's compound annual growth rate (CAGR) during the historical period (2019-2024) and project the CAGR for the forecast period (2025-2033). Technological advancements, such as the development of novel materials (e.g., high-strength carbon fiber) and improved manufacturing processes (e.g., automated fiber placement), are analyzed for their impact on market growth and product performance. The analysis considers shifts in consumer demand towards lightweight, high-strength materials driven by factors such as fuel efficiency standards in automotive and increased performance requirements in aerospace. Specific data points including adoption rates of new technologies and changes in material usage are presented to support our analysis. The evolving regulatory landscape, including environmental concerns and safety standards, also plays a significant role shaping this evolution.
Leading Regions, Countries, or Segments in US Advanced Composites Industry
This section identifies the dominant regions, countries, or segments within the US advanced composites industry across Production Type, Material Type, and Application Type. We analyze the factors driving the dominance of specific segments, providing detailed insights for strategic decision-making.
Production Type: The report evaluates the market share and growth prospects of Hand Layup, Resin Transfer Molding, Vacuum Infusion Processing, Injection Molding, and Compression Molding. [Dominant Production Type] is currently the leading segment due to [Reasons].
Material Type: We analyze the market share and growth potential of Thermoset Polymer, Thermoplastic Polymer, Carbon Fiber, Glass Fiber, and Other materials. The dominance of [Dominant Material Type] is attributed to [Reasons].
Application Type: The analysis covers Structural Assembly, Power Train Components, Interior, Exterior, and Other applications. [Dominant Application Type] holds the largest market share due to [Reasons].
Key Drivers (across all segments):
- Significant investments in R&D and manufacturing capacity.
- Favorable government policies and regulations supporting the adoption of advanced composites.
US Advanced Composites Industry Product Innovations
Recent innovations in advanced composites encompass the development of lighter, stronger, and more cost-effective materials. New manufacturing processes are enabling high-volume production of complex composite parts, leading to increased adoption in diverse applications. For example, the introduction of [specific example of a new material or manufacturing process] has significantly improved the performance of composite components in [specific application]. This has resulted in improved fuel efficiency in automotive applications and enhanced structural integrity in aerospace components. These advancements also offer unique selling propositions such as increased durability, reduced weight, and improved design flexibility.
Propelling Factors for US Advanced Composites Industry Growth
Several factors drive the growth of the US advanced composites industry. Technological advancements, such as the development of high-performance fibers and improved manufacturing processes, are significantly reducing production costs and improving product quality. Furthermore, stringent fuel efficiency standards in the automotive sector are driving increased demand for lightweight composite materials. Government initiatives and incentives promoting the use of sustainable and high-performance materials are further contributing to market growth. The growing aerospace and renewable energy sectors also represent significant growth opportunities.
Obstacles in the US Advanced Composites Industry Market
Despite its growth potential, the US advanced composites market faces certain challenges. High material costs and complex manufacturing processes can increase production costs. Supply chain disruptions can also impact production timelines and increase material costs. Furthermore, intense competition from established players and the emergence of new entrants poses significant competitive pressure. Regulatory hurdles and stringent environmental regulations may add to the overall cost of production. These factors collectively impact the overall market growth and profitability. Estimates suggest that supply chain disruptions alone have caused a [quantifiable impact, e.g., X% reduction in production] in the recent past.
Future Opportunities in US Advanced Composites Industry
The US advanced composites industry presents significant future opportunities. The rising demand for lightweight materials in automotive and aerospace applications will drive growth. Advances in nanotechnology and bio-based composites are likely to lead to the development of novel materials with enhanced properties. The expansion of the renewable energy sector presents new opportunities for the use of composite materials in wind turbine blades and other applications. Furthermore, exploring new applications in construction, infrastructure, and consumer goods can unlock further growth potential.
Major Players in the US Advanced Composites Industry Ecosystem
- Nippo Sheet Glass Co Ltd
- 3B Fiberglass
- Teijin Limited
- BASF
- Toray Industries Inc
- General Motors Company
- Base Group
- Cytec Industries Inc
- BMW
- Delphi Auto
- SGL Group
Key Developments in US Advanced Composites Industry Industry
- 2023-Q3: Launch of a new high-strength carbon fiber by Toray Industries Inc, expanding applications in aerospace.
- 2022-Q4: Acquisition of [Company Name] by [Acquiring Company], consolidating market share in the automotive sector.
- 2021-Q2: Introduction of a novel manufacturing process by [Company Name], reducing production costs by [Percentage].
- [Add more bullet points with similar structure – year/quarter, development, and impact]
Strategic US Advanced Composites Industry Market Forecast
The US advanced composites market is poised for robust growth over the forecast period (2025-2033), driven by technological innovation, increasing demand from key sectors, and supportive government policies. The market is projected to reach $XX Million by 2033, representing a significant expansion compared to the 2025 market size. Continuous advancements in material properties and manufacturing processes, along with the exploration of new applications, will fuel further market expansion. The automotive and aerospace sectors are expected to remain key drivers, along with the rising adoption of composites in the renewable energy sector. The anticipated growth trajectory suggests a considerable investment opportunity for stakeholders.
US Advanced Composites Industry Segmentation
-
1. Productino Type
- 1.1. Hand Layup
- 1.2. Resin Transfer Molding
- 1.3. Vacuum Infusion Processing
- 1.4. Injection Molding
- 1.5. Compression Molding
-
2. Material Type
- 2.1. Thermoset Polymer
- 2.2. Thermoplastic Polymer
- 2.3. Carbon Fiber
- 2.4. Glass Fiber
- 2.5. Others
-
3. Application Type
- 3.1. Structural Assembly
- 3.2. Power Train Components
- 3.3. Interior
- 3.4. Exterior
- 3.5. Others
US Advanced Composites Industry Segmentation By Geography
-
1. North America
- 1.1. United States
- 1.2. Canada
- 1.3. Mexico
-
2. South America
- 2.1. Brazil
- 2.2. Argentina
- 2.3. Rest of South America
-
3. Europe
- 3.1. United Kingdom
- 3.2. Germany
- 3.3. France
- 3.4. Italy
- 3.5. Spain
- 3.6. Russia
- 3.7. Benelux
- 3.8. Nordics
- 3.9. Rest of Europe
-
4. Middle East & Africa
- 4.1. Turkey
- 4.2. Israel
- 4.3. GCC
- 4.4. North Africa
- 4.5. South Africa
- 4.6. Rest of Middle East & Africa
-
5. Asia Pacific
- 5.1. China
- 5.2. India
- 5.3. Japan
- 5.4. South Korea
- 5.5. ASEAN
- 5.6. Oceania
- 5.7. Rest of Asia Pacific
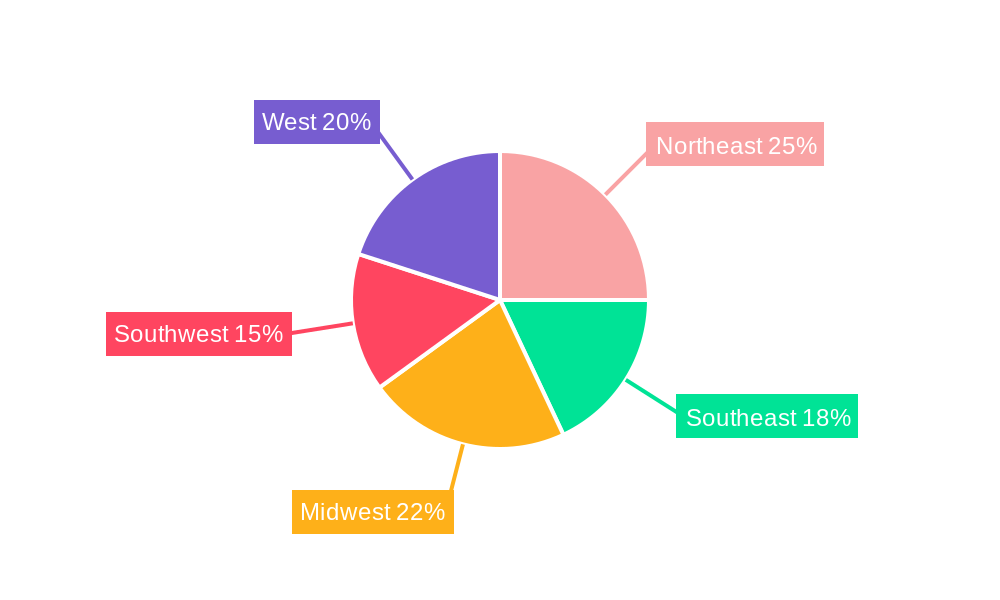
US Advanced Composites Industry Regional Market Share
Geographic Coverage of US Advanced Composites Industry
US Advanced Composites Industry REPORT HIGHLIGHTS
| Aspects | Details |
|---|---|
| Study Period | 2020-2034 |
| Base Year | 2025 |
| Estimated Year | 2026 |
| Forecast Period | 2026-2034 |
| Historical Period | 2020-2025 |
| Growth Rate | CAGR of 8.9% from 2020-2034 |
| Segmentation |
|
Table of Contents
- 1. Introduction
- 1.1. Research Scope
- 1.2. Market Segmentation
- 1.3. Research Objective
- 1.4. Definitions and Assumptions
- 2. Executive Summary
- 2.1. Market Snapshot
- 3. Market Dynamics
- 3.1. Market Drivers
- 3.2. Market Restrains
- 3.3. Market Trends
- 3.4. Market Opportunities
- 4. Market Factor Analysis
- 4.1. Porters Five Forces
- 4.1.1. Bargaining Power of Suppliers
- 4.1.2. Bargaining Power of Buyers
- 4.1.3. Threat of New Entrants
- 4.1.4. Threat of Substitutes
- 4.1.5. Competitive Rivalry
- 4.2. PESTEL analysis
- 4.3. BCG Analysis
- 4.3.1. Stars (High Growth, High Market Share)
- 4.3.2. Cash Cows (Low Growth, High Market Share)
- 4.3.3. Question Mark (High Growth, Low Market Share)
- 4.3.4. Dogs (Low Growth, Low Market Share)
- 4.4. Ansoff Matrix Analysis
- 4.5. Supply Chain Analysis
- 4.6. Regulatory Landscape
- 4.7. Current Market Potential and Opportunity Assessment (TAM–SAM–SOM Framework)
- 4.8. DMV Analyst Note
- 4.1. Porters Five Forces
- 5. Market Analysis, Insights and Forecast 2021-2033
- 5.1. Market Analysis, Insights and Forecast - by Productino Type
- 5.1.1. Hand Layup
- 5.1.2. Resin Transfer Molding
- 5.1.3. Vacuum Infusion Processing
- 5.1.4. Injection Molding
- 5.1.5. Compression Molding
- 5.2. Market Analysis, Insights and Forecast - by Material Type
- 5.2.1. Thermoset Polymer
- 5.2.2. Thermoplastic Polymer
- 5.2.3. Carbon Fiber
- 5.2.4. Glass Fiber
- 5.2.5. Others
- 5.3. Market Analysis, Insights and Forecast - by Application Type
- 5.3.1. Structural Assembly
- 5.3.2. Power Train Components
- 5.3.3. Interior
- 5.3.4. Exterior
- 5.3.5. Others
- 5.4. Market Analysis, Insights and Forecast - by Region
- 5.4.1. North America
- 5.4.2. South America
- 5.4.3. Europe
- 5.4.4. Middle East & Africa
- 5.4.5. Asia Pacific
- 5.1. Market Analysis, Insights and Forecast - by Productino Type
- 6. Global US Advanced Composites Industry Analysis, Insights and Forecast, 2021-2033
- 6.1. Market Analysis, Insights and Forecast - by Productino Type
- 6.1.1. Hand Layup
- 6.1.2. Resin Transfer Molding
- 6.1.3. Vacuum Infusion Processing
- 6.1.4. Injection Molding
- 6.1.5. Compression Molding
- 6.2. Market Analysis, Insights and Forecast - by Material Type
- 6.2.1. Thermoset Polymer
- 6.2.2. Thermoplastic Polymer
- 6.2.3. Carbon Fiber
- 6.2.4. Glass Fiber
- 6.2.5. Others
- 6.3. Market Analysis, Insights and Forecast - by Application Type
- 6.3.1. Structural Assembly
- 6.3.2. Power Train Components
- 6.3.3. Interior
- 6.3.4. Exterior
- 6.3.5. Others
- 6.1. Market Analysis, Insights and Forecast - by Productino Type
- 7. North America US Advanced Composites Industry Analysis, Insights and Forecast, 2020-2032
- 7.1. Market Analysis, Insights and Forecast - by Productino Type
- 7.1.1. Hand Layup
- 7.1.2. Resin Transfer Molding
- 7.1.3. Vacuum Infusion Processing
- 7.1.4. Injection Molding
- 7.1.5. Compression Molding
- 7.2. Market Analysis, Insights and Forecast - by Material Type
- 7.2.1. Thermoset Polymer
- 7.2.2. Thermoplastic Polymer
- 7.2.3. Carbon Fiber
- 7.2.4. Glass Fiber
- 7.2.5. Others
- 7.3. Market Analysis, Insights and Forecast - by Application Type
- 7.3.1. Structural Assembly
- 7.3.2. Power Train Components
- 7.3.3. Interior
- 7.3.4. Exterior
- 7.3.5. Others
- 7.1. Market Analysis, Insights and Forecast - by Productino Type
- 8. South America US Advanced Composites Industry Analysis, Insights and Forecast, 2020-2032
- 8.1. Market Analysis, Insights and Forecast - by Productino Type
- 8.1.1. Hand Layup
- 8.1.2. Resin Transfer Molding
- 8.1.3. Vacuum Infusion Processing
- 8.1.4. Injection Molding
- 8.1.5. Compression Molding
- 8.2. Market Analysis, Insights and Forecast - by Material Type
- 8.2.1. Thermoset Polymer
- 8.2.2. Thermoplastic Polymer
- 8.2.3. Carbon Fiber
- 8.2.4. Glass Fiber
- 8.2.5. Others
- 8.3. Market Analysis, Insights and Forecast - by Application Type
- 8.3.1. Structural Assembly
- 8.3.2. Power Train Components
- 8.3.3. Interior
- 8.3.4. Exterior
- 8.3.5. Others
- 8.1. Market Analysis, Insights and Forecast - by Productino Type
- 9. Europe US Advanced Composites Industry Analysis, Insights and Forecast, 2020-2032
- 9.1. Market Analysis, Insights and Forecast - by Productino Type
- 9.1.1. Hand Layup
- 9.1.2. Resin Transfer Molding
- 9.1.3. Vacuum Infusion Processing
- 9.1.4. Injection Molding
- 9.1.5. Compression Molding
- 9.2. Market Analysis, Insights and Forecast - by Material Type
- 9.2.1. Thermoset Polymer
- 9.2.2. Thermoplastic Polymer
- 9.2.3. Carbon Fiber
- 9.2.4. Glass Fiber
- 9.2.5. Others
- 9.3. Market Analysis, Insights and Forecast - by Application Type
- 9.3.1. Structural Assembly
- 9.3.2. Power Train Components
- 9.3.3. Interior
- 9.3.4. Exterior
- 9.3.5. Others
- 9.1. Market Analysis, Insights and Forecast - by Productino Type
- 10. Middle East & Africa US Advanced Composites Industry Analysis, Insights and Forecast, 2020-2032
- 10.1. Market Analysis, Insights and Forecast - by Productino Type
- 10.1.1. Hand Layup
- 10.1.2. Resin Transfer Molding
- 10.1.3. Vacuum Infusion Processing
- 10.1.4. Injection Molding
- 10.1.5. Compression Molding
- 10.2. Market Analysis, Insights and Forecast - by Material Type
- 10.2.1. Thermoset Polymer
- 10.2.2. Thermoplastic Polymer
- 10.2.3. Carbon Fiber
- 10.2.4. Glass Fiber
- 10.2.5. Others
- 10.3. Market Analysis, Insights and Forecast - by Application Type
- 10.3.1. Structural Assembly
- 10.3.2. Power Train Components
- 10.3.3. Interior
- 10.3.4. Exterior
- 10.3.5. Others
- 10.1. Market Analysis, Insights and Forecast - by Productino Type
- 11. Asia Pacific US Advanced Composites Industry Analysis, Insights and Forecast, 2020-2032
- 11.1. Market Analysis, Insights and Forecast - by Productino Type
- 11.1.1. Hand Layup
- 11.1.2. Resin Transfer Molding
- 11.1.3. Vacuum Infusion Processing
- 11.1.4. Injection Molding
- 11.1.5. Compression Molding
- 11.2. Market Analysis, Insights and Forecast - by Material Type
- 11.2.1. Thermoset Polymer
- 11.2.2. Thermoplastic Polymer
- 11.2.3. Carbon Fiber
- 11.2.4. Glass Fiber
- 11.2.5. Others
- 11.3. Market Analysis, Insights and Forecast - by Application Type
- 11.3.1. Structural Assembly
- 11.3.2. Power Train Components
- 11.3.3. Interior
- 11.3.4. Exterior
- 11.3.5. Others
- 11.1. Market Analysis, Insights and Forecast - by Productino Type
- 12. Competitive Analysis
- 12.1. Company Profiles
- 12.1.1 Nippo Sheet Glass Co Ltd
- 12.1.1.1. Company Overview
- 12.1.1.2. Products
- 12.1.1.3. Company Financials
- 12.1.1.4. SWOT Analysis
- 12.1.2 3B Fiberglass
- 12.1.2.1. Company Overview
- 12.1.2.2. Products
- 12.1.2.3. Company Financials
- 12.1.2.4. SWOT Analysis
- 12.1.3 Teijin Limite
- 12.1.3.1. Company Overview
- 12.1.3.2. Products
- 12.1.3.3. Company Financials
- 12.1.3.4. SWOT Analysis
- 12.1.4 BASF
- 12.1.4.1. Company Overview
- 12.1.4.2. Products
- 12.1.4.3. Company Financials
- 12.1.4.4. SWOT Analysis
- 12.1.5 Toray Industries Inc
- 12.1.5.1. Company Overview
- 12.1.5.2. Products
- 12.1.5.3. Company Financials
- 12.1.5.4. SWOT Analysis
- 12.1.6 General Motors Company
- 12.1.6.1. Company Overview
- 12.1.6.2. Products
- 12.1.6.3. Company Financials
- 12.1.6.4. SWOT Analysis
- 12.1.7 Base Group
- 12.1.7.1. Company Overview
- 12.1.7.2. Products
- 12.1.7.3. Company Financials
- 12.1.7.4. SWOT Analysis
- 12.1.8 Cytec Industries Inc
- 12.1.8.1. Company Overview
- 12.1.8.2. Products
- 12.1.8.3. Company Financials
- 12.1.8.4. SWOT Analysis
- 12.1.9 BMW
- 12.1.9.1. Company Overview
- 12.1.9.2. Products
- 12.1.9.3. Company Financials
- 12.1.9.4. SWOT Analysis
- 12.1.10 Delphi Auto
- 12.1.10.1. Company Overview
- 12.1.10.2. Products
- 12.1.10.3. Company Financials
- 12.1.10.4. SWOT Analysis
- 12.1.11 SGL Group
- 12.1.11.1. Company Overview
- 12.1.11.2. Products
- 12.1.11.3. Company Financials
- 12.1.11.4. SWOT Analysis
- 12.1.1 Nippo Sheet Glass Co Ltd
- 12.2. Market Entropy
- 12.2.1 Company's Key Areas Served
- 12.2.2 Recent Developments
- 12.3. Company Market Share Analysis 2025
- 12.3.1 Top 5 Companies Market Share Analysis
- 12.3.2 Top 3 Companies Market Share Analysis
- 12.4. List of Potential Customers
- 13. Research Methodology
List of Figures
- Figure 1: Global US Advanced Composites Industry Revenue Breakdown (billion, %) by Region 2025 & 2033
- Figure 2: North America US Advanced Composites Industry Revenue (billion), by Productino Type 2025 & 2033
- Figure 3: North America US Advanced Composites Industry Revenue Share (%), by Productino Type 2025 & 2033
- Figure 4: North America US Advanced Composites Industry Revenue (billion), by Material Type 2025 & 2033
- Figure 5: North America US Advanced Composites Industry Revenue Share (%), by Material Type 2025 & 2033
- Figure 6: North America US Advanced Composites Industry Revenue (billion), by Application Type 2025 & 2033
- Figure 7: North America US Advanced Composites Industry Revenue Share (%), by Application Type 2025 & 2033
- Figure 8: North America US Advanced Composites Industry Revenue (billion), by Country 2025 & 2033
- Figure 9: North America US Advanced Composites Industry Revenue Share (%), by Country 2025 & 2033
- Figure 10: South America US Advanced Composites Industry Revenue (billion), by Productino Type 2025 & 2033
- Figure 11: South America US Advanced Composites Industry Revenue Share (%), by Productino Type 2025 & 2033
- Figure 12: South America US Advanced Composites Industry Revenue (billion), by Material Type 2025 & 2033
- Figure 13: South America US Advanced Composites Industry Revenue Share (%), by Material Type 2025 & 2033
- Figure 14: South America US Advanced Composites Industry Revenue (billion), by Application Type 2025 & 2033
- Figure 15: South America US Advanced Composites Industry Revenue Share (%), by Application Type 2025 & 2033
- Figure 16: South America US Advanced Composites Industry Revenue (billion), by Country 2025 & 2033
- Figure 17: South America US Advanced Composites Industry Revenue Share (%), by Country 2025 & 2033
- Figure 18: Europe US Advanced Composites Industry Revenue (billion), by Productino Type 2025 & 2033
- Figure 19: Europe US Advanced Composites Industry Revenue Share (%), by Productino Type 2025 & 2033
- Figure 20: Europe US Advanced Composites Industry Revenue (billion), by Material Type 2025 & 2033
- Figure 21: Europe US Advanced Composites Industry Revenue Share (%), by Material Type 2025 & 2033
- Figure 22: Europe US Advanced Composites Industry Revenue (billion), by Application Type 2025 & 2033
- Figure 23: Europe US Advanced Composites Industry Revenue Share (%), by Application Type 2025 & 2033
- Figure 24: Europe US Advanced Composites Industry Revenue (billion), by Country 2025 & 2033
- Figure 25: Europe US Advanced Composites Industry Revenue Share (%), by Country 2025 & 2033
- Figure 26: Middle East & Africa US Advanced Composites Industry Revenue (billion), by Productino Type 2025 & 2033
- Figure 27: Middle East & Africa US Advanced Composites Industry Revenue Share (%), by Productino Type 2025 & 2033
- Figure 28: Middle East & Africa US Advanced Composites Industry Revenue (billion), by Material Type 2025 & 2033
- Figure 29: Middle East & Africa US Advanced Composites Industry Revenue Share (%), by Material Type 2025 & 2033
- Figure 30: Middle East & Africa US Advanced Composites Industry Revenue (billion), by Application Type 2025 & 2033
- Figure 31: Middle East & Africa US Advanced Composites Industry Revenue Share (%), by Application Type 2025 & 2033
- Figure 32: Middle East & Africa US Advanced Composites Industry Revenue (billion), by Country 2025 & 2033
- Figure 33: Middle East & Africa US Advanced Composites Industry Revenue Share (%), by Country 2025 & 2033
- Figure 34: Asia Pacific US Advanced Composites Industry Revenue (billion), by Productino Type 2025 & 2033
- Figure 35: Asia Pacific US Advanced Composites Industry Revenue Share (%), by Productino Type 2025 & 2033
- Figure 36: Asia Pacific US Advanced Composites Industry Revenue (billion), by Material Type 2025 & 2033
- Figure 37: Asia Pacific US Advanced Composites Industry Revenue Share (%), by Material Type 2025 & 2033
- Figure 38: Asia Pacific US Advanced Composites Industry Revenue (billion), by Application Type 2025 & 2033
- Figure 39: Asia Pacific US Advanced Composites Industry Revenue Share (%), by Application Type 2025 & 2033
- Figure 40: Asia Pacific US Advanced Composites Industry Revenue (billion), by Country 2025 & 2033
- Figure 41: Asia Pacific US Advanced Composites Industry Revenue Share (%), by Country 2025 & 2033
List of Tables
- Table 1: Global US Advanced Composites Industry Revenue billion Forecast, by Productino Type 2020 & 2033
- Table 2: Global US Advanced Composites Industry Revenue billion Forecast, by Material Type 2020 & 2033
- Table 3: Global US Advanced Composites Industry Revenue billion Forecast, by Application Type 2020 & 2033
- Table 4: Global US Advanced Composites Industry Revenue billion Forecast, by Region 2020 & 2033
- Table 5: Global US Advanced Composites Industry Revenue billion Forecast, by Productino Type 2020 & 2033
- Table 6: Global US Advanced Composites Industry Revenue billion Forecast, by Material Type 2020 & 2033
- Table 7: Global US Advanced Composites Industry Revenue billion Forecast, by Application Type 2020 & 2033
- Table 8: Global US Advanced Composites Industry Revenue billion Forecast, by Country 2020 & 2033
- Table 9: United States US Advanced Composites Industry Revenue (billion) Forecast, by Application 2020 & 2033
- Table 10: Canada US Advanced Composites Industry Revenue (billion) Forecast, by Application 2020 & 2033
- Table 11: Mexico US Advanced Composites Industry Revenue (billion) Forecast, by Application 2020 & 2033
- Table 12: Global US Advanced Composites Industry Revenue billion Forecast, by Productino Type 2020 & 2033
- Table 13: Global US Advanced Composites Industry Revenue billion Forecast, by Material Type 2020 & 2033
- Table 14: Global US Advanced Composites Industry Revenue billion Forecast, by Application Type 2020 & 2033
- Table 15: Global US Advanced Composites Industry Revenue billion Forecast, by Country 2020 & 2033
- Table 16: Brazil US Advanced Composites Industry Revenue (billion) Forecast, by Application 2020 & 2033
- Table 17: Argentina US Advanced Composites Industry Revenue (billion) Forecast, by Application 2020 & 2033
- Table 18: Rest of South America US Advanced Composites Industry Revenue (billion) Forecast, by Application 2020 & 2033
- Table 19: Global US Advanced Composites Industry Revenue billion Forecast, by Productino Type 2020 & 2033
- Table 20: Global US Advanced Composites Industry Revenue billion Forecast, by Material Type 2020 & 2033
- Table 21: Global US Advanced Composites Industry Revenue billion Forecast, by Application Type 2020 & 2033
- Table 22: Global US Advanced Composites Industry Revenue billion Forecast, by Country 2020 & 2033
- Table 23: United Kingdom US Advanced Composites Industry Revenue (billion) Forecast, by Application 2020 & 2033
- Table 24: Germany US Advanced Composites Industry Revenue (billion) Forecast, by Application 2020 & 2033
- Table 25: France US Advanced Composites Industry Revenue (billion) Forecast, by Application 2020 & 2033
- Table 26: Italy US Advanced Composites Industry Revenue (billion) Forecast, by Application 2020 & 2033
- Table 27: Spain US Advanced Composites Industry Revenue (billion) Forecast, by Application 2020 & 2033
- Table 28: Russia US Advanced Composites Industry Revenue (billion) Forecast, by Application 2020 & 2033
- Table 29: Benelux US Advanced Composites Industry Revenue (billion) Forecast, by Application 2020 & 2033
- Table 30: Nordics US Advanced Composites Industry Revenue (billion) Forecast, by Application 2020 & 2033
- Table 31: Rest of Europe US Advanced Composites Industry Revenue (billion) Forecast, by Application 2020 & 2033
- Table 32: Global US Advanced Composites Industry Revenue billion Forecast, by Productino Type 2020 & 2033
- Table 33: Global US Advanced Composites Industry Revenue billion Forecast, by Material Type 2020 & 2033
- Table 34: Global US Advanced Composites Industry Revenue billion Forecast, by Application Type 2020 & 2033
- Table 35: Global US Advanced Composites Industry Revenue billion Forecast, by Country 2020 & 2033
- Table 36: Turkey US Advanced Composites Industry Revenue (billion) Forecast, by Application 2020 & 2033
- Table 37: Israel US Advanced Composites Industry Revenue (billion) Forecast, by Application 2020 & 2033
- Table 38: GCC US Advanced Composites Industry Revenue (billion) Forecast, by Application 2020 & 2033
- Table 39: North Africa US Advanced Composites Industry Revenue (billion) Forecast, by Application 2020 & 2033
- Table 40: South Africa US Advanced Composites Industry Revenue (billion) Forecast, by Application 2020 & 2033
- Table 41: Rest of Middle East & Africa US Advanced Composites Industry Revenue (billion) Forecast, by Application 2020 & 2033
- Table 42: Global US Advanced Composites Industry Revenue billion Forecast, by Productino Type 2020 & 2033
- Table 43: Global US Advanced Composites Industry Revenue billion Forecast, by Material Type 2020 & 2033
- Table 44: Global US Advanced Composites Industry Revenue billion Forecast, by Application Type 2020 & 2033
- Table 45: Global US Advanced Composites Industry Revenue billion Forecast, by Country 2020 & 2033
- Table 46: China US Advanced Composites Industry Revenue (billion) Forecast, by Application 2020 & 2033
- Table 47: India US Advanced Composites Industry Revenue (billion) Forecast, by Application 2020 & 2033
- Table 48: Japan US Advanced Composites Industry Revenue (billion) Forecast, by Application 2020 & 2033
- Table 49: South Korea US Advanced Composites Industry Revenue (billion) Forecast, by Application 2020 & 2033
- Table 50: ASEAN US Advanced Composites Industry Revenue (billion) Forecast, by Application 2020 & 2033
- Table 51: Oceania US Advanced Composites Industry Revenue (billion) Forecast, by Application 2020 & 2033
- Table 52: Rest of Asia Pacific US Advanced Composites Industry Revenue (billion) Forecast, by Application 2020 & 2033
Frequently Asked Questions
1. What is the projected Compound Annual Growth Rate (CAGR) of the US Advanced Composites Industry?
The projected CAGR is approximately 8.9%.
2. Which companies are prominent players in the US Advanced Composites Industry?
Key companies in the market include Nippo Sheet Glass Co Ltd, 3B Fiberglass, Teijin Limite, BASF, Toray Industries Inc, General Motors Company, Base Group, Cytec Industries Inc, BMW, Delphi Auto, SGL Group.
3. What are the main segments of the US Advanced Composites Industry?
The market segments include Productino Type, Material Type, Application Type.
4. Can you provide details about the market size?
The market size is estimated to be USD 52.4 billion as of 2022.
5. What are some drivers contributing to market growth?
4.; Increasing demand from automobile industry4.; Increased focus on precision products.
6. What are the notable trends driving market growth?
Growing Demand for Lightweight Materials.
7. Are there any restraints impacting market growth?
4.; The cost of production and transportation4.; Regulations and quality standards.
8. Can you provide examples of recent developments in the market?
N/A
9. What pricing options are available for accessing the report?
Pricing options include single-user, multi-user, and enterprise licenses priced at USD 3800, USD 4500, and USD 5800 respectively.
10. Is the market size provided in terms of value or volume?
The market size is provided in terms of value, measured in billion.
11. Are there any specific market keywords associated with the report?
Yes, the market keyword associated with the report is "US Advanced Composites Industry," which aids in identifying and referencing the specific market segment covered.
12. How do I determine which pricing option suits my needs best?
The pricing options vary based on user requirements and access needs. Individual users may opt for single-user licenses, while businesses requiring broader access may choose multi-user or enterprise licenses for cost-effective access to the report.
13. Are there any additional resources or data provided in the US Advanced Composites Industry report?
While the report offers comprehensive insights, it's advisable to review the specific contents or supplementary materials provided to ascertain if additional resources or data are available.
14. How can I stay updated on further developments or reports in the US Advanced Composites Industry?
To stay informed about further developments, trends, and reports in the US Advanced Composites Industry, consider subscribing to industry newsletters, following relevant companies and organizations, or regularly checking reputable industry news sources and publications.
Methodology
Step 1 - Identification of Relevant Samples Size from Population Database


Step 2 - Approaches for Defining Global Market Size (Value, Volume* & Price*)

Note*: In applicable scenarios
Step 3 - Data Sources
Primary Research
- Web Analytics
- Survey Reports
- Research Institute
- Latest Research Reports
- Opinion Leaders
Secondary Research
- Annual Reports
- White Paper
- Latest Press Release
- Industry Association
- Paid Database
- Investor Presentations

Step 4 - Data Triangulation
Involves using different sources of information in order to increase the validity of a study
These sources are likely to be stakeholders in a program - participants, other researchers, program staff, other community members, and so on.
Then we put all data in single framework & apply various statistical tools to find out the dynamic on the market.
During the analysis stage, feedback from the stakeholder groups would be compared to determine areas of agreement as well as areas of divergence