

Key Insights
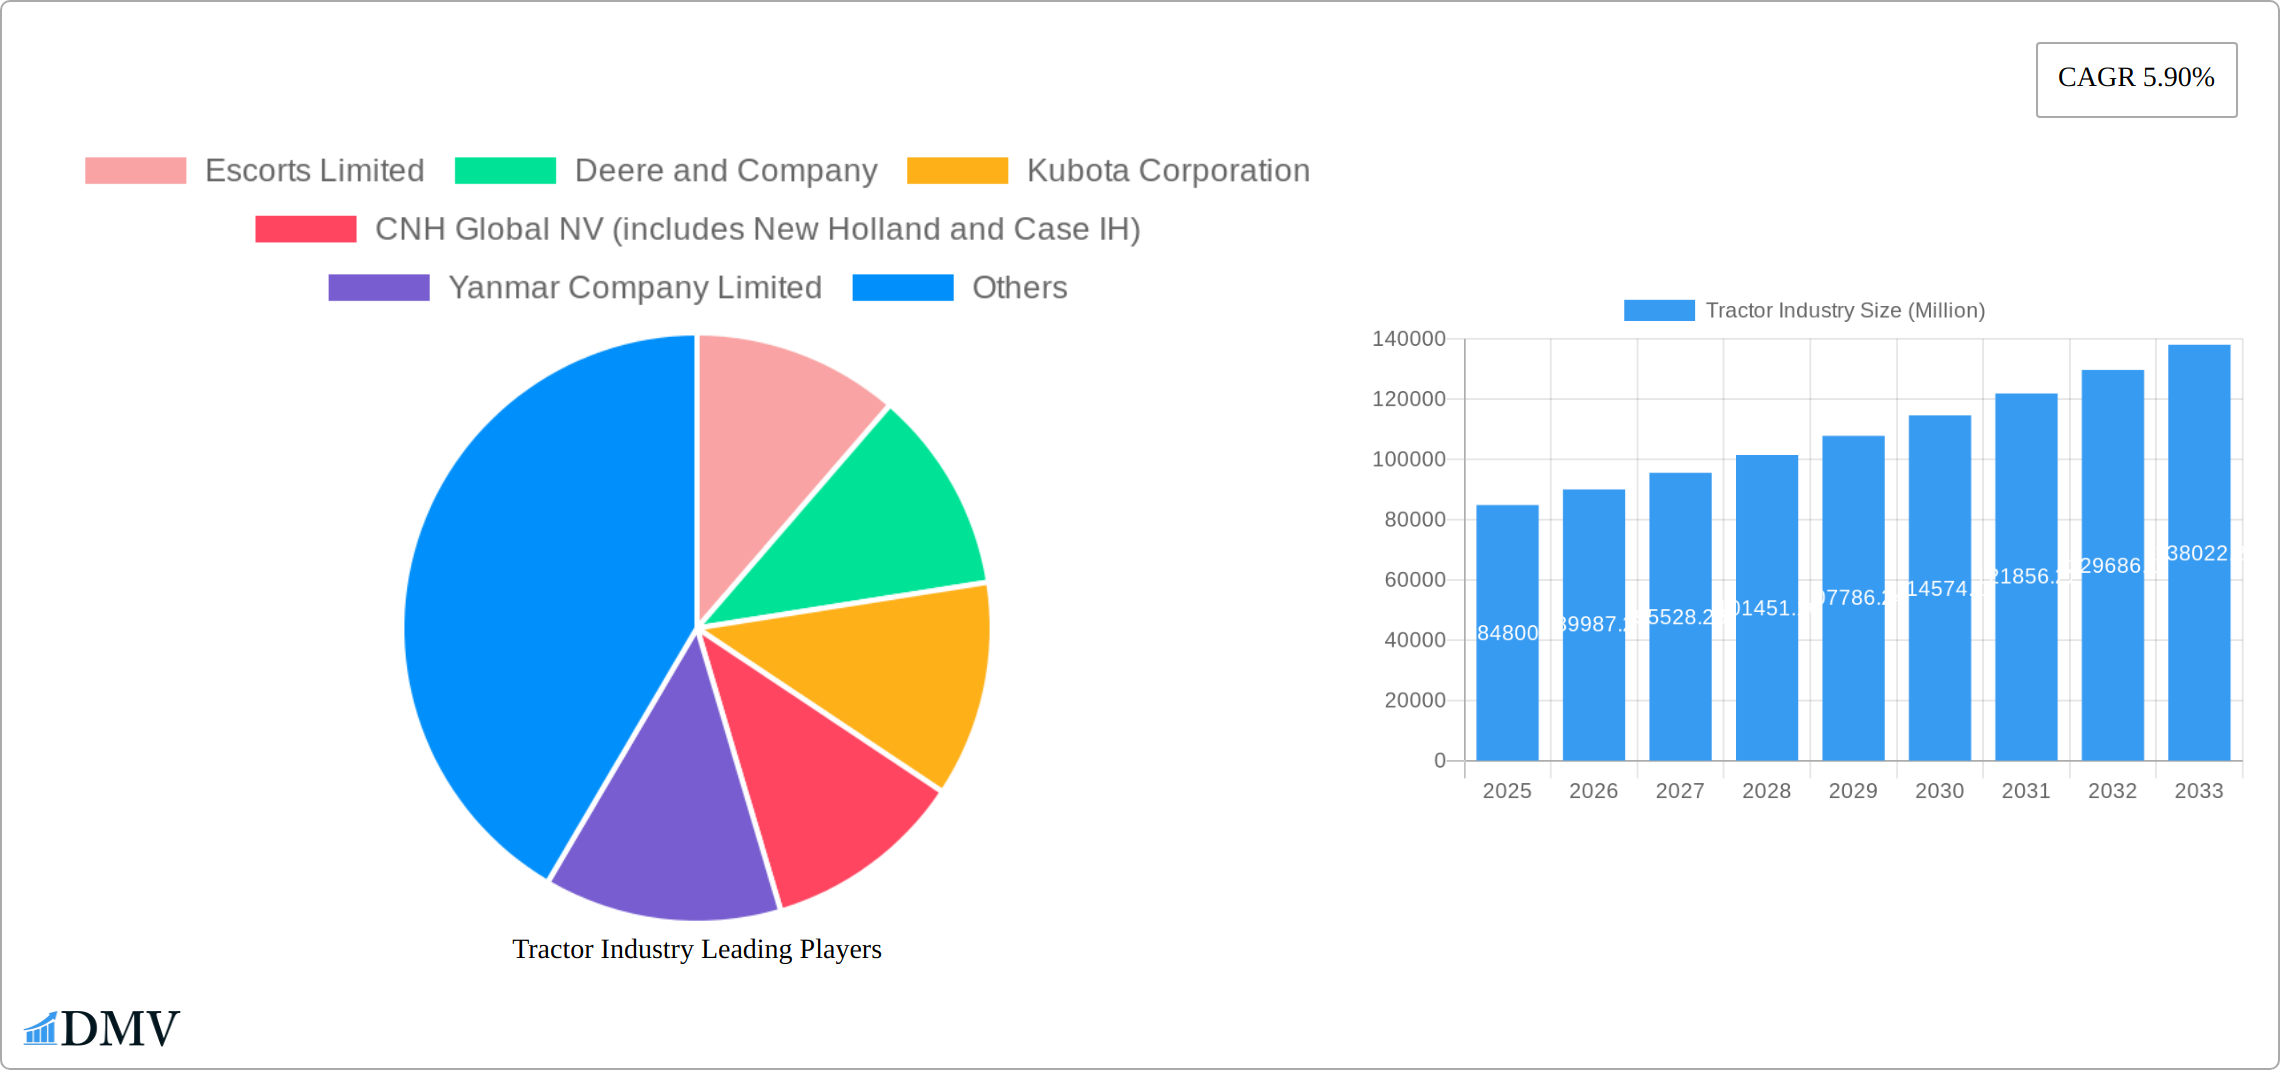
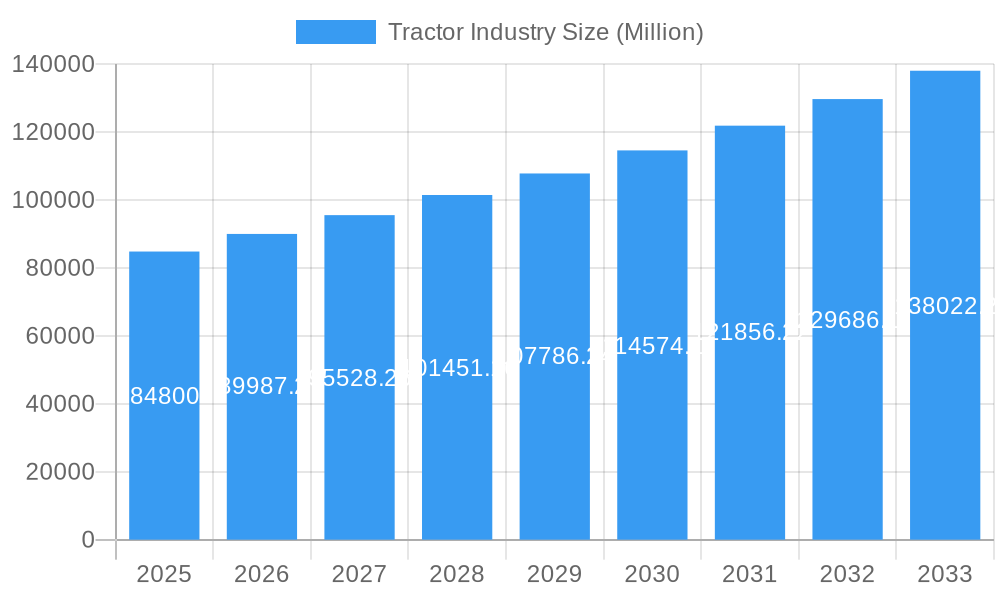
The global tractor market, valued at $84.80 billion in 2025, is projected to experience robust growth, driven by a Compound Annual Growth Rate (CAGR) of 5.90% from 2025 to 2033. This expansion is fueled by several key factors. Increasing global food demand necessitates higher agricultural productivity, leading to increased tractor adoption. Furthermore, technological advancements in tractor design, including features like precision farming capabilities, GPS-guided systems, and improved fuel efficiency, are significantly impacting market growth. Government initiatives promoting agricultural modernization in developing economies also contribute to this upward trajectory. Segmentation analysis reveals a strong preference for tractors in the 40-100 HP range, reflecting a balance between power requirements and cost-effectiveness for various farming operations. Four-wheel drive/all-wheel drive tractors command a significant market share due to their enhanced traction and stability, particularly in challenging terrains. Key players like Deere & Company, Escorts Limited, and Kubota Corporation are strategically investing in R&D and expanding their geographical reach to consolidate their market positions.
Tractor Industry Market Size (In Billion)
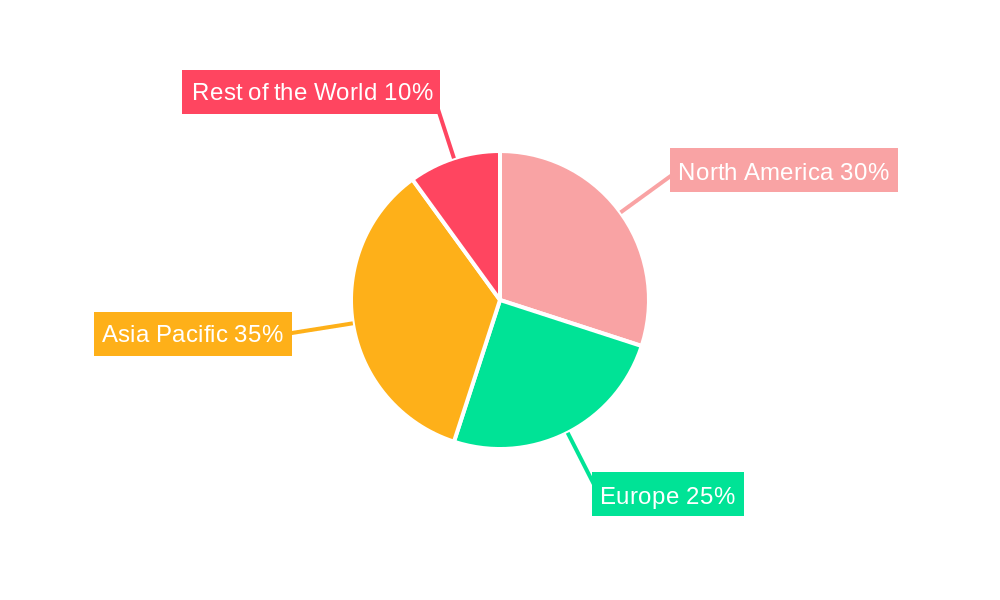
Regional variations in market dynamics are evident. North America and Europe, characterized by advanced agricultural practices and high disposable incomes, maintain considerable market shares. However, the Asia-Pacific region, especially India and China, is anticipated to witness exponential growth due to a burgeoning agricultural sector and increasing government support for mechanization. This expansion is also influenced by the rising adoption of smaller, more affordable tractors, catering to the needs of smallholder farmers. Restraints to market growth include the volatility in commodity prices, fluctuating fuel costs, and the initial high investment cost associated with purchasing new tractors. However, the long-term benefits in terms of increased yields and efficiency are projected to outweigh these challenges, ensuring sustained market growth in the forecast period.
Tractor Industry Company Market Share
Tractor Industry Market Report: 2019-2033
This comprehensive report provides an in-depth analysis of the global tractor industry, encompassing market trends, technological advancements, competitive landscape, and future growth prospects. The study period covers 2019-2033, with a base year of 2025 and a forecast period of 2025-2033. The report offers invaluable insights for stakeholders including manufacturers, investors, and policymakers seeking to understand and navigate this dynamic sector. The global tractor market is projected to reach xx Million by 2033.
Tractor Industry Market Composition & Trends
The global tractor market, valued at xx Million in 2025, is characterized by a moderately concentrated landscape dominated by major players like Deere & Company, Mahindra & Mahindra, and CNH Global. Market share distribution is influenced by factors such as technological innovation, brand reputation, and regional market penetration. The industry witnesses significant M&A activity, with deals totaling xx Million in the past five years, driving consolidation and reshaping the competitive dynamics. Innovation catalysts include advancements in automation, precision farming technologies, and the integration of alternative powertrains (electric, hybrid, gas). Regulatory landscapes, including emission standards and safety regulations, are constantly evolving, impacting product development and market access. Substitute products such as drones and robotic solutions for specific agricultural tasks present ongoing competitive pressures. End-users primarily consist of agricultural businesses, ranging from small farms to large-scale agricultural operations and government institutions.
- Market Share Distribution (2025): Deere & Company (xx%), Mahindra & Mahindra (xx%), CNH Global (xx%), Kubota (xx%), Others (xx%).
- M&A Activity (2020-2025): Total deal value: xx Million USD; Average deal size: xx Million USD.
- Key Regulatory Influences: Emission standards (Tier 4/Tier 5), safety regulations, and agricultural subsidies.
Tractor Industry Evolution
The tractor industry has witnessed a significant evolution, driven by technological advancements and shifting consumer demands. From 2019 to 2024, the market experienced a CAGR of xx%, primarily fueled by increasing mechanization in agriculture, especially in developing economies. Technological advancements such as GPS-guided systems, automated steering, and telematics have increased efficiency and productivity. The rising demand for fuel-efficient and environmentally friendly tractors is driving the adoption of alternative powertrains like electric and hybrid models. Consumer demands are shifting towards increased comfort, safety, and ease of operation. This trend is reflected in the design and features of modern tractors. Furthermore, the growing adoption of precision agriculture practices, which necessitate advanced tractor technologies for optimized resource utilization, is driving market growth. The market is expected to continue its growth trajectory with a projected CAGR of xx% during the forecast period (2025-2033).
Leading Regions, Countries, or Segments in Tractor Industry
The North American and European markets continue to be dominant forces in the global tractor industry, characterized by established agricultural practices and a strong demand for advanced machinery. However, the Asia-Pacific region, with countries like India and China at the forefront, is experiencing a remarkable surge in growth. This expansion is primarily fueled by a concerted push towards agricultural mechanization, driven by the need for increased efficiency and productivity, and significantly bolstered by supportive government initiatives aimed at modernizing farming practices.
- By Horsepower: The 40 HP - 100 HP segment remains the cornerstone of the market. Tractors within this range offer a compelling blend of versatility, making them suitable for a wide array of farming operations from smallholdings to medium-sized farms, while also offering an attractive balance of affordability and performance.
- By Drive Type: The demand for four-wheel drive (4WD) tractors is on a clear upward trajectory. These robust machines provide superior traction and maneuverability, proving invaluable in challenging terrain and adverse weather conditions, thereby contributing significantly to market expansion and enhancing operational capabilities for farmers.
Key Drivers:
- Investment Trends: Substantial and sustained investments in the development of agricultural infrastructure, coupled with a widespread movement towards agricultural modernization, are acting as powerful catalysts for increased tractor demand.
- Regulatory Support: Government policies, including substantial subsidies, tax incentives, and other supportive measures, are playing a pivotal role in encouraging and facilitating the widespread adoption of modern and technologically advanced agricultural equipment.
- Economic Growth: Robust economic development and increasing disposable incomes in emerging markets are directly translating into a greater demand for mechanized farming solutions, as farmers seek to improve yields and profitability through efficient agricultural practices.
Tractor Industry Product Innovations
Recent innovations in the tractor industry focus on enhancing efficiency, sustainability, and precision. Autonomous tractors, electric and hybrid models, and advanced precision farming technologies represent key advancements. Features like automated steering, GPS-guided systems, and variable rate technology improve operational efficiency and reduce input costs. These innovations offer unique selling propositions including reduced environmental impact and increased productivity, driving significant market potential.
Propelling Factors for Tractor Industry Growth
The tractor industry's growth is being propelled by a confluence of innovative advancements and strategic market forces. Technological breakthroughs, particularly in areas like automation, sophisticated precision farming techniques, and the development of eco-friendly alternative powertrains, are significantly enhancing operational efficiency, productivity, and sustainability. Complementing these technological leaps are favorable government policies that actively champion agricultural mechanization, alongside the steady economic growth witnessed in emerging markets. Furthermore, a continuous increase in investment directed towards agricultural infrastructure creates an increasingly fertile ground for the widespread adoption and integration of tractors as essential farming tools.
Obstacles in the Tractor Industry Market
The tractor industry faces challenges including supply chain disruptions impacting component availability and manufacturing costs. Stricter emission regulations raise production costs. Intense competition amongst major players necessitates continuous innovation and investment. Fluctuations in agricultural commodity prices can also affect demand.
Future Opportunities in Tractor Industry
The horizon for the tractor industry is brimming with promising opportunities, particularly in the untapped potential of developing markets where agricultural activity is rapidly expanding. The advent and refinement of autonomous tractors and the further integration of precision farming technologies represent a vast and largely untapped market with immense growth potential. Moreover, ongoing innovations in electrification and the development of sustainable farming solutions are set to redefine industry standards and open up new avenues for market penetration and product development.
Major Players in the Tractor Industry Ecosystem
- Escorts Limited
- Deere and Company
- Kubota Corporation
- CNH Global NV
- Yanmar Company Limited
- Kuhn Group (Subsidiary of Bucher Industries)
- Deutz-Fah
- Mahindra and Mahindra Corporation
- CLAAS KGaA mbH
- Tractors and Farm Equipment Limited (TAFE)
- AGCO Corporation
Key Developments in Tractor Industry Industry
- March 2024: Hyster Company's USD 60 Million investment in battery-powered terminal tractors signifies a shift towards sustainable port operations.
- October 2023: International Tractors Limited's launch of the SV Solis electric tractor highlights the growing adoption of electric tractors in agriculture.
- May 2023: CNH's USD 50 Million investment in the Indian market indicates the importance of the region's agricultural sector and the increasing demand for high-horsepower tractors.
- September 2022: KAMAZ PJSC's expansion into gas-powered vehicles reflects the industry's focus on alternative fuel solutions.
- August 2022: Foxconn's manufacturing agreement with Monarch Tractor indicates a growing trend towards autonomous tractors and the integration of technology in the agricultural sector.
- July 2022: Ashok Leyland's introduction of the AVTR 4220 and AVTR 4420 tractors in the 4x2 segment demonstrates ongoing innovation in this market segment.
Strategic Tractor Industry Market Forecast
The tractor industry is projected for robust and sustained growth in the coming years. This expansion will be propelled by the accelerating adoption of cutting-edge technologies, the widespread integration of sophisticated precision farming practices, and a growing global demand for agricultural solutions that are both sustainable and highly efficient. The future outlook for the market is exceptionally promising, presenting abundant opportunities across a diverse range of segments and geographical regions. A continued commitment to investing in research and development, coupled with the ongoing implementation of supportive government policies, will serve as critical enablers for the market's further expansion, paving the way for significant advancements and market dominance in the years ahead.
Tractor Industry Segmentation
-
1. Horsepower
- 1.1. Below 40 HP
- 1.2. 40 HP - 100 HP
- 1.3. Above 100 HP
-
2. Drive Type
- 2.1. Two-wheel Drive
- 2.2. Four-wheel Drive/All-wheel Drive
Tractor Industry Segmentation By Geography
-
1. North America
- 1.1. United States
- 1.2. Canada
- 1.3. Rest of North America
-
2. Europe
- 2.1. Germany
- 2.2. United Kingdom
- 2.3. France
- 2.4. Spain
- 2.5. Italy
- 2.6. Rest of Europe
-
3. Asia Pacific
- 3.1. China
- 3.2. Japan
- 3.3. India
- 3.4. South Korea
- 3.5. Rest of Asia Pacific
-
4. Rest of the World
- 4.1. South America
- 4.2. Middle East and Africa
Tractor Industry Regional Market Share
Geographic Coverage of Tractor Industry
Tractor Industry REPORT HIGHLIGHTS
| Aspects | Details |
|---|---|
| Study Period | 2020-2034 |
| Base Year | 2025 |
| Estimated Year | 2026 |
| Forecast Period | 2026-2034 |
| Historical Period | 2020-2025 |
| Growth Rate | CAGR of 5.90% from 2020-2034 |
| Segmentation |
|
Table of Contents
- 1. Introduction
- 1.1. Research Scope
- 1.2. Market Segmentation
- 1.3. Research Objective
- 1.4. Definitions and Assumptions
- 2. Executive Summary
- 2.1. Market Snapshot
- 3. Market Dynamics
- 3.1. Market Drivers
- 3.2. Market Restrains
- 3.3. Market Trends
- 3.4. Market Opportunities
- 4. Market Factor Analysis
- 4.1. Porters Five Forces
- 4.1.1. Bargaining Power of Suppliers
- 4.1.2. Bargaining Power of Buyers
- 4.1.3. Threat of New Entrants
- 4.1.4. Threat of Substitutes
- 4.1.5. Competitive Rivalry
- 4.2. PESTEL analysis
- 4.3. BCG Analysis
- 4.3.1. Stars (High Growth, High Market Share)
- 4.3.2. Cash Cows (Low Growth, High Market Share)
- 4.3.3. Question Mark (High Growth, Low Market Share)
- 4.3.4. Dogs (Low Growth, Low Market Share)
- 4.4. Ansoff Matrix Analysis
- 4.5. Supply Chain Analysis
- 4.6. Regulatory Landscape
- 4.7. Current Market Potential and Opportunity Assessment (TAM–SAM–SOM Framework)
- 4.8. DMV Analyst Note
- 4.1. Porters Five Forces
- 5. Market Analysis, Insights and Forecast 2021-2033
- 5.1. Market Analysis, Insights and Forecast - by Horsepower
- 5.1.1. Below 40 HP
- 5.1.2. 40 HP - 100 HP
- 5.1.3. Above 100 HP
- 5.2. Market Analysis, Insights and Forecast - by Drive Type
- 5.2.1. Two-wheel Drive
- 5.2.2. Four-wheel Drive/All-wheel Drive
- 5.3. Market Analysis, Insights and Forecast - by Region
- 5.3.1. North America
- 5.3.2. Europe
- 5.3.3. Asia Pacific
- 5.3.4. Rest of the World
- 5.1. Market Analysis, Insights and Forecast - by Horsepower
- 6. Global Tractor Industry Analysis, Insights and Forecast, 2021-2033
- 6.1. Market Analysis, Insights and Forecast - by Horsepower
- 6.1.1. Below 40 HP
- 6.1.2. 40 HP - 100 HP
- 6.1.3. Above 100 HP
- 6.2. Market Analysis, Insights and Forecast - by Drive Type
- 6.2.1. Two-wheel Drive
- 6.2.2. Four-wheel Drive/All-wheel Drive
- 6.1. Market Analysis, Insights and Forecast - by Horsepower
- 7. North America Tractor Industry Analysis, Insights and Forecast, 2020-2032
- 7.1. Market Analysis, Insights and Forecast - by Horsepower
- 7.1.1. Below 40 HP
- 7.1.2. 40 HP - 100 HP
- 7.1.3. Above 100 HP
- 7.2. Market Analysis, Insights and Forecast - by Drive Type
- 7.2.1. Two-wheel Drive
- 7.2.2. Four-wheel Drive/All-wheel Drive
- 7.1. Market Analysis, Insights and Forecast - by Horsepower
- 8. Europe Tractor Industry Analysis, Insights and Forecast, 2020-2032
- 8.1. Market Analysis, Insights and Forecast - by Horsepower
- 8.1.1. Below 40 HP
- 8.1.2. 40 HP - 100 HP
- 8.1.3. Above 100 HP
- 8.2. Market Analysis, Insights and Forecast - by Drive Type
- 8.2.1. Two-wheel Drive
- 8.2.2. Four-wheel Drive/All-wheel Drive
- 8.1. Market Analysis, Insights and Forecast - by Horsepower
- 9. Asia Pacific Tractor Industry Analysis, Insights and Forecast, 2020-2032
- 9.1. Market Analysis, Insights and Forecast - by Horsepower
- 9.1.1. Below 40 HP
- 9.1.2. 40 HP - 100 HP
- 9.1.3. Above 100 HP
- 9.2. Market Analysis, Insights and Forecast - by Drive Type
- 9.2.1. Two-wheel Drive
- 9.2.2. Four-wheel Drive/All-wheel Drive
- 9.1. Market Analysis, Insights and Forecast - by Horsepower
- 10. Rest of the World Tractor Industry Analysis, Insights and Forecast, 2020-2032
- 10.1. Market Analysis, Insights and Forecast - by Horsepower
- 10.1.1. Below 40 HP
- 10.1.2. 40 HP - 100 HP
- 10.1.3. Above 100 HP
- 10.2. Market Analysis, Insights and Forecast - by Drive Type
- 10.2.1. Two-wheel Drive
- 10.2.2. Four-wheel Drive/All-wheel Drive
- 10.1. Market Analysis, Insights and Forecast - by Horsepower
- 11. Competitive Analysis
- 11.1. Company Profiles
- 11.1.1 Escorts Limited
- 11.1.1.1. Company Overview
- 11.1.1.2. Products
- 11.1.1.3. Company Financials
- 11.1.1.4. SWOT Analysis
- 11.1.2 Deere and Company
- 11.1.2.1. Company Overview
- 11.1.2.2. Products
- 11.1.2.3. Company Financials
- 11.1.2.4. SWOT Analysis
- 11.1.3 Kubota Corporation
- 11.1.3.1. Company Overview
- 11.1.3.2. Products
- 11.1.3.3. Company Financials
- 11.1.3.4. SWOT Analysis
- 11.1.4 CNH Global NV (includes New Holland and Case IH)
- 11.1.4.1. Company Overview
- 11.1.4.2. Products
- 11.1.4.3. Company Financials
- 11.1.4.4. SWOT Analysis
- 11.1.5 Yanmar Company Limited
- 11.1.5.1. Company Overview
- 11.1.5.2. Products
- 11.1.5.3. Company Financials
- 11.1.5.4. SWOT Analysis
- 11.1.6 Kuhn Group (Subsidiary of Bucher Industries)
- 11.1.6.1. Company Overview
- 11.1.6.2. Products
- 11.1.6.3. Company Financials
- 11.1.6.4. SWOT Analysis
- 11.1.7 Deutz-Fah
- 11.1.7.1. Company Overview
- 11.1.7.2. Products
- 11.1.7.3. Company Financials
- 11.1.7.4. SWOT Analysis
- 11.1.8 Mahindra and Mahindra Corporation
- 11.1.8.1. Company Overview
- 11.1.8.2. Products
- 11.1.8.3. Company Financials
- 11.1.8.4. SWOT Analysis
- 11.1.9 CLAAS KGaA mbH
- 11.1.9.1. Company Overview
- 11.1.9.2. Products
- 11.1.9.3. Company Financials
- 11.1.9.4. SWOT Analysis
- 11.1.10 Tractors and Farm Equipment Limited (TAFE)
- 11.1.10.1. Company Overview
- 11.1.10.2. Products
- 11.1.10.3. Company Financials
- 11.1.10.4. SWOT Analysis
- 11.1.11 AGCO Corporation (includes Massey Ferguson Valtra Fendt and Challenger)
- 11.1.11.1. Company Overview
- 11.1.11.2. Products
- 11.1.11.3. Company Financials
- 11.1.11.4. SWOT Analysis
- 11.1.1 Escorts Limited
- 11.2. Market Entropy
- 11.2.1 Company's Key Areas Served
- 11.2.2 Recent Developments
- 11.3. Company Market Share Analysis 2025
- 11.3.1 Top 5 Companies Market Share Analysis
- 11.3.2 Top 3 Companies Market Share Analysis
- 11.4. List of Potential Customers
- 12. Research Methodology
List of Figures
- Figure 1: Global Tractor Industry Revenue Breakdown (Million, %) by Region 2025 & 2033
- Figure 2: North America Tractor Industry Revenue (Million), by Horsepower 2025 & 2033
- Figure 3: North America Tractor Industry Revenue Share (%), by Horsepower 2025 & 2033
- Figure 4: North America Tractor Industry Revenue (Million), by Drive Type 2025 & 2033
- Figure 5: North America Tractor Industry Revenue Share (%), by Drive Type 2025 & 2033
- Figure 6: North America Tractor Industry Revenue (Million), by Country 2025 & 2033
- Figure 7: North America Tractor Industry Revenue Share (%), by Country 2025 & 2033
- Figure 8: Europe Tractor Industry Revenue (Million), by Horsepower 2025 & 2033
- Figure 9: Europe Tractor Industry Revenue Share (%), by Horsepower 2025 & 2033
- Figure 10: Europe Tractor Industry Revenue (Million), by Drive Type 2025 & 2033
- Figure 11: Europe Tractor Industry Revenue Share (%), by Drive Type 2025 & 2033
- Figure 12: Europe Tractor Industry Revenue (Million), by Country 2025 & 2033
- Figure 13: Europe Tractor Industry Revenue Share (%), by Country 2025 & 2033
- Figure 14: Asia Pacific Tractor Industry Revenue (Million), by Horsepower 2025 & 2033
- Figure 15: Asia Pacific Tractor Industry Revenue Share (%), by Horsepower 2025 & 2033
- Figure 16: Asia Pacific Tractor Industry Revenue (Million), by Drive Type 2025 & 2033
- Figure 17: Asia Pacific Tractor Industry Revenue Share (%), by Drive Type 2025 & 2033
- Figure 18: Asia Pacific Tractor Industry Revenue (Million), by Country 2025 & 2033
- Figure 19: Asia Pacific Tractor Industry Revenue Share (%), by Country 2025 & 2033
- Figure 20: Rest of the World Tractor Industry Revenue (Million), by Horsepower 2025 & 2033
- Figure 21: Rest of the World Tractor Industry Revenue Share (%), by Horsepower 2025 & 2033
- Figure 22: Rest of the World Tractor Industry Revenue (Million), by Drive Type 2025 & 2033
- Figure 23: Rest of the World Tractor Industry Revenue Share (%), by Drive Type 2025 & 2033
- Figure 24: Rest of the World Tractor Industry Revenue (Million), by Country 2025 & 2033
- Figure 25: Rest of the World Tractor Industry Revenue Share (%), by Country 2025 & 2033
List of Tables
- Table 1: Global Tractor Industry Revenue Million Forecast, by Horsepower 2020 & 2033
- Table 2: Global Tractor Industry Revenue Million Forecast, by Drive Type 2020 & 2033
- Table 3: Global Tractor Industry Revenue Million Forecast, by Region 2020 & 2033
- Table 4: Global Tractor Industry Revenue Million Forecast, by Horsepower 2020 & 2033
- Table 5: Global Tractor Industry Revenue Million Forecast, by Drive Type 2020 & 2033
- Table 6: Global Tractor Industry Revenue Million Forecast, by Country 2020 & 2033
- Table 7: United States Tractor Industry Revenue (Million) Forecast, by Application 2020 & 2033
- Table 8: Canada Tractor Industry Revenue (Million) Forecast, by Application 2020 & 2033
- Table 9: Rest of North America Tractor Industry Revenue (Million) Forecast, by Application 2020 & 2033
- Table 10: Global Tractor Industry Revenue Million Forecast, by Horsepower 2020 & 2033
- Table 11: Global Tractor Industry Revenue Million Forecast, by Drive Type 2020 & 2033
- Table 12: Global Tractor Industry Revenue Million Forecast, by Country 2020 & 2033
- Table 13: Germany Tractor Industry Revenue (Million) Forecast, by Application 2020 & 2033
- Table 14: United Kingdom Tractor Industry Revenue (Million) Forecast, by Application 2020 & 2033
- Table 15: France Tractor Industry Revenue (Million) Forecast, by Application 2020 & 2033
- Table 16: Spain Tractor Industry Revenue (Million) Forecast, by Application 2020 & 2033
- Table 17: Italy Tractor Industry Revenue (Million) Forecast, by Application 2020 & 2033
- Table 18: Rest of Europe Tractor Industry Revenue (Million) Forecast, by Application 2020 & 2033
- Table 19: Global Tractor Industry Revenue Million Forecast, by Horsepower 2020 & 2033
- Table 20: Global Tractor Industry Revenue Million Forecast, by Drive Type 2020 & 2033
- Table 21: Global Tractor Industry Revenue Million Forecast, by Country 2020 & 2033
- Table 22: China Tractor Industry Revenue (Million) Forecast, by Application 2020 & 2033
- Table 23: Japan Tractor Industry Revenue (Million) Forecast, by Application 2020 & 2033
- Table 24: India Tractor Industry Revenue (Million) Forecast, by Application 2020 & 2033
- Table 25: South Korea Tractor Industry Revenue (Million) Forecast, by Application 2020 & 2033
- Table 26: Rest of Asia Pacific Tractor Industry Revenue (Million) Forecast, by Application 2020 & 2033
- Table 27: Global Tractor Industry Revenue Million Forecast, by Horsepower 2020 & 2033
- Table 28: Global Tractor Industry Revenue Million Forecast, by Drive Type 2020 & 2033
- Table 29: Global Tractor Industry Revenue Million Forecast, by Country 2020 & 2033
- Table 30: South America Tractor Industry Revenue (Million) Forecast, by Application 2020 & 2033
- Table 31: Middle East and Africa Tractor Industry Revenue (Million) Forecast, by Application 2020 & 2033
Frequently Asked Questions
1. What is the projected Compound Annual Growth Rate (CAGR) of the Tractor Industry?
The projected CAGR is approximately 5.90%.
2. Which companies are prominent players in the Tractor Industry?
Key companies in the market include Escorts Limited, Deere and Company, Kubota Corporation, CNH Global NV (includes New Holland and Case IH), Yanmar Company Limited, Kuhn Group (Subsidiary of Bucher Industries), Deutz-Fah, Mahindra and Mahindra Corporation, CLAAS KGaA mbH, Tractors and Farm Equipment Limited (TAFE), AGCO Corporation (includes Massey Ferguson Valtra Fendt and Challenger).
3. What are the main segments of the Tractor Industry?
The market segments include Horsepower, Drive Type.
4. Can you provide details about the market size?
The market size is estimated to be USD 84.80 Million as of 2022.
5. What are some drivers contributing to market growth?
Rising Residential Activities in Addition to Consumer Spending to Enhance Market Demand.
6. What are the notable trends driving market growth?
The Below 40 HP Tractors Segment's Growth is Expected to be Bolstered over the Next Five Years.
7. Are there any restraints impacting market growth?
Rising Electric Vehicle Adoption to Hinder Market Growth in the Long Run.
8. Can you provide examples of recent developments in the market?
March 2024: Hyster Company announced an agreement to provide APM Terminals with 10 battery-powered terminal tractors for their location at the Port of Mobile in Alabama. The electric terminal tractors, which are scheduled to be delivered in 2024, are part of a USD 60 million investment in port equipment electrification pilots by APM Terminals.
9. What pricing options are available for accessing the report?
Pricing options include single-user, multi-user, and enterprise licenses priced at USD 4750, USD 5250, and USD 8750 respectively.
10. Is the market size provided in terms of value or volume?
The market size is provided in terms of value, measured in Million.
11. Are there any specific market keywords associated with the report?
Yes, the market keyword associated with the report is "Tractor Industry," which aids in identifying and referencing the specific market segment covered.
12. How do I determine which pricing option suits my needs best?
The pricing options vary based on user requirements and access needs. Individual users may opt for single-user licenses, while businesses requiring broader access may choose multi-user or enterprise licenses for cost-effective access to the report.
13. Are there any additional resources or data provided in the Tractor Industry report?
While the report offers comprehensive insights, it's advisable to review the specific contents or supplementary materials provided to ascertain if additional resources or data are available.
14. How can I stay updated on further developments or reports in the Tractor Industry?
To stay informed about further developments, trends, and reports in the Tractor Industry, consider subscribing to industry newsletters, following relevant companies and organizations, or regularly checking reputable industry news sources and publications.
Methodology
Step 1 - Identification of Relevant Samples Size from Population Database


Step 2 - Approaches for Defining Global Market Size (Value, Volume* & Price*)

Note*: In applicable scenarios
Step 3 - Data Sources
Primary Research
- Web Analytics
- Survey Reports
- Research Institute
- Latest Research Reports
- Opinion Leaders
Secondary Research
- Annual Reports
- White Paper
- Latest Press Release
- Industry Association
- Paid Database
- Investor Presentations

Step 4 - Data Triangulation
Involves using different sources of information in order to increase the validity of a study
These sources are likely to be stakeholders in a program - participants, other researchers, program staff, other community members, and so on.
Then we put all data in single framework & apply various statistical tools to find out the dynamic on the market.
During the analysis stage, feedback from the stakeholder groups would be compared to determine areas of agreement as well as areas of divergence