

Key Insights
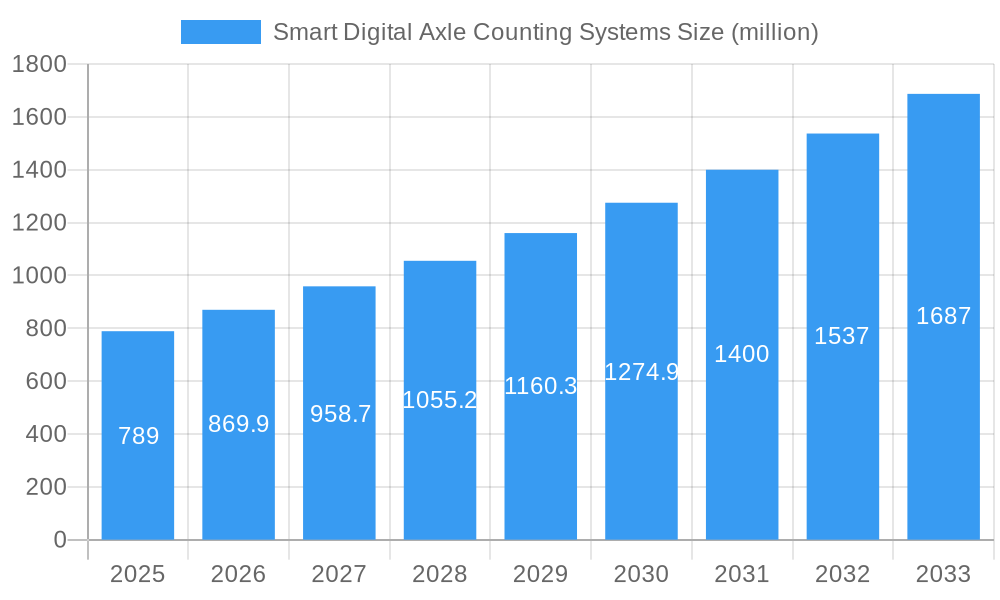
The global Smart Digital Axle Counting Systems market is poised for significant expansion, projected to reach an estimated market size of $789 million by 2025, with a robust Compound Annual Growth Rate (CAGR) of 10.3% anticipated to persist through 2033. This growth is primarily fueled by the increasing demand for enhanced railway safety and operational efficiency, driven by the escalating adoption of digital technologies in transportation infrastructure. Key growth drivers include the relentless modernization of existing railway networks and the rapid development of new urban rail transit systems worldwide. These advanced axle counting systems provide real-time, accurate train detection and location, crucial for preventing collisions, optimizing train scheduling, and enabling vital signaling functionalities. The push for automated train operations and the implementation of stringent safety regulations are further propelling market adoption.
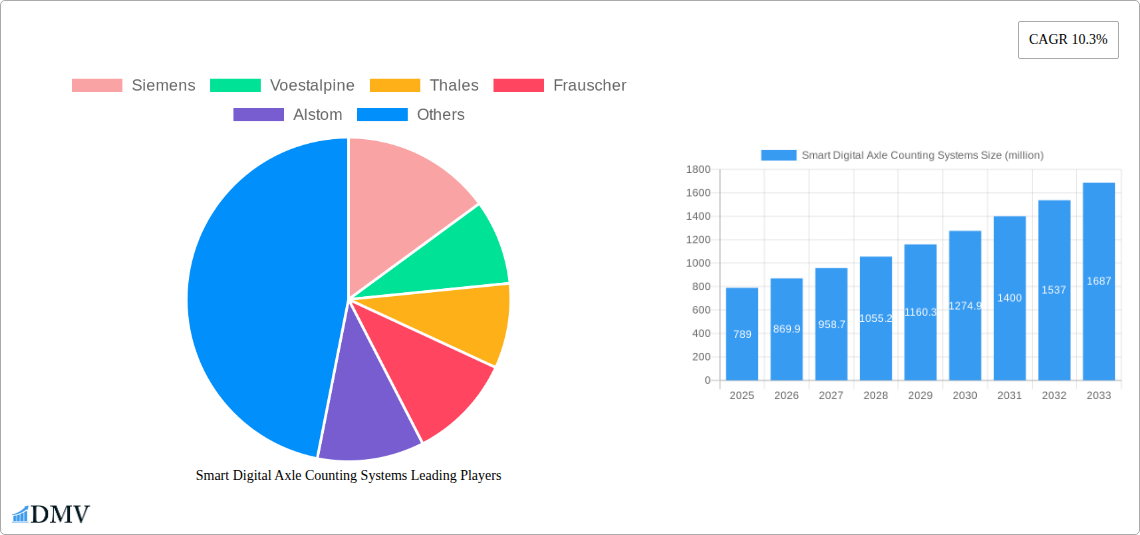
Smart Digital Axle Counting Systems Market Size (In Million)
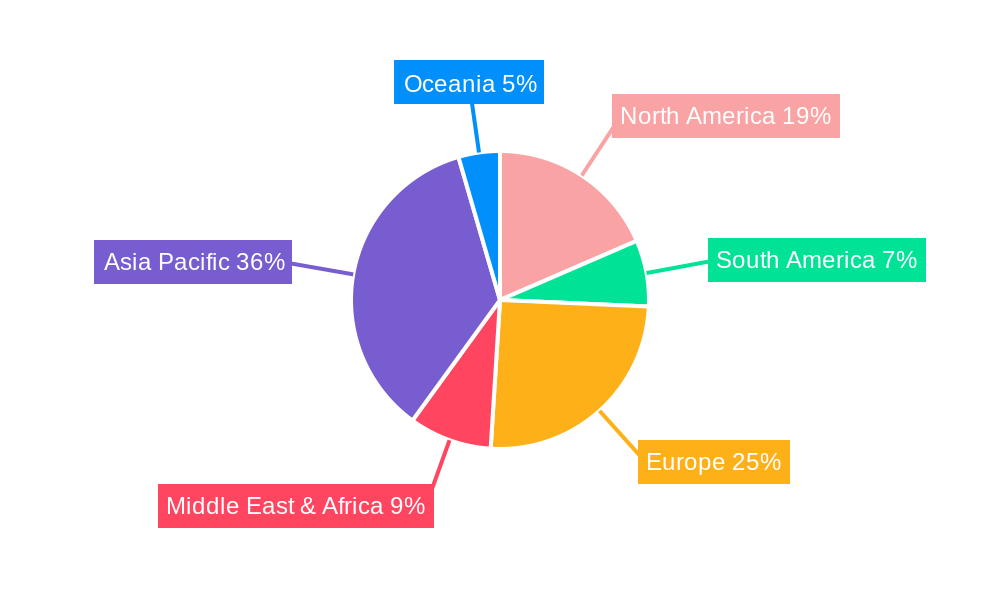
The market is segmented by application into Railway and Urban Rail Transit, with both segments demonstrating strong growth potential due to ongoing infrastructure investments. Installation types are categorized into Rail Side Installation and On-Rail Installation, with rail-side solutions likely dominating due to ease of maintenance and deployment. Geographically, Asia Pacific, led by China and India, is expected to be a major growth engine, owing to massive infrastructure development and the rapid expansion of high-speed rail networks. North America and Europe will continue to be significant markets, driven by upgrades to aging infrastructure and the implementation of advanced train control systems. Key players such as Siemens, Voestalpine, Thales, Alstom, and CRCEF are actively innovating and expanding their offerings to capture this burgeoning market, focusing on developing more intelligent, reliable, and cost-effective axle counting solutions.
Smart Digital Axle Counting Systems Company Market Share
Smart Digital Axle Counting Systems Market Composition & Trends
This comprehensive report delves into the dynamic Smart Digital Axle Counting Systems market, analyzing its structure, key trends, and future trajectory. The market, currently valued at approximately $500 million, exhibits a moderately concentrated landscape with key players like Siemens, Voestalpine, Thales, and Frauscher commanding significant market share. Innovation remains a critical catalyst, driven by advancements in digital signaling, IoT integration, and AI-powered analytics for enhanced safety and efficiency in railway operations. The regulatory landscape, with an increasing focus on interoperability and safety standards across regions, is shaping product development and market entry strategies. Substitute products, such as treadle-based systems, are gradually being phased out due to their limitations in accuracy and maintenance requirements. End-user profiles predominantly include railway infrastructure operators, urban rail transit authorities, and freight transportation companies, all seeking reliable and intelligent solutions for train detection and tracking. Mergers and acquisitions (M&A) activity, with an estimated deal value of $150 million in the historical period (2019-2024), indicates strategic consolidation and expansion by major players to acquire technological capabilities and market reach.
- Market Share Distribution: Leading players like Siemens and Thales hold an estimated combined market share of 35%.
- M&A Deal Values: Historical M&A activities in the segment reached an estimated $150 million.
- Innovation Catalysts: Digital signaling, IoT, AI analytics.
- End-User Segments: Railway Operators, Urban Rail Transit Authorities, Freight Companies.
Smart Digital Axle Counting Systems Industry Evolution
The Smart Digital Axle Counting Systems industry has undergone a remarkable evolution, transforming from basic mechanical counters to sophisticated digital solutions. This evolution is underscored by a robust market growth trajectory, with the global market size projected to reach over $1.2 billion by 2033. The historical period (2019-2024) witnessed consistent growth, averaging a Compound Annual Growth Rate (CAGR) of approximately 8%, fueled by increasing investments in railway modernization and the expansion of urban rail transit networks worldwide. Technological advancements have been the primary engine of this growth. Initially, magnetic and inductive axle counters dominated, offering improved reliability over older mechanical systems. The advent of digital axle counting brought enhanced accuracy, self-diagnostic capabilities, and seamless integration with Computer-Based Interlocking (CBI) systems. More recently, the integration of IoT and AI has ushered in an era of "smart" systems, enabling real-time data analytics, predictive maintenance, and improved track circuit management. This has directly addressed shifting consumer demands for higher safety standards, reduced operational costs, and increased track availability. Adoption metrics show a significant shift from traditional track circuits to digital axle counting solutions, with an estimated adoption rate of 60% in new railway projects during the historical period. The forecast period (2025-2033) is expected to see this trend accelerate, driven by the ongoing digital transformation of railway infrastructure and the growing demand for unattended train operations and advanced signaling systems. The market is characterized by continuous innovation in sensor technology, data processing algorithms, and communication protocols, ensuring that smart digital axle counting systems remain at the forefront of railway safety and efficiency. The base year (2025) reflects a market poised for significant expansion, building on the strong foundation laid in the preceding years.
Leading Regions, Countries, or Segments in Smart Digital Axle Counting Systems
The global Smart Digital Axle Counting Systems market exhibits distinct regional leadership, driven by a confluence of investment trends, regulatory support, and the sheer scale of existing and developing railway infrastructure. Asia Pacific, particularly China and India, has emerged as a dominant region, accounting for an estimated 40% of the global market share in the historical period. This dominance is fueled by massive investments in high-speed rail networks, urban metro expansion, and the modernization of existing conventional lines. China's CRCEF, for instance, is a key player in its domestic market.
Within the Application segment, Railway operations constitute the largest share, estimated at 70%, due to the extensive freight and passenger networks requiring robust and reliable train detection. Urban Rail Transit is the fastest-growing application, projected to grow at a CAGR of 10% during the forecast period, driven by increasing urbanization and the need for efficient public transportation.
In terms of Type, Rail Side Installation remains the predominant method, accounting for an estimated 75% of the market, owing to its cost-effectiveness and ease of deployment in most scenarios. However, On-Rail Installation systems are gaining traction, particularly in applications where minimizing track downtime is critical, such as in dense urban networks or during maintenance periods. Companies like Frauscher are at the forefront of developing innovative on-rail solutions.
Key Drivers in Asia Pacific:
- Massive government investment in high-speed rail and urban metro projects.
- Rapid industrialization and increased freight transportation demands.
- Favorable regulatory frameworks promoting technological adoption.
- Presence of major domestic manufacturers like CRCEF.
Dominance Factors in Railway Application:
- Extensive existing railway networks requiring upgrades and maintenance.
- High safety standards and the need for reliable train separation.
- Integration with complex signaling and control systems.
Growth Factors in Urban Rail Transit:
- Booming urban populations necessitating expanded public transport.
- Focus on punctuality and passenger safety in metro operations.
- Demand for advanced, compact, and low-maintenance solutions.
Trends in Installation Types:
- Continued preference for rail-side installation due to established infrastructure and cost benefits.
- Growing niche for on-rail installation in time-sensitive and specialized applications.
Smart Digital Axle Counting Systems Product Innovations
Product innovation in Smart Digital Axle Counting Systems is driven by the pursuit of enhanced accuracy, reliability, and seamless integration. Recent advancements include the development of multi-sensor technologies that combine inductive, Doppler, and optical detection for unparalleled precision, even in challenging environmental conditions like heavy rainfall or snow. These systems offer advanced diagnostics, enabling predictive maintenance and reducing downtime, a critical factor for rail operators. Furthermore, the integration of wireless communication protocols and IoT capabilities allows for real-time data transmission to centralized control centers, facilitating sophisticated analytics and operational management. Applications now extend beyond basic train detection to include precise train length measurement, axle load monitoring, and even early detection of potential track defects, showcasing the evolving capabilities and unique selling propositions of these smart solutions.
Propelling Factors for Smart Digital Axle Counting Systems Growth
Several key factors are propelling the growth of the Smart Digital Axle Counting Systems market. Firstly, the global push for railway infrastructure modernization and expansion, particularly in emerging economies, is a primary driver. Secondly, increasing regulatory mandates for enhanced railway safety and the prevention of accidents are compelling operators to adopt advanced digital solutions. Thirdly, the growing demand for operational efficiency and cost reduction in railway operations incentivizes the adoption of systems that minimize manual intervention and offer predictive maintenance capabilities. Finally, technological advancements in sensor technology, data analytics, and communication networks are continuously improving the performance and expanding the applications of these systems, making them more attractive to end-users.
- Infrastructure Modernization: Significant global investments in new and upgraded railway lines.
- Safety Regulations: Stringent government regulations mandating higher safety standards.
- Operational Efficiency: Drive to reduce maintenance costs and improve track availability.
- Technological Advancements: Continuous improvements in sensor accuracy, data processing, and connectivity.
Obstacles in the Smart Digital Axle Counting Systems Market
Despite the promising growth, the Smart Digital Axle Counting Systems market faces certain obstacles. High initial investment costs for advanced digital systems can be a deterrent for smaller operators or in regions with limited capital. Moreover, the interoperability between different manufacturers' systems and legacy signaling infrastructure can pose integration challenges. Supply chain disruptions, as witnessed in recent global events, can impact the availability of critical components and lead to project delays. Finally, the resistance to change from traditional operational methods and the need for specialized training for personnel can also present hurdles to widespread adoption.
- High Initial Investment: Significant upfront capital expenditure required for advanced systems.
- Interoperability Challenges: Difficulties in integrating new systems with existing railway infrastructure.
- Supply Chain Vulnerabilities: Potential disruptions in the availability of key components.
- Resistance to Change: Inertia and the need for extensive personnel training.
Future Opportunities in Smart Digital Axle Counting Systems
The future of Smart Digital Axle Counting Systems is replete with opportunities. The ongoing digitalization of railway networks presents a vast market for advanced solutions. The increasing adoption of autonomous and semi-autonomous train operations will necessitate highly reliable and accurate axle counting systems for safe movement. Emerging markets in regions like Africa and South America offer significant untapped potential for railway development and the implementation of these technologies. Furthermore, the integration of these systems with other smart railway technologies, such as predictive maintenance platforms and traffic management systems, will create synergistic benefits and open new avenues for value creation.
- Digital Transformation: Continued investment in smart railway infrastructure globally.
- Autonomous Operations: Demand for highly reliable systems to support driverless trains.
- Emerging Markets: Untapped potential in developing railway networks.
- Synergistic Integrations: Opportunities with AI, IoT, and predictive maintenance platforms.
Major Players in the Smart Digital Axle Counting Systems Ecosystem
- Siemens
- Voestalpine
- Thales
- Frauscher
- Alstom
- CRCEF
- Scheidt & Bachmann
- Keanda Electronic Technology
- Consen Traffic Technology
- PINTSCH GmbH
- Splendor Science & Technology
- CLEARSY
- ALTPRO
Key Developments in Smart Digital Axle Counting Systems Industry
- 2023 March: Thales launches an enhanced digital axle counter with advanced diagnostics for increased reliability in complex railway environments.
- 2022 November: Frauscher introduces a new generation of on-rail axle counters designed for rapid deployment and minimal track downtime.
- 2022 July: Siemens announces a strategic partnership with a leading rail operator to implement its smart digital axle counting solutions across a major high-speed rail corridor.
- 2021 December: Voestalpine acquires a specialized sensor technology company to bolster its capabilities in digital axle counting.
- 2021 May: CRCEF secures a significant contract for the supply of digital axle counting systems for a large-scale urban metro expansion project in China.
- 2020 September: Alstom integrates advanced AI algorithms into its axle counting systems, enabling predictive maintenance capabilities.
Strategic Smart Digital Axle Counting Systems Market Forecast
The Smart Digital Axle Counting Systems market is projected for robust growth, driven by an escalating global demand for enhanced railway safety and operational efficiency. The forecast period (2025-2033) anticipates a significant CAGR of approximately 9%, pushing the market value beyond $1.2 billion. Key growth catalysts include continued investments in railway infrastructure modernization, particularly in high-speed rail and urban transit, coupled with increasingly stringent safety regulations worldwide. The ongoing technological evolution, emphasizing IoT integration, AI-driven analytics, and wireless communication, will further fuel market expansion by offering more sophisticated and cost-effective solutions. Emerging economies present substantial untapped potential, while advancements in autonomous train operations will create a critical need for highly precise and reliable axle counting technologies. The strategic focus on interoperability and the development of integrated smart railway ecosystems will also play a pivotal role in shaping the future market landscape.
Smart Digital Axle Counting Systems Segmentation
-
1. Application
- 1.1. Railway
- 1.2. Urban Rail Transit
-
2. Type
- 2.1. Rail Side Installation
- 2.2. On-Rail Installation
Smart Digital Axle Counting Systems Segmentation By Geography
-
1. North America
- 1.1. United States
- 1.2. Canada
- 1.3. Mexico
-
2. South America
- 2.1. Brazil
- 2.2. Argentina
- 2.3. Rest of South America
-
3. Europe
- 3.1. United Kingdom
- 3.2. Germany
- 3.3. France
- 3.4. Italy
- 3.5. Spain
- 3.6. Russia
- 3.7. Benelux
- 3.8. Nordics
- 3.9. Rest of Europe
-
4. Middle East & Africa
- 4.1. Turkey
- 4.2. Israel
- 4.3. GCC
- 4.4. North Africa
- 4.5. South Africa
- 4.6. Rest of Middle East & Africa
-
5. Asia Pacific
- 5.1. China
- 5.2. India
- 5.3. Japan
- 5.4. South Korea
- 5.5. ASEAN
- 5.6. Oceania
- 5.7. Rest of Asia Pacific
Smart Digital Axle Counting Systems Regional Market Share
Geographic Coverage of Smart Digital Axle Counting Systems
Smart Digital Axle Counting Systems REPORT HIGHLIGHTS
| Aspects | Details |
|---|---|
| Study Period | 2020-2034 |
| Base Year | 2025 |
| Estimated Year | 2026 |
| Forecast Period | 2026-2034 |
| Historical Period | 2020-2025 |
| Growth Rate | CAGR of 10.3% from 2020-2034 |
| Segmentation |
|
Table of Contents
- 1. Introduction
- 1.1. Research Scope
- 1.2. Market Segmentation
- 1.3. Research Methodology
- 1.4. Definitions and Assumptions
- 2. Executive Summary
- 2.1. Introduction
- 3. Market Dynamics
- 3.1. Introduction
- 3.2. Market Drivers
- 3.3. Market Restrains
- 3.4. Market Trends
- 4. Market Factor Analysis
- 4.1. Porters Five Forces
- 4.2. Supply/Value Chain
- 4.3. PESTEL analysis
- 4.4. Market Entropy
- 4.5. Patent/Trademark Analysis
- 5. Global Smart Digital Axle Counting Systems Analysis, Insights and Forecast, 2020-2032
- 5.1. Market Analysis, Insights and Forecast - by Application
- 5.1.1. Railway
- 5.1.2. Urban Rail Transit
- 5.2. Market Analysis, Insights and Forecast - by Type
- 5.2.1. Rail Side Installation
- 5.2.2. On-Rail Installation
- 5.3. Market Analysis, Insights and Forecast - by Region
- 5.3.1. North America
- 5.3.2. South America
- 5.3.3. Europe
- 5.3.4. Middle East & Africa
- 5.3.5. Asia Pacific
- 5.1. Market Analysis, Insights and Forecast - by Application
- 6. North America Smart Digital Axle Counting Systems Analysis, Insights and Forecast, 2020-2032
- 6.1. Market Analysis, Insights and Forecast - by Application
- 6.1.1. Railway
- 6.1.2. Urban Rail Transit
- 6.2. Market Analysis, Insights and Forecast - by Type
- 6.2.1. Rail Side Installation
- 6.2.2. On-Rail Installation
- 6.1. Market Analysis, Insights and Forecast - by Application
- 7. South America Smart Digital Axle Counting Systems Analysis, Insights and Forecast, 2020-2032
- 7.1. Market Analysis, Insights and Forecast - by Application
- 7.1.1. Railway
- 7.1.2. Urban Rail Transit
- 7.2. Market Analysis, Insights and Forecast - by Type
- 7.2.1. Rail Side Installation
- 7.2.2. On-Rail Installation
- 7.1. Market Analysis, Insights and Forecast - by Application
- 8. Europe Smart Digital Axle Counting Systems Analysis, Insights and Forecast, 2020-2032
- 8.1. Market Analysis, Insights and Forecast - by Application
- 8.1.1. Railway
- 8.1.2. Urban Rail Transit
- 8.2. Market Analysis, Insights and Forecast - by Type
- 8.2.1. Rail Side Installation
- 8.2.2. On-Rail Installation
- 8.1. Market Analysis, Insights and Forecast - by Application
- 9. Middle East & Africa Smart Digital Axle Counting Systems Analysis, Insights and Forecast, 2020-2032
- 9.1. Market Analysis, Insights and Forecast - by Application
- 9.1.1. Railway
- 9.1.2. Urban Rail Transit
- 9.2. Market Analysis, Insights and Forecast - by Type
- 9.2.1. Rail Side Installation
- 9.2.2. On-Rail Installation
- 9.1. Market Analysis, Insights and Forecast - by Application
- 10. Asia Pacific Smart Digital Axle Counting Systems Analysis, Insights and Forecast, 2020-2032
- 10.1. Market Analysis, Insights and Forecast - by Application
- 10.1.1. Railway
- 10.1.2. Urban Rail Transit
- 10.2. Market Analysis, Insights and Forecast - by Type
- 10.2.1. Rail Side Installation
- 10.2.2. On-Rail Installation
- 10.1. Market Analysis, Insights and Forecast - by Application
- 11. Competitive Analysis
- 11.1. Global Market Share Analysis 2025
- 11.2. Company Profiles
- 11.2.1 Siemens
- 11.2.1.1. Overview
- 11.2.1.2. Products
- 11.2.1.3. SWOT Analysis
- 11.2.1.4. Recent Developments
- 11.2.1.5. Financials (Based on Availability)
- 11.2.2 Voestalpine
- 11.2.2.1. Overview
- 11.2.2.2. Products
- 11.2.2.3. SWOT Analysis
- 11.2.2.4. Recent Developments
- 11.2.2.5. Financials (Based on Availability)
- 11.2.3 Thales
- 11.2.3.1. Overview
- 11.2.3.2. Products
- 11.2.3.3. SWOT Analysis
- 11.2.3.4. Recent Developments
- 11.2.3.5. Financials (Based on Availability)
- 11.2.4 Frauscher
- 11.2.4.1. Overview
- 11.2.4.2. Products
- 11.2.4.3. SWOT Analysis
- 11.2.4.4. Recent Developments
- 11.2.4.5. Financials (Based on Availability)
- 11.2.5 Alstom
- 11.2.5.1. Overview
- 11.2.5.2. Products
- 11.2.5.3. SWOT Analysis
- 11.2.5.4. Recent Developments
- 11.2.5.5. Financials (Based on Availability)
- 11.2.6 CRCEF
- 11.2.6.1. Overview
- 11.2.6.2. Products
- 11.2.6.3. SWOT Analysis
- 11.2.6.4. Recent Developments
- 11.2.6.5. Financials (Based on Availability)
- 11.2.7 Scheidt & Bachmann
- 11.2.7.1. Overview
- 11.2.7.2. Products
- 11.2.7.3. SWOT Analysis
- 11.2.7.4. Recent Developments
- 11.2.7.5. Financials (Based on Availability)
- 11.2.8 Keanda Electronic Technology
- 11.2.8.1. Overview
- 11.2.8.2. Products
- 11.2.8.3. SWOT Analysis
- 11.2.8.4. Recent Developments
- 11.2.8.5. Financials (Based on Availability)
- 11.2.9 Consen Traffic Technology
- 11.2.9.1. Overview
- 11.2.9.2. Products
- 11.2.9.3. SWOT Analysis
- 11.2.9.4. Recent Developments
- 11.2.9.5. Financials (Based on Availability)
- 11.2.10 PINTSCH GmbH
- 11.2.10.1. Overview
- 11.2.10.2. Products
- 11.2.10.3. SWOT Analysis
- 11.2.10.4. Recent Developments
- 11.2.10.5. Financials (Based on Availability)
- 11.2.11 Splendor Science & Technology
- 11.2.11.1. Overview
- 11.2.11.2. Products
- 11.2.11.3. SWOT Analysis
- 11.2.11.4. Recent Developments
- 11.2.11.5. Financials (Based on Availability)
- 11.2.12 CLEARSY
- 11.2.12.1. Overview
- 11.2.12.2. Products
- 11.2.12.3. SWOT Analysis
- 11.2.12.4. Recent Developments
- 11.2.12.5. Financials (Based on Availability)
- 11.2.13 ALTPRO
- 11.2.13.1. Overview
- 11.2.13.2. Products
- 11.2.13.3. SWOT Analysis
- 11.2.13.4. Recent Developments
- 11.2.13.5. Financials (Based on Availability)
- 11.2.1 Siemens
List of Figures
- Figure 1: Global Smart Digital Axle Counting Systems Revenue Breakdown (million, %) by Region 2025 & 2033
- Figure 2: Global Smart Digital Axle Counting Systems Volume Breakdown (K, %) by Region 2025 & 2033
- Figure 3: North America Smart Digital Axle Counting Systems Revenue (million), by Application 2025 & 2033
- Figure 4: North America Smart Digital Axle Counting Systems Volume (K), by Application 2025 & 2033
- Figure 5: North America Smart Digital Axle Counting Systems Revenue Share (%), by Application 2025 & 2033
- Figure 6: North America Smart Digital Axle Counting Systems Volume Share (%), by Application 2025 & 2033
- Figure 7: North America Smart Digital Axle Counting Systems Revenue (million), by Type 2025 & 2033
- Figure 8: North America Smart Digital Axle Counting Systems Volume (K), by Type 2025 & 2033
- Figure 9: North America Smart Digital Axle Counting Systems Revenue Share (%), by Type 2025 & 2033
- Figure 10: North America Smart Digital Axle Counting Systems Volume Share (%), by Type 2025 & 2033
- Figure 11: North America Smart Digital Axle Counting Systems Revenue (million), by Country 2025 & 2033
- Figure 12: North America Smart Digital Axle Counting Systems Volume (K), by Country 2025 & 2033
- Figure 13: North America Smart Digital Axle Counting Systems Revenue Share (%), by Country 2025 & 2033
- Figure 14: North America Smart Digital Axle Counting Systems Volume Share (%), by Country 2025 & 2033
- Figure 15: South America Smart Digital Axle Counting Systems Revenue (million), by Application 2025 & 2033
- Figure 16: South America Smart Digital Axle Counting Systems Volume (K), by Application 2025 & 2033
- Figure 17: South America Smart Digital Axle Counting Systems Revenue Share (%), by Application 2025 & 2033
- Figure 18: South America Smart Digital Axle Counting Systems Volume Share (%), by Application 2025 & 2033
- Figure 19: South America Smart Digital Axle Counting Systems Revenue (million), by Type 2025 & 2033
- Figure 20: South America Smart Digital Axle Counting Systems Volume (K), by Type 2025 & 2033
- Figure 21: South America Smart Digital Axle Counting Systems Revenue Share (%), by Type 2025 & 2033
- Figure 22: South America Smart Digital Axle Counting Systems Volume Share (%), by Type 2025 & 2033
- Figure 23: South America Smart Digital Axle Counting Systems Revenue (million), by Country 2025 & 2033
- Figure 24: South America Smart Digital Axle Counting Systems Volume (K), by Country 2025 & 2033
- Figure 25: South America Smart Digital Axle Counting Systems Revenue Share (%), by Country 2025 & 2033
- Figure 26: South America Smart Digital Axle Counting Systems Volume Share (%), by Country 2025 & 2033
- Figure 27: Europe Smart Digital Axle Counting Systems Revenue (million), by Application 2025 & 2033
- Figure 28: Europe Smart Digital Axle Counting Systems Volume (K), by Application 2025 & 2033
- Figure 29: Europe Smart Digital Axle Counting Systems Revenue Share (%), by Application 2025 & 2033
- Figure 30: Europe Smart Digital Axle Counting Systems Volume Share (%), by Application 2025 & 2033
- Figure 31: Europe Smart Digital Axle Counting Systems Revenue (million), by Type 2025 & 2033
- Figure 32: Europe Smart Digital Axle Counting Systems Volume (K), by Type 2025 & 2033
- Figure 33: Europe Smart Digital Axle Counting Systems Revenue Share (%), by Type 2025 & 2033
- Figure 34: Europe Smart Digital Axle Counting Systems Volume Share (%), by Type 2025 & 2033
- Figure 35: Europe Smart Digital Axle Counting Systems Revenue (million), by Country 2025 & 2033
- Figure 36: Europe Smart Digital Axle Counting Systems Volume (K), by Country 2025 & 2033
- Figure 37: Europe Smart Digital Axle Counting Systems Revenue Share (%), by Country 2025 & 2033
- Figure 38: Europe Smart Digital Axle Counting Systems Volume Share (%), by Country 2025 & 2033
- Figure 39: Middle East & Africa Smart Digital Axle Counting Systems Revenue (million), by Application 2025 & 2033
- Figure 40: Middle East & Africa Smart Digital Axle Counting Systems Volume (K), by Application 2025 & 2033
- Figure 41: Middle East & Africa Smart Digital Axle Counting Systems Revenue Share (%), by Application 2025 & 2033
- Figure 42: Middle East & Africa Smart Digital Axle Counting Systems Volume Share (%), by Application 2025 & 2033
- Figure 43: Middle East & Africa Smart Digital Axle Counting Systems Revenue (million), by Type 2025 & 2033
- Figure 44: Middle East & Africa Smart Digital Axle Counting Systems Volume (K), by Type 2025 & 2033
- Figure 45: Middle East & Africa Smart Digital Axle Counting Systems Revenue Share (%), by Type 2025 & 2033
- Figure 46: Middle East & Africa Smart Digital Axle Counting Systems Volume Share (%), by Type 2025 & 2033
- Figure 47: Middle East & Africa Smart Digital Axle Counting Systems Revenue (million), by Country 2025 & 2033
- Figure 48: Middle East & Africa Smart Digital Axle Counting Systems Volume (K), by Country 2025 & 2033
- Figure 49: Middle East & Africa Smart Digital Axle Counting Systems Revenue Share (%), by Country 2025 & 2033
- Figure 50: Middle East & Africa Smart Digital Axle Counting Systems Volume Share (%), by Country 2025 & 2033
- Figure 51: Asia Pacific Smart Digital Axle Counting Systems Revenue (million), by Application 2025 & 2033
- Figure 52: Asia Pacific Smart Digital Axle Counting Systems Volume (K), by Application 2025 & 2033
- Figure 53: Asia Pacific Smart Digital Axle Counting Systems Revenue Share (%), by Application 2025 & 2033
- Figure 54: Asia Pacific Smart Digital Axle Counting Systems Volume Share (%), by Application 2025 & 2033
- Figure 55: Asia Pacific Smart Digital Axle Counting Systems Revenue (million), by Type 2025 & 2033
- Figure 56: Asia Pacific Smart Digital Axle Counting Systems Volume (K), by Type 2025 & 2033
- Figure 57: Asia Pacific Smart Digital Axle Counting Systems Revenue Share (%), by Type 2025 & 2033
- Figure 58: Asia Pacific Smart Digital Axle Counting Systems Volume Share (%), by Type 2025 & 2033
- Figure 59: Asia Pacific Smart Digital Axle Counting Systems Revenue (million), by Country 2025 & 2033
- Figure 60: Asia Pacific Smart Digital Axle Counting Systems Volume (K), by Country 2025 & 2033
- Figure 61: Asia Pacific Smart Digital Axle Counting Systems Revenue Share (%), by Country 2025 & 2033
- Figure 62: Asia Pacific Smart Digital Axle Counting Systems Volume Share (%), by Country 2025 & 2033
List of Tables
- Table 1: Global Smart Digital Axle Counting Systems Revenue million Forecast, by Application 2020 & 2033
- Table 2: Global Smart Digital Axle Counting Systems Volume K Forecast, by Application 2020 & 2033
- Table 3: Global Smart Digital Axle Counting Systems Revenue million Forecast, by Type 2020 & 2033
- Table 4: Global Smart Digital Axle Counting Systems Volume K Forecast, by Type 2020 & 2033
- Table 5: Global Smart Digital Axle Counting Systems Revenue million Forecast, by Region 2020 & 2033
- Table 6: Global Smart Digital Axle Counting Systems Volume K Forecast, by Region 2020 & 2033
- Table 7: Global Smart Digital Axle Counting Systems Revenue million Forecast, by Application 2020 & 2033
- Table 8: Global Smart Digital Axle Counting Systems Volume K Forecast, by Application 2020 & 2033
- Table 9: Global Smart Digital Axle Counting Systems Revenue million Forecast, by Type 2020 & 2033
- Table 10: Global Smart Digital Axle Counting Systems Volume K Forecast, by Type 2020 & 2033
- Table 11: Global Smart Digital Axle Counting Systems Revenue million Forecast, by Country 2020 & 2033
- Table 12: Global Smart Digital Axle Counting Systems Volume K Forecast, by Country 2020 & 2033
- Table 13: United States Smart Digital Axle Counting Systems Revenue (million) Forecast, by Application 2020 & 2033
- Table 14: United States Smart Digital Axle Counting Systems Volume (K) Forecast, by Application 2020 & 2033
- Table 15: Canada Smart Digital Axle Counting Systems Revenue (million) Forecast, by Application 2020 & 2033
- Table 16: Canada Smart Digital Axle Counting Systems Volume (K) Forecast, by Application 2020 & 2033
- Table 17: Mexico Smart Digital Axle Counting Systems Revenue (million) Forecast, by Application 2020 & 2033
- Table 18: Mexico Smart Digital Axle Counting Systems Volume (K) Forecast, by Application 2020 & 2033
- Table 19: Global Smart Digital Axle Counting Systems Revenue million Forecast, by Application 2020 & 2033
- Table 20: Global Smart Digital Axle Counting Systems Volume K Forecast, by Application 2020 & 2033
- Table 21: Global Smart Digital Axle Counting Systems Revenue million Forecast, by Type 2020 & 2033
- Table 22: Global Smart Digital Axle Counting Systems Volume K Forecast, by Type 2020 & 2033
- Table 23: Global Smart Digital Axle Counting Systems Revenue million Forecast, by Country 2020 & 2033
- Table 24: Global Smart Digital Axle Counting Systems Volume K Forecast, by Country 2020 & 2033
- Table 25: Brazil Smart Digital Axle Counting Systems Revenue (million) Forecast, by Application 2020 & 2033
- Table 26: Brazil Smart Digital Axle Counting Systems Volume (K) Forecast, by Application 2020 & 2033
- Table 27: Argentina Smart Digital Axle Counting Systems Revenue (million) Forecast, by Application 2020 & 2033
- Table 28: Argentina Smart Digital Axle Counting Systems Volume (K) Forecast, by Application 2020 & 2033
- Table 29: Rest of South America Smart Digital Axle Counting Systems Revenue (million) Forecast, by Application 2020 & 2033
- Table 30: Rest of South America Smart Digital Axle Counting Systems Volume (K) Forecast, by Application 2020 & 2033
- Table 31: Global Smart Digital Axle Counting Systems Revenue million Forecast, by Application 2020 & 2033
- Table 32: Global Smart Digital Axle Counting Systems Volume K Forecast, by Application 2020 & 2033
- Table 33: Global Smart Digital Axle Counting Systems Revenue million Forecast, by Type 2020 & 2033
- Table 34: Global Smart Digital Axle Counting Systems Volume K Forecast, by Type 2020 & 2033
- Table 35: Global Smart Digital Axle Counting Systems Revenue million Forecast, by Country 2020 & 2033
- Table 36: Global Smart Digital Axle Counting Systems Volume K Forecast, by Country 2020 & 2033
- Table 37: United Kingdom Smart Digital Axle Counting Systems Revenue (million) Forecast, by Application 2020 & 2033
- Table 38: United Kingdom Smart Digital Axle Counting Systems Volume (K) Forecast, by Application 2020 & 2033
- Table 39: Germany Smart Digital Axle Counting Systems Revenue (million) Forecast, by Application 2020 & 2033
- Table 40: Germany Smart Digital Axle Counting Systems Volume (K) Forecast, by Application 2020 & 2033
- Table 41: France Smart Digital Axle Counting Systems Revenue (million) Forecast, by Application 2020 & 2033
- Table 42: France Smart Digital Axle Counting Systems Volume (K) Forecast, by Application 2020 & 2033
- Table 43: Italy Smart Digital Axle Counting Systems Revenue (million) Forecast, by Application 2020 & 2033
- Table 44: Italy Smart Digital Axle Counting Systems Volume (K) Forecast, by Application 2020 & 2033
- Table 45: Spain Smart Digital Axle Counting Systems Revenue (million) Forecast, by Application 2020 & 2033
- Table 46: Spain Smart Digital Axle Counting Systems Volume (K) Forecast, by Application 2020 & 2033
- Table 47: Russia Smart Digital Axle Counting Systems Revenue (million) Forecast, by Application 2020 & 2033
- Table 48: Russia Smart Digital Axle Counting Systems Volume (K) Forecast, by Application 2020 & 2033
- Table 49: Benelux Smart Digital Axle Counting Systems Revenue (million) Forecast, by Application 2020 & 2033
- Table 50: Benelux Smart Digital Axle Counting Systems Volume (K) Forecast, by Application 2020 & 2033
- Table 51: Nordics Smart Digital Axle Counting Systems Revenue (million) Forecast, by Application 2020 & 2033
- Table 52: Nordics Smart Digital Axle Counting Systems Volume (K) Forecast, by Application 2020 & 2033
- Table 53: Rest of Europe Smart Digital Axle Counting Systems Revenue (million) Forecast, by Application 2020 & 2033
- Table 54: Rest of Europe Smart Digital Axle Counting Systems Volume (K) Forecast, by Application 2020 & 2033
- Table 55: Global Smart Digital Axle Counting Systems Revenue million Forecast, by Application 2020 & 2033
- Table 56: Global Smart Digital Axle Counting Systems Volume K Forecast, by Application 2020 & 2033
- Table 57: Global Smart Digital Axle Counting Systems Revenue million Forecast, by Type 2020 & 2033
- Table 58: Global Smart Digital Axle Counting Systems Volume K Forecast, by Type 2020 & 2033
- Table 59: Global Smart Digital Axle Counting Systems Revenue million Forecast, by Country 2020 & 2033
- Table 60: Global Smart Digital Axle Counting Systems Volume K Forecast, by Country 2020 & 2033
- Table 61: Turkey Smart Digital Axle Counting Systems Revenue (million) Forecast, by Application 2020 & 2033
- Table 62: Turkey Smart Digital Axle Counting Systems Volume (K) Forecast, by Application 2020 & 2033
- Table 63: Israel Smart Digital Axle Counting Systems Revenue (million) Forecast, by Application 2020 & 2033
- Table 64: Israel Smart Digital Axle Counting Systems Volume (K) Forecast, by Application 2020 & 2033
- Table 65: GCC Smart Digital Axle Counting Systems Revenue (million) Forecast, by Application 2020 & 2033
- Table 66: GCC Smart Digital Axle Counting Systems Volume (K) Forecast, by Application 2020 & 2033
- Table 67: North Africa Smart Digital Axle Counting Systems Revenue (million) Forecast, by Application 2020 & 2033
- Table 68: North Africa Smart Digital Axle Counting Systems Volume (K) Forecast, by Application 2020 & 2033
- Table 69: South Africa Smart Digital Axle Counting Systems Revenue (million) Forecast, by Application 2020 & 2033
- Table 70: South Africa Smart Digital Axle Counting Systems Volume (K) Forecast, by Application 2020 & 2033
- Table 71: Rest of Middle East & Africa Smart Digital Axle Counting Systems Revenue (million) Forecast, by Application 2020 & 2033
- Table 72: Rest of Middle East & Africa Smart Digital Axle Counting Systems Volume (K) Forecast, by Application 2020 & 2033
- Table 73: Global Smart Digital Axle Counting Systems Revenue million Forecast, by Application 2020 & 2033
- Table 74: Global Smart Digital Axle Counting Systems Volume K Forecast, by Application 2020 & 2033
- Table 75: Global Smart Digital Axle Counting Systems Revenue million Forecast, by Type 2020 & 2033
- Table 76: Global Smart Digital Axle Counting Systems Volume K Forecast, by Type 2020 & 2033
- Table 77: Global Smart Digital Axle Counting Systems Revenue million Forecast, by Country 2020 & 2033
- Table 78: Global Smart Digital Axle Counting Systems Volume K Forecast, by Country 2020 & 2033
- Table 79: China Smart Digital Axle Counting Systems Revenue (million) Forecast, by Application 2020 & 2033
- Table 80: China Smart Digital Axle Counting Systems Volume (K) Forecast, by Application 2020 & 2033
- Table 81: India Smart Digital Axle Counting Systems Revenue (million) Forecast, by Application 2020 & 2033
- Table 82: India Smart Digital Axle Counting Systems Volume (K) Forecast, by Application 2020 & 2033
- Table 83: Japan Smart Digital Axle Counting Systems Revenue (million) Forecast, by Application 2020 & 2033
- Table 84: Japan Smart Digital Axle Counting Systems Volume (K) Forecast, by Application 2020 & 2033
- Table 85: South Korea Smart Digital Axle Counting Systems Revenue (million) Forecast, by Application 2020 & 2033
- Table 86: South Korea Smart Digital Axle Counting Systems Volume (K) Forecast, by Application 2020 & 2033
- Table 87: ASEAN Smart Digital Axle Counting Systems Revenue (million) Forecast, by Application 2020 & 2033
- Table 88: ASEAN Smart Digital Axle Counting Systems Volume (K) Forecast, by Application 2020 & 2033
- Table 89: Oceania Smart Digital Axle Counting Systems Revenue (million) Forecast, by Application 2020 & 2033
- Table 90: Oceania Smart Digital Axle Counting Systems Volume (K) Forecast, by Application 2020 & 2033
- Table 91: Rest of Asia Pacific Smart Digital Axle Counting Systems Revenue (million) Forecast, by Application 2020 & 2033
- Table 92: Rest of Asia Pacific Smart Digital Axle Counting Systems Volume (K) Forecast, by Application 2020 & 2033
Frequently Asked Questions
1. What is the projected Compound Annual Growth Rate (CAGR) of the Smart Digital Axle Counting Systems?
The projected CAGR is approximately 10.3%.
2. Which companies are prominent players in the Smart Digital Axle Counting Systems?
Key companies in the market include Siemens, Voestalpine, Thales, Frauscher, Alstom, CRCEF, Scheidt & Bachmann, Keanda Electronic Technology, Consen Traffic Technology, PINTSCH GmbH, Splendor Science & Technology, CLEARSY, ALTPRO.
3. What are the main segments of the Smart Digital Axle Counting Systems?
The market segments include Application, Type.
4. Can you provide details about the market size?
The market size is estimated to be USD 789 million as of 2022.
5. What are some drivers contributing to market growth?
N/A
6. What are the notable trends driving market growth?
N/A
7. Are there any restraints impacting market growth?
N/A
8. Can you provide examples of recent developments in the market?
N/A
9. What pricing options are available for accessing the report?
Pricing options include single-user, multi-user, and enterprise licenses priced at USD 3950.00, USD 5925.00, and USD 7900.00 respectively.
10. Is the market size provided in terms of value or volume?
The market size is provided in terms of value, measured in million and volume, measured in K.
11. Are there any specific market keywords associated with the report?
Yes, the market keyword associated with the report is "Smart Digital Axle Counting Systems," which aids in identifying and referencing the specific market segment covered.
12. How do I determine which pricing option suits my needs best?
The pricing options vary based on user requirements and access needs. Individual users may opt for single-user licenses, while businesses requiring broader access may choose multi-user or enterprise licenses for cost-effective access to the report.
13. Are there any additional resources or data provided in the Smart Digital Axle Counting Systems report?
While the report offers comprehensive insights, it's advisable to review the specific contents or supplementary materials provided to ascertain if additional resources or data are available.
14. How can I stay updated on further developments or reports in the Smart Digital Axle Counting Systems?
To stay informed about further developments, trends, and reports in the Smart Digital Axle Counting Systems, consider subscribing to industry newsletters, following relevant companies and organizations, or regularly checking reputable industry news sources and publications.
Methodology
Step 1 - Identification of Relevant Samples Size from Population Database


Step 2 - Approaches for Defining Global Market Size (Value, Volume* & Price*)

Note*: In applicable scenarios
Step 3 - Data Sources
Primary Research
- Web Analytics
- Survey Reports
- Research Institute
- Latest Research Reports
- Opinion Leaders
Secondary Research
- Annual Reports
- White Paper
- Latest Press Release
- Industry Association
- Paid Database
- Investor Presentations

Step 4 - Data Triangulation
Involves using different sources of information in order to increase the validity of a study
These sources are likely to be stakeholders in a program - participants, other researchers, program staff, other community members, and so on.
Then we put all data in single framework & apply various statistical tools to find out the dynamic on the market.
During the analysis stage, feedback from the stakeholder groups would be compared to determine areas of agreement as well as areas of divergence