

Key Insights
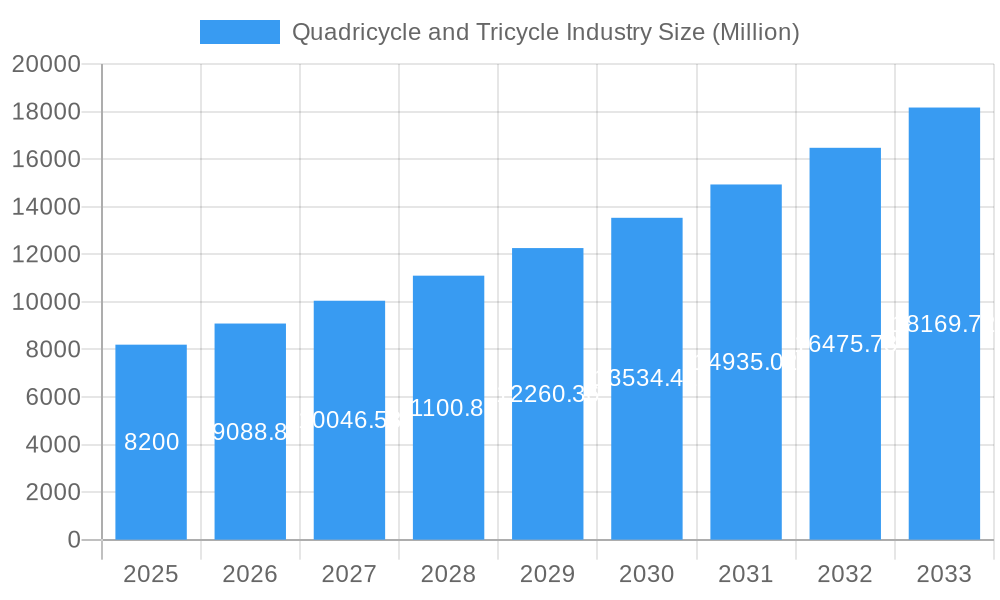
The global quadricycle and tricycle market, valued at $8.20 billion in 2025, is projected to experience robust growth, driven by a compound annual growth rate (CAGR) of 10.84% from 2025 to 2033. This expansion is fueled by several key factors. Increasing urbanization in developing nations leads to a surge in demand for affordable and efficient last-mile transportation solutions, making quadricycles and tricycles attractive alternatives to cars and motorcycles. Furthermore, the rising popularity of e-commerce and delivery services is boosting the commercial segment's growth, with businesses increasingly relying on these vehicles for efficient logistics. Government initiatives promoting sustainable transportation, coupled with advancements in electric powertrain technology, are also contributing to the market's upward trajectory. The segment breakdown reveals a significant contribution from the personal segment, driven by affordability and maneuverability, particularly in congested urban areas. Electric quadricycles and tricycles are gaining traction due to environmental concerns and government incentives, while gasoline-powered models remain prevalent in regions with limited charging infrastructure. The market's regional landscape shows strong growth potential in Asia-Pacific, particularly in India and China, owing to high population density and growing disposable incomes. However, stringent emission regulations and safety standards in developed markets like North America and Europe pose challenges, necessitating manufacturers to adapt and innovate to meet compliance requirements.
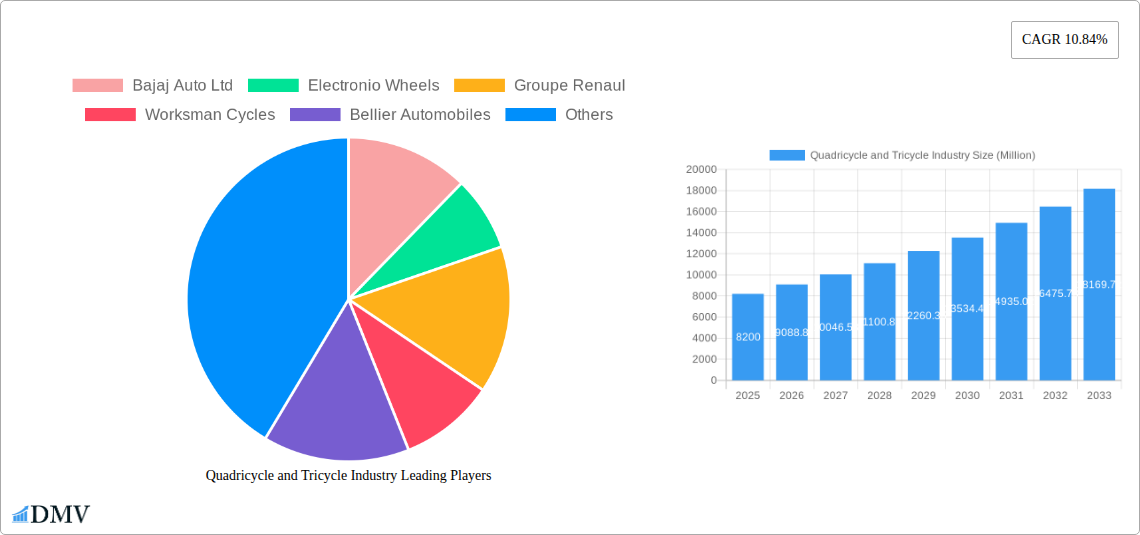
Quadricycle and Tricycle Industry Market Size (In Billion)
Competitive dynamics within the market are shaped by established players like Bajaj Auto and Mahindra & Mahindra, alongside emerging players focusing on electric vehicle technology. The market is witnessing increased consolidation as larger players acquire smaller companies to expand their product portfolios and geographic reach. Future market growth will depend on continued technological innovation, particularly in battery technology and charging infrastructure for electric vehicles. Furthermore, addressing concerns related to safety and regulatory compliance will be crucial for sustained market expansion. Manufacturers are likely to focus on developing improved safety features and complying with evolving regulatory frameworks in different regions to maintain market competitiveness and capture a larger share of the expanding market. The continued rise of e-commerce and last-mile delivery services will further propel the demand for commercial quadricycles and tricycles, while advancements in lightweight materials and design will contribute to increased efficiency and reduced operating costs.
Quadricycle and Tricycle Industry Company Market Share
Quadricycle and Tricycle Industry Market Report: 2019-2033
This comprehensive report provides a detailed analysis of the global Quadricycle and Tricycle industry, offering invaluable insights for stakeholders seeking to understand market dynamics, future trends, and investment opportunities. The report covers the period from 2019 to 2033, with a focus on the estimated year 2025 and a forecast period spanning 2025-2033. Key players analyzed include Bajaj Auto Ltd, Electronio Wheels, Groupe Renault, Worksman Cycles, Bellier Automobiles, Mahindra and Mahindra, Light Foot Cycle, Automobiles CHATENET, Estrima SRL, Daimus, Ligier Group, and Aixam-Mega. The market is segmented by application type (personal, commercial), vehicle type (quadricycle, tricycle), and power source type (electric, gasoline, solar). The report projects a market value exceeding XX Million by 2033.
Quadricycle and Tricycle Industry Market Composition & Trends
This section delves into the competitive landscape of the quadricycle and tricycle industry, evaluating market concentration, innovation drivers, regulatory frameworks, and market dynamics. The report examines the market share distribution among key players, revealing the dominance of established manufacturers like Bajaj Auto Ltd and Mahindra and Mahindra. The analysis also explores the impact of mergers and acquisitions (M&A) activities, including deal values (estimated at XX Million in the period 2019-2024), on the industry structure.
- Market Concentration: Highly fragmented with a few dominant players controlling approximately xx% of the market share.
- Innovation Catalysts: Growing demand for electric vehicles, advancements in battery technology, and government incentives driving innovation.
- Regulatory Landscape: Varying regulations across different regions impacting market entry and vehicle specifications.
- Substitute Products: Competition from motorcycles and small cars, particularly in personal use segments.
- End-User Profiles: Diverse user base including personal users, delivery services, and commercial fleets.
- M&A Activities: Significant consolidation expected with larger players acquiring smaller companies to expand their product portfolios and market reach. The total value of M&A deals during the historical period is estimated at XX Million.
Quadricycle and Tricycle Industry Evolution
This section charts the evolution of the quadricycle and tricycle industry from 2019 to 2033. The analysis encompasses market growth trajectories, technological advancements, and evolving consumer preferences. The global market experienced a Compound Annual Growth Rate (CAGR) of xx% during the historical period (2019-2024) and is projected to maintain a CAGR of xx% during the forecast period (2025-2033). This growth is driven by factors such as increasing urbanization, rising disposable incomes in developing economies, and the growing preference for fuel-efficient and affordable transportation solutions. The adoption of electric powertrains is accelerating, with a significant increase in the market share of electric quadricycles and tricycles anticipated in the coming years. Specific data points regarding adoption rates and growth in specific regions are detailed within the full report.
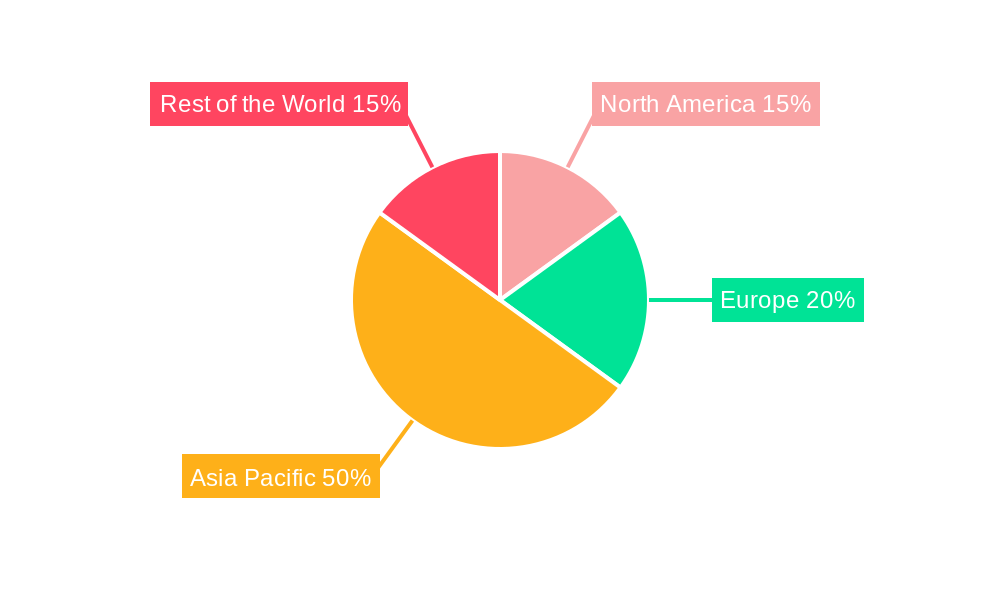
Leading Regions, Countries, or Segments in Quadricycle and Tricycle Industry
This section identifies the leading regions, countries, and segments within the quadricycle and tricycle market based on application type, vehicle type, and power source. Asia-Pacific, particularly India and Southeast Asia, is identified as a dominant region, driven by high population density, robust economic growth, and increasing demand for affordable personal and commercial transportation.
- By Application Type: The commercial segment holds a larger market share, driven by the growing demand for last-mile delivery services and small goods transportation.
- By Vehicle Type: Quadricycles hold a larger market share globally compared to tricycles.
- By Power Source Type: Gasoline-powered vehicles currently dominate, but electric vehicles are gaining traction fueled by government subsidies and environmental concerns.
Key Drivers for Regional Dominance:
- India: Strong government support for electric mobility, low manufacturing costs, and a large consumer base.
- Southeast Asia: Rapid urbanization, growing middle class, and increasing demand for affordable transport.
- Europe: Stricter emission regulations driving the adoption of electric vehicles.
Quadricycle and Tricycle Industry Product Innovations
The quadricycle and tricycle industry is witnessing significant product innovations, focusing on improved safety features, enhanced fuel efficiency, and increased comfort. Manufacturers are incorporating advanced technologies such as electric powertrains, regenerative braking systems, and lightweight materials to improve performance and reduce environmental impact. Unique selling propositions include features such as improved maneuverability, enhanced cargo capacity, and integration with smart technologies for tracking and fleet management.
Propelling Factors for Quadricycle and Tricycle Industry Growth
Several factors are propelling the growth of the quadricycle and tricycle industry. Technological advancements, such as the development of efficient electric motors and battery technology, are making these vehicles more attractive. Favorable government policies, including subsidies and tax incentives for electric vehicles, are boosting market adoption. Furthermore, the increasing need for affordable and last-mile delivery solutions is driving demand, particularly in urban areas.
Obstacles in the Quadricycle and Tricycle Industry Market
Despite the positive growth outlook, the quadricycle and tricycle industry faces several challenges. Stricter emission regulations in some regions increase manufacturing costs. Fluctuations in raw material prices and supply chain disruptions pose risks. Intense competition from other modes of transportation, such as motorcycles and small cars, puts pressure on pricing and market share.
Future Opportunities in Quadricycle and Tricycle Industry
The future of the quadricycle and tricycle industry presents exciting opportunities. Expansion into new markets, particularly in developing countries with limited public transportation infrastructure, holds significant potential. The integration of advanced technologies, such as autonomous driving capabilities and connected vehicle systems, can create new revenue streams and enhance user experience. Growing consumer demand for sustainable transportation solutions will further drive the adoption of electric vehicles.
Major Players in the Quadricycle and Tricycle Industry Ecosystem
- Bajaj Auto Ltd
- Electronio Wheels
- Groupe Renault
- Worksman Cycles
- Bellier Automobiles
- Mahindra and Mahindra
- Light Foot Cycle
- Automobiles CHATENET
- Estrima SRL
- Daimus
- Ligier Group
- Aixam-Mega
Key Developments in Quadricycle and Tricycle Industry Industry
- 2021 Q3: Bajaj Auto Ltd launched a new electric tricycle model.
- 2022 Q1: Mahindra and Mahindra announced a strategic partnership to expand its electric vehicle portfolio.
- 2023 Q2: Groupe Renault invested in a new electric quadricycle production facility. (Further details on specific investments and partnerships are included in the full report.)
Strategic Quadricycle and Tricycle Industry Market Forecast
The quadricycle and tricycle industry is poised for significant growth in the coming years, driven by technological advancements, favorable government policies, and increasing demand for affordable transportation solutions. The market is expected to witness a substantial increase in the adoption of electric vehicles, alongside continuous innovation in terms of safety, performance, and features. The focus on last-mile delivery solutions will further propel market expansion, leading to strong revenue growth throughout the forecast period.
Quadricycle and Tricycle Industry Segmentation
-
1. Power Source Type
- 1.1. Electric
- 1.2. Gasoline
- 1.3. Solar
-
2. Application Type
- 2.1. Personal
- 2.2. Commercial
-
3. Vehicle Type
- 3.1. Quadricycle
- 3.2. Tricycle
Quadricycle and Tricycle Industry Segmentation By Geography
-
1. North America
- 1.1. United States
- 1.2. Canada
- 1.3. Rest of North America
-
2. Europe
- 2.1. Germany
- 2.2. United Kingdom
- 2.3. France
- 2.4. Italy
- 2.5. Rest of Europe
-
3. Asia Pacific
- 3.1. China
- 3.2. Japan
- 3.3. India
- 3.4. South Korea
- 3.5. Rest of Asia Pacific
-
4. Rest of the World
- 4.1. Brazil
- 4.2. South Africa
- 4.3. United Arab Emirates
- 4.4. Other Countries
Quadricycle and Tricycle Industry Regional Market Share
Geographic Coverage of Quadricycle and Tricycle Industry
Quadricycle and Tricycle Industry REPORT HIGHLIGHTS
| Aspects | Details |
|---|---|
| Study Period | 2020-2034 |
| Base Year | 2025 |
| Estimated Year | 2026 |
| Forecast Period | 2026-2034 |
| Historical Period | 2020-2025 |
| Growth Rate | CAGR of 10.84% from 2020-2034 |
| Segmentation |
|
Table of Contents
- 1. Introduction
- 1.1. Research Scope
- 1.2. Market Segmentation
- 1.3. Research Objective
- 1.4. Definitions and Assumptions
- 2. Executive Summary
- 2.1. Market Snapshot
- 3. Market Dynamics
- 3.1. Market Drivers
- 3.2. Market Restrains
- 3.3. Market Trends
- 3.4. Market Opportunities
- 4. Market Factor Analysis
- 4.1. Porters Five Forces
- 4.1.1. Bargaining Power of Suppliers
- 4.1.2. Bargaining Power of Buyers
- 4.1.3. Threat of New Entrants
- 4.1.4. Threat of Substitutes
- 4.1.5. Competitive Rivalry
- 4.2. PESTEL analysis
- 4.3. BCG Analysis
- 4.3.1. Stars (High Growth, High Market Share)
- 4.3.2. Cash Cows (Low Growth, High Market Share)
- 4.3.3. Question Mark (High Growth, Low Market Share)
- 4.3.4. Dogs (Low Growth, Low Market Share)
- 4.4. Ansoff Matrix Analysis
- 4.5. Supply Chain Analysis
- 4.6. Regulatory Landscape
- 4.7. Current Market Potential and Opportunity Assessment (TAM–SAM–SOM Framework)
- 4.8. DMV Analyst Note
- 4.1. Porters Five Forces
- 5. Market Analysis, Insights and Forecast 2021-2033
- 5.1. Market Analysis, Insights and Forecast - by Power Source Type
- 5.1.1. Electric
- 5.1.2. Gasoline
- 5.1.3. Solar
- 5.2. Market Analysis, Insights and Forecast - by Application Type
- 5.2.1. Personal
- 5.2.2. Commercial
- 5.3. Market Analysis, Insights and Forecast - by Vehicle Type
- 5.3.1. Quadricycle
- 5.3.2. Tricycle
- 5.4. Market Analysis, Insights and Forecast - by Region
- 5.4.1. North America
- 5.4.2. Europe
- 5.4.3. Asia Pacific
- 5.4.4. Rest of the World
- 5.1. Market Analysis, Insights and Forecast - by Power Source Type
- 6. Global Quadricycle and Tricycle Industry Analysis, Insights and Forecast, 2021-2033
- 6.1. Market Analysis, Insights and Forecast - by Power Source Type
- 6.1.1. Electric
- 6.1.2. Gasoline
- 6.1.3. Solar
- 6.2. Market Analysis, Insights and Forecast - by Application Type
- 6.2.1. Personal
- 6.2.2. Commercial
- 6.3. Market Analysis, Insights and Forecast - by Vehicle Type
- 6.3.1. Quadricycle
- 6.3.2. Tricycle
- 6.1. Market Analysis, Insights and Forecast - by Power Source Type
- 7. North America Quadricycle and Tricycle Industry Analysis, Insights and Forecast, 2020-2032
- 7.1. Market Analysis, Insights and Forecast - by Power Source Type
- 7.1.1. Electric
- 7.1.2. Gasoline
- 7.1.3. Solar
- 7.2. Market Analysis, Insights and Forecast - by Application Type
- 7.2.1. Personal
- 7.2.2. Commercial
- 7.3. Market Analysis, Insights and Forecast - by Vehicle Type
- 7.3.1. Quadricycle
- 7.3.2. Tricycle
- 7.1. Market Analysis, Insights and Forecast - by Power Source Type
- 8. Europe Quadricycle and Tricycle Industry Analysis, Insights and Forecast, 2020-2032
- 8.1. Market Analysis, Insights and Forecast - by Power Source Type
- 8.1.1. Electric
- 8.1.2. Gasoline
- 8.1.3. Solar
- 8.2. Market Analysis, Insights and Forecast - by Application Type
- 8.2.1. Personal
- 8.2.2. Commercial
- 8.3. Market Analysis, Insights and Forecast - by Vehicle Type
- 8.3.1. Quadricycle
- 8.3.2. Tricycle
- 8.1. Market Analysis, Insights and Forecast - by Power Source Type
- 9. Asia Pacific Quadricycle and Tricycle Industry Analysis, Insights and Forecast, 2020-2032
- 9.1. Market Analysis, Insights and Forecast - by Power Source Type
- 9.1.1. Electric
- 9.1.2. Gasoline
- 9.1.3. Solar
- 9.2. Market Analysis, Insights and Forecast - by Application Type
- 9.2.1. Personal
- 9.2.2. Commercial
- 9.3. Market Analysis, Insights and Forecast - by Vehicle Type
- 9.3.1. Quadricycle
- 9.3.2. Tricycle
- 9.1. Market Analysis, Insights and Forecast - by Power Source Type
- 10. Rest of the World Quadricycle and Tricycle Industry Analysis, Insights and Forecast, 2020-2032
- 10.1. Market Analysis, Insights and Forecast - by Power Source Type
- 10.1.1. Electric
- 10.1.2. Gasoline
- 10.1.3. Solar
- 10.2. Market Analysis, Insights and Forecast - by Application Type
- 10.2.1. Personal
- 10.2.2. Commercial
- 10.3. Market Analysis, Insights and Forecast - by Vehicle Type
- 10.3.1. Quadricycle
- 10.3.2. Tricycle
- 10.1. Market Analysis, Insights and Forecast - by Power Source Type
- 11. Competitive Analysis
- 11.1. Company Profiles
- 11.1.1 Bajaj Auto Ltd
- 11.1.1.1. Company Overview
- 11.1.1.2. Products
- 11.1.1.3. Company Financials
- 11.1.1.4. SWOT Analysis
- 11.1.2 Electronio Wheels
- 11.1.2.1. Company Overview
- 11.1.2.2. Products
- 11.1.2.3. Company Financials
- 11.1.2.4. SWOT Analysis
- 11.1.3 Groupe Renaul
- 11.1.3.1. Company Overview
- 11.1.3.2. Products
- 11.1.3.3. Company Financials
- 11.1.3.4. SWOT Analysis
- 11.1.4 Worksman Cycles
- 11.1.4.1. Company Overview
- 11.1.4.2. Products
- 11.1.4.3. Company Financials
- 11.1.4.4. SWOT Analysis
- 11.1.5 Bellier Automobiles
- 11.1.5.1. Company Overview
- 11.1.5.2. Products
- 11.1.5.3. Company Financials
- 11.1.5.4. SWOT Analysis
- 11.1.6 Mahindra and Mahindra
- 11.1.6.1. Company Overview
- 11.1.6.2. Products
- 11.1.6.3. Company Financials
- 11.1.6.4. SWOT Analysis
- 11.1.7 Light Foot Cycle
- 11.1.7.1. Company Overview
- 11.1.7.2. Products
- 11.1.7.3. Company Financials
- 11.1.7.4. SWOT Analysis
- 11.1.8 Automobiles CHATENET
- 11.1.8.1. Company Overview
- 11.1.8.2. Products
- 11.1.8.3. Company Financials
- 11.1.8.4. SWOT Analysis
- 11.1.9 Estrima SRL
- 11.1.9.1. Company Overview
- 11.1.9.2. Products
- 11.1.9.3. Company Financials
- 11.1.9.4. SWOT Analysis
- 11.1.10 Daimus
- 11.1.10.1. Company Overview
- 11.1.10.2. Products
- 11.1.10.3. Company Financials
- 11.1.10.4. SWOT Analysis
- 11.1.11 Ligier Group
- 11.1.11.1. Company Overview
- 11.1.11.2. Products
- 11.1.11.3. Company Financials
- 11.1.11.4. SWOT Analysis
- 11.1.12 Aixam-Mega
- 11.1.12.1. Company Overview
- 11.1.12.2. Products
- 11.1.12.3. Company Financials
- 11.1.12.4. SWOT Analysis
- 11.1.1 Bajaj Auto Ltd
- 11.2. Market Entropy
- 11.2.1 Company's Key Areas Served
- 11.2.2 Recent Developments
- 11.3. Company Market Share Analysis 2025
- 11.3.1 Top 5 Companies Market Share Analysis
- 11.3.2 Top 3 Companies Market Share Analysis
- 11.4. List of Potential Customers
- 12. Research Methodology
List of Figures
- Figure 1: Global Quadricycle and Tricycle Industry Revenue Breakdown (Million, %) by Region 2025 & 2033
- Figure 2: North America Quadricycle and Tricycle Industry Revenue (Million), by Power Source Type 2025 & 2033
- Figure 3: North America Quadricycle and Tricycle Industry Revenue Share (%), by Power Source Type 2025 & 2033
- Figure 4: North America Quadricycle and Tricycle Industry Revenue (Million), by Application Type 2025 & 2033
- Figure 5: North America Quadricycle and Tricycle Industry Revenue Share (%), by Application Type 2025 & 2033
- Figure 6: North America Quadricycle and Tricycle Industry Revenue (Million), by Vehicle Type 2025 & 2033
- Figure 7: North America Quadricycle and Tricycle Industry Revenue Share (%), by Vehicle Type 2025 & 2033
- Figure 8: North America Quadricycle and Tricycle Industry Revenue (Million), by Country 2025 & 2033
- Figure 9: North America Quadricycle and Tricycle Industry Revenue Share (%), by Country 2025 & 2033
- Figure 10: Europe Quadricycle and Tricycle Industry Revenue (Million), by Power Source Type 2025 & 2033
- Figure 11: Europe Quadricycle and Tricycle Industry Revenue Share (%), by Power Source Type 2025 & 2033
- Figure 12: Europe Quadricycle and Tricycle Industry Revenue (Million), by Application Type 2025 & 2033
- Figure 13: Europe Quadricycle and Tricycle Industry Revenue Share (%), by Application Type 2025 & 2033
- Figure 14: Europe Quadricycle and Tricycle Industry Revenue (Million), by Vehicle Type 2025 & 2033
- Figure 15: Europe Quadricycle and Tricycle Industry Revenue Share (%), by Vehicle Type 2025 & 2033
- Figure 16: Europe Quadricycle and Tricycle Industry Revenue (Million), by Country 2025 & 2033
- Figure 17: Europe Quadricycle and Tricycle Industry Revenue Share (%), by Country 2025 & 2033
- Figure 18: Asia Pacific Quadricycle and Tricycle Industry Revenue (Million), by Power Source Type 2025 & 2033
- Figure 19: Asia Pacific Quadricycle and Tricycle Industry Revenue Share (%), by Power Source Type 2025 & 2033
- Figure 20: Asia Pacific Quadricycle and Tricycle Industry Revenue (Million), by Application Type 2025 & 2033
- Figure 21: Asia Pacific Quadricycle and Tricycle Industry Revenue Share (%), by Application Type 2025 & 2033
- Figure 22: Asia Pacific Quadricycle and Tricycle Industry Revenue (Million), by Vehicle Type 2025 & 2033
- Figure 23: Asia Pacific Quadricycle and Tricycle Industry Revenue Share (%), by Vehicle Type 2025 & 2033
- Figure 24: Asia Pacific Quadricycle and Tricycle Industry Revenue (Million), by Country 2025 & 2033
- Figure 25: Asia Pacific Quadricycle and Tricycle Industry Revenue Share (%), by Country 2025 & 2033
- Figure 26: Rest of the World Quadricycle and Tricycle Industry Revenue (Million), by Power Source Type 2025 & 2033
- Figure 27: Rest of the World Quadricycle and Tricycle Industry Revenue Share (%), by Power Source Type 2025 & 2033
- Figure 28: Rest of the World Quadricycle and Tricycle Industry Revenue (Million), by Application Type 2025 & 2033
- Figure 29: Rest of the World Quadricycle and Tricycle Industry Revenue Share (%), by Application Type 2025 & 2033
- Figure 30: Rest of the World Quadricycle and Tricycle Industry Revenue (Million), by Vehicle Type 2025 & 2033
- Figure 31: Rest of the World Quadricycle and Tricycle Industry Revenue Share (%), by Vehicle Type 2025 & 2033
- Figure 32: Rest of the World Quadricycle and Tricycle Industry Revenue (Million), by Country 2025 & 2033
- Figure 33: Rest of the World Quadricycle and Tricycle Industry Revenue Share (%), by Country 2025 & 2033
List of Tables
- Table 1: Global Quadricycle and Tricycle Industry Revenue Million Forecast, by Power Source Type 2020 & 2033
- Table 2: Global Quadricycle and Tricycle Industry Revenue Million Forecast, by Application Type 2020 & 2033
- Table 3: Global Quadricycle and Tricycle Industry Revenue Million Forecast, by Vehicle Type 2020 & 2033
- Table 4: Global Quadricycle and Tricycle Industry Revenue Million Forecast, by Region 2020 & 2033
- Table 5: Global Quadricycle and Tricycle Industry Revenue Million Forecast, by Power Source Type 2020 & 2033
- Table 6: Global Quadricycle and Tricycle Industry Revenue Million Forecast, by Application Type 2020 & 2033
- Table 7: Global Quadricycle and Tricycle Industry Revenue Million Forecast, by Vehicle Type 2020 & 2033
- Table 8: Global Quadricycle and Tricycle Industry Revenue Million Forecast, by Country 2020 & 2033
- Table 9: United States Quadricycle and Tricycle Industry Revenue (Million) Forecast, by Application 2020 & 2033
- Table 10: Canada Quadricycle and Tricycle Industry Revenue (Million) Forecast, by Application 2020 & 2033
- Table 11: Rest of North America Quadricycle and Tricycle Industry Revenue (Million) Forecast, by Application 2020 & 2033
- Table 12: Global Quadricycle and Tricycle Industry Revenue Million Forecast, by Power Source Type 2020 & 2033
- Table 13: Global Quadricycle and Tricycle Industry Revenue Million Forecast, by Application Type 2020 & 2033
- Table 14: Global Quadricycle and Tricycle Industry Revenue Million Forecast, by Vehicle Type 2020 & 2033
- Table 15: Global Quadricycle and Tricycle Industry Revenue Million Forecast, by Country 2020 & 2033
- Table 16: Germany Quadricycle and Tricycle Industry Revenue (Million) Forecast, by Application 2020 & 2033
- Table 17: United Kingdom Quadricycle and Tricycle Industry Revenue (Million) Forecast, by Application 2020 & 2033
- Table 18: France Quadricycle and Tricycle Industry Revenue (Million) Forecast, by Application 2020 & 2033
- Table 19: Italy Quadricycle and Tricycle Industry Revenue (Million) Forecast, by Application 2020 & 2033
- Table 20: Rest of Europe Quadricycle and Tricycle Industry Revenue (Million) Forecast, by Application 2020 & 2033
- Table 21: Global Quadricycle and Tricycle Industry Revenue Million Forecast, by Power Source Type 2020 & 2033
- Table 22: Global Quadricycle and Tricycle Industry Revenue Million Forecast, by Application Type 2020 & 2033
- Table 23: Global Quadricycle and Tricycle Industry Revenue Million Forecast, by Vehicle Type 2020 & 2033
- Table 24: Global Quadricycle and Tricycle Industry Revenue Million Forecast, by Country 2020 & 2033
- Table 25: China Quadricycle and Tricycle Industry Revenue (Million) Forecast, by Application 2020 & 2033
- Table 26: Japan Quadricycle and Tricycle Industry Revenue (Million) Forecast, by Application 2020 & 2033
- Table 27: India Quadricycle and Tricycle Industry Revenue (Million) Forecast, by Application 2020 & 2033
- Table 28: South Korea Quadricycle and Tricycle Industry Revenue (Million) Forecast, by Application 2020 & 2033
- Table 29: Rest of Asia Pacific Quadricycle and Tricycle Industry Revenue (Million) Forecast, by Application 2020 & 2033
- Table 30: Global Quadricycle and Tricycle Industry Revenue Million Forecast, by Power Source Type 2020 & 2033
- Table 31: Global Quadricycle and Tricycle Industry Revenue Million Forecast, by Application Type 2020 & 2033
- Table 32: Global Quadricycle and Tricycle Industry Revenue Million Forecast, by Vehicle Type 2020 & 2033
- Table 33: Global Quadricycle and Tricycle Industry Revenue Million Forecast, by Country 2020 & 2033
- Table 34: Brazil Quadricycle and Tricycle Industry Revenue (Million) Forecast, by Application 2020 & 2033
- Table 35: South Africa Quadricycle and Tricycle Industry Revenue (Million) Forecast, by Application 2020 & 2033
- Table 36: United Arab Emirates Quadricycle and Tricycle Industry Revenue (Million) Forecast, by Application 2020 & 2033
- Table 37: Other Countries Quadricycle and Tricycle Industry Revenue (Million) Forecast, by Application 2020 & 2033
Frequently Asked Questions
1. What is the projected Compound Annual Growth Rate (CAGR) of the Quadricycle and Tricycle Industry?
The projected CAGR is approximately 10.84%.
2. Which companies are prominent players in the Quadricycle and Tricycle Industry?
Key companies in the market include Bajaj Auto Ltd, Electronio Wheels, Groupe Renaul, Worksman Cycles, Bellier Automobiles, Mahindra and Mahindra, Light Foot Cycle, Automobiles CHATENET, Estrima SRL, Daimus, Ligier Group, Aixam-Mega.
3. What are the main segments of the Quadricycle and Tricycle Industry?
The market segments include Power Source Type, Application Type, Vehicle Type.
4. Can you provide details about the market size?
The market size is estimated to be USD 8.20 Million as of 2022.
5. What are some drivers contributing to market growth?
Integration With Telematics And Fleet Management Systems; Others.
6. What are the notable trends driving market growth?
Growing Adoption of Quadricycles Expected to Enhance Demand in the Market.
7. Are there any restraints impacting market growth?
The Initial Costs Associated With Purchasing And Installing ELD Systems is High; Others.
8. Can you provide examples of recent developments in the market?
N/A
9. What pricing options are available for accessing the report?
Pricing options include single-user, multi-user, and enterprise licenses priced at USD 4750, USD 5250, and USD 8750 respectively.
10. Is the market size provided in terms of value or volume?
The market size is provided in terms of value, measured in Million.
11. Are there any specific market keywords associated with the report?
Yes, the market keyword associated with the report is "Quadricycle and Tricycle Industry," which aids in identifying and referencing the specific market segment covered.
12. How do I determine which pricing option suits my needs best?
The pricing options vary based on user requirements and access needs. Individual users may opt for single-user licenses, while businesses requiring broader access may choose multi-user or enterprise licenses for cost-effective access to the report.
13. Are there any additional resources or data provided in the Quadricycle and Tricycle Industry report?
While the report offers comprehensive insights, it's advisable to review the specific contents or supplementary materials provided to ascertain if additional resources or data are available.
14. How can I stay updated on further developments or reports in the Quadricycle and Tricycle Industry?
To stay informed about further developments, trends, and reports in the Quadricycle and Tricycle Industry, consider subscribing to industry newsletters, following relevant companies and organizations, or regularly checking reputable industry news sources and publications.
Methodology
Step 1 - Identification of Relevant Samples Size from Population Database


Step 2 - Approaches for Defining Global Market Size (Value, Volume* & Price*)

Note*: In applicable scenarios
Step 3 - Data Sources
Primary Research
- Web Analytics
- Survey Reports
- Research Institute
- Latest Research Reports
- Opinion Leaders
Secondary Research
- Annual Reports
- White Paper
- Latest Press Release
- Industry Association
- Paid Database
- Investor Presentations

Step 4 - Data Triangulation
Involves using different sources of information in order to increase the validity of a study
These sources are likely to be stakeholders in a program - participants, other researchers, program staff, other community members, and so on.
Then we put all data in single framework & apply various statistical tools to find out the dynamic on the market.
During the analysis stage, feedback from the stakeholder groups would be compared to determine areas of agreement as well as areas of divergence