

Key Insights
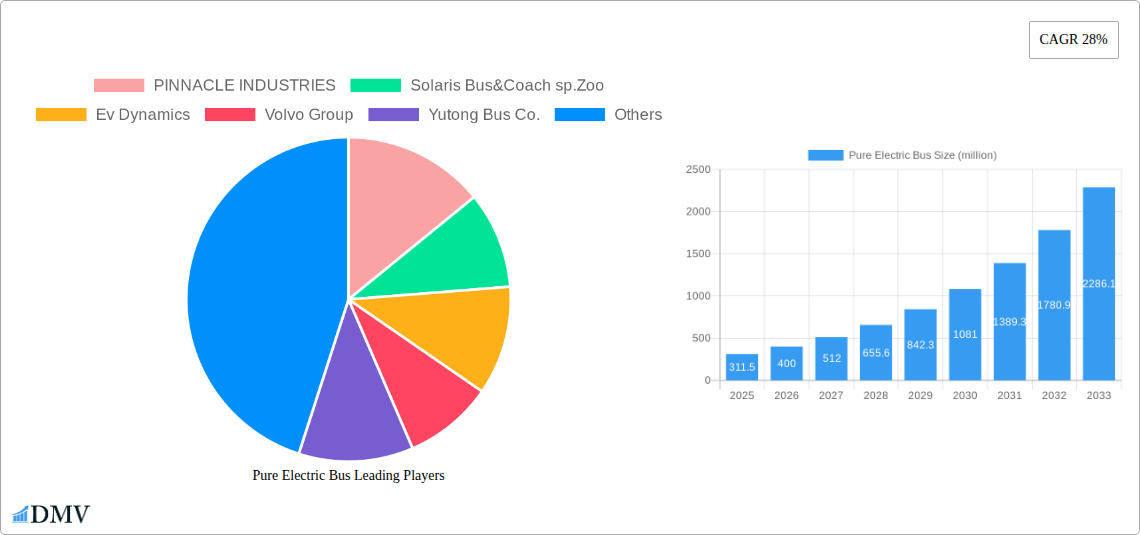
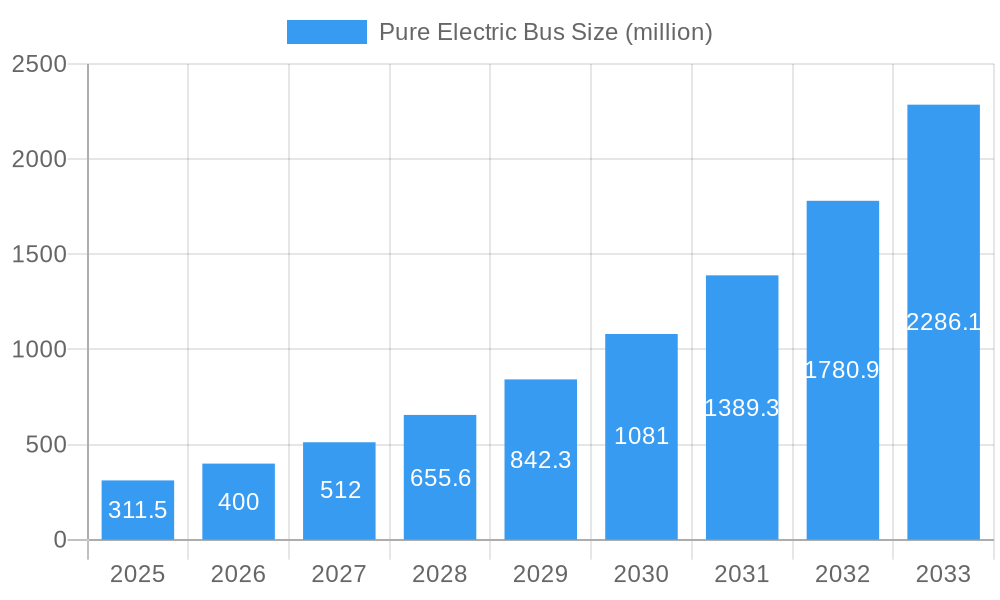
The pure electric bus market is experiencing robust growth, projected to reach a substantial size. The provided data indicates a market size of $311.5 million in 2025, with a compound annual growth rate (CAGR) of 28% from 2019 to 2033. This signifies a significant expansion driven by several factors. Stringent emission regulations globally are compelling cities and transportation authorities to transition from diesel to cleaner, electric alternatives. Furthermore, advancements in battery technology, leading to increased range and reduced charging times, are making electric buses a more practical and cost-effective solution. Government incentives and subsidies aimed at promoting sustainable transportation further fuel this market growth. The rising awareness of environmental concerns among consumers and businesses also contributes to the increasing adoption of electric buses. Key players like BYD, Daimler Truck AG, and Volvo Group are driving innovation and competition, fostering market expansion through technological advancements and strategic partnerships.
Pure Electric Bus Market Size (In Million)
The market segmentation, while not explicitly provided, likely includes variations in bus size (e.g., single-decker, double-decker), battery capacity, charging infrastructure requirements, and geographical location. Competitive pressures are high, with numerous established automotive manufacturers and specialized electric vehicle companies vying for market share. While challenges remain, such as the high initial investment cost of electric buses and the need for widespread charging infrastructure development, the long-term prospects for the pure electric bus market appear exceptionally positive. The forecasted CAGR suggests substantial growth potential over the next decade, presenting significant opportunities for established players and new entrants alike.
Pure Electric Bus Company Market Share
Pure Electric Bus Market Report: A Comprehensive Analysis (2019-2033)
This insightful report provides a comprehensive analysis of the global Pure Electric Bus market, offering a detailed overview of its current state, future projections, and key players. The study period covers 2019-2033, with a base year of 2025 and a forecast period of 2025-2033. This report is crucial for stakeholders seeking to understand the market dynamics, identify growth opportunities, and make informed strategic decisions within this rapidly evolving sector. The global Pure Electric Bus market is projected to reach xx million by 2033, exhibiting significant growth driven by technological advancements and supportive government policies.
Pure Electric Bus Market Composition & Trends
The Pure Electric Bus market is characterized by a moderately concentrated landscape, with key players holding significant market share. The market share distribution is as follows: BYD (xx%), Volvo Group (xx%), Daimler Truck AG (xx%), and others (xx%). Innovation in battery technology, charging infrastructure, and vehicle design are crucial catalysts for market growth. Stringent emission regulations globally are driving the adoption of electric buses, while the availability of alternative fuel vehicles presents a key substitute product challenge. End-users primarily include public transportation authorities, private bus operators, and corporate fleets. The report also analyzes several key M&A activities, with total deal values exceeding xx million during the historical period (2019-2024). These activities have played a significant role in shaping the market's competitive dynamics.
- Market Concentration: Moderately concentrated, with top players holding significant share.
- Innovation Catalysts: Battery technology, charging infrastructure, vehicle design.
- Regulatory Landscape: Stringent emission norms driving adoption.
- Substitute Products: Alternative fuel vehicles (e.g., CNG, hydrogen).
- End-User Profiles: Public transport, private operators, corporate fleets.
- M&A Activities: Total deal value exceeding xx million (2019-2024).
Pure Electric Bus Industry Evolution
The Pure Electric Bus market has witnessed exponential growth over the past few years, driven by a confluence of factors. From 2019 to 2024, the market experienced a Compound Annual Growth Rate (CAGR) of xx%, reaching a market value of xx million in 2024. Technological advancements, such as improved battery range, faster charging times, and enhanced vehicle performance, have significantly propelled adoption. Simultaneously, shifting consumer preferences towards environmentally friendly transportation options have further fueled demand. This trend is projected to continue, with a forecasted CAGR of xx% from 2025 to 2033, reaching an estimated xx million by 2033. The increasing awareness of air pollution and its health consequences is a significant driver of market adoption in urban areas globally. Government incentives, including subsidies and tax breaks, have played a crucial role in accelerating the transition to electric buses. Furthermore, the development of smart charging technologies and integrated fleet management systems have improved the efficiency and overall cost-effectiveness of electric bus operations.
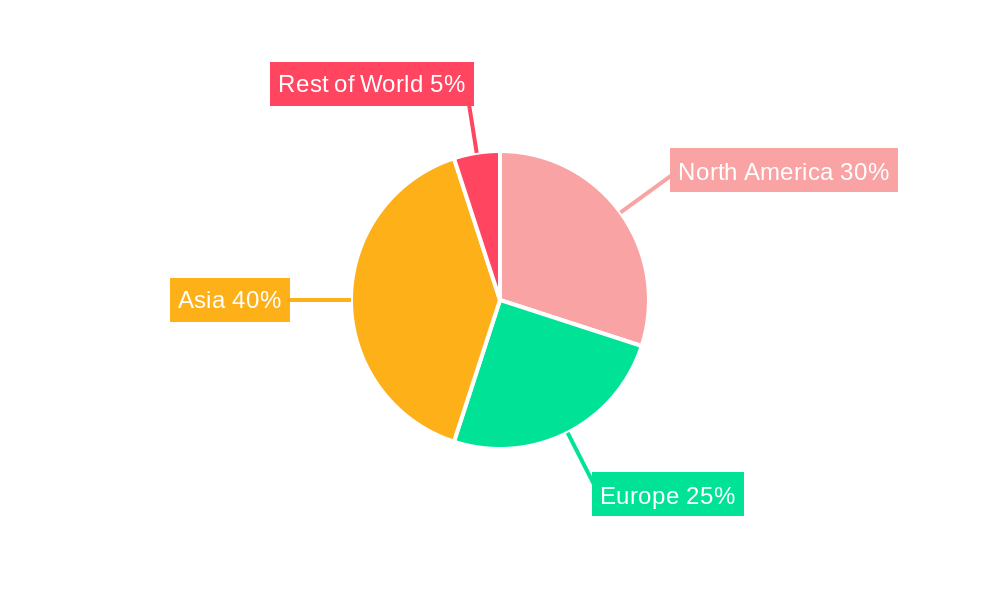
Leading Regions, Countries, or Segments in Pure Electric Bus
The report identifies China as the leading region in the Pure Electric Bus market, primarily driven by substantial government investment in public transportation infrastructure, supportive policies promoting electric vehicle adoption, and the presence of major electric bus manufacturers such as BYD and Yutong.
- Key Drivers in China:
- Massive government investment in public transport infrastructure.
- Supportive policies incentivizing electric vehicle adoption.
- Presence of major domestic electric bus manufacturers (BYD, Yutong).
- High population density and air pollution concerns in major cities.
The dominance of China stems from a combination of factors, including a strong focus on reducing air pollution in major cities, substantial government subsidies for electric bus purchases, and the presence of a robust domestic manufacturing base. However, other regions, including Europe and North America, are also experiencing significant growth, driven by increasingly stringent emission regulations and growing environmental awareness.
Pure Electric Bus Product Innovations
Recent innovations in Pure Electric Buses include advancements in battery technology, resulting in increased range and faster charging capabilities. Improved motor efficiency and lightweight materials have enhanced overall performance and reduced energy consumption. Furthermore, the integration of advanced driver-assistance systems (ADAS) and telematics solutions is enhancing safety and operational efficiency. These innovations are contributing to a more compelling value proposition for both operators and passengers. Unique selling propositions include reduced emissions, lower operating costs, and enhanced passenger comfort.
Propelling Factors for Pure Electric Bus Growth
Technological advancements, such as improved battery technology and charging infrastructure, are significantly driving market growth. Stringent government regulations aimed at reducing greenhouse gas emissions are creating a strong impetus for adoption. Furthermore, economic incentives like subsidies and tax benefits are making electric buses more financially attractive. The growing awareness of environmental concerns among consumers and the need for sustainable transportation solutions are further propelling market expansion.
Obstacles in the Pure Electric Bus Market
High initial investment costs for electric buses pose a significant barrier to adoption, especially for smaller operators. Supply chain disruptions, particularly in the procurement of batteries and other key components, can impact production and availability. Furthermore, competition from established manufacturers of traditional diesel and CNG buses creates a challenging market environment. These factors can potentially restrain market growth in the short term.
Future Opportunities in Pure Electric Bus
Emerging markets in developing economies present significant growth potential for electric buses, especially in rapidly urbanizing areas. Advancements in battery technology, such as solid-state batteries, are poised to further enhance range and charging speed, unlocking new opportunities. The increasing integration of smart city initiatives and the development of intelligent transportation systems (ITS) offer further avenues for growth and innovation in the Pure Electric Bus market.
Major Players in the Pure Electric Bus Ecosystem
- PINNACLE INDUSTRIES
- Solaris Bus&Coach sp. Zoo
- Ev Dynamics
- Volvo Group
- Yutong Bus Co., Ltd.
- VDL Bus&Coach
- Hyundai Motor Company
- Edison Motors
- IVECO S.p.A.
- Daimler Truck AG
- Xiamen King Long International Trading Co., Ltd.
- BYD
Key Developments in Pure Electric Bus Industry
- 2023-03: BYD launched its latest electric bus model with enhanced range and charging capabilities.
- 2022-11: Volvo Group announced a strategic partnership to expand its electric bus charging infrastructure.
- 2022-06: Several major cities announced significant investments in their electric bus fleets.
- 2021-12: Government regulations mandating electric bus adoption in various regions were implemented.
Strategic Pure Electric Bus Market Forecast
The Pure Electric Bus market is poised for substantial growth, driven by increasing environmental awareness, stringent emission regulations, and technological advancements. The focus will be on improving battery technology, enhancing charging infrastructure, and optimizing operational efficiency. Emerging markets in developing countries offer significant potential, along with the continued expansion in established markets. This growth trajectory is expected to continue throughout the forecast period, offering attractive opportunities for industry participants.
Pure Electric Bus Segmentation
-
1. Application
- 1.1. Intercity Bus
- 1.2. Long-Distance Bus
-
2. Type
- 2.1. Single Layer
- 2.2. Double Layer
Pure Electric Bus Segmentation By Geography
-
1. North America
- 1.1. United States
- 1.2. Canada
- 1.3. Mexico
-
2. South America
- 2.1. Brazil
- 2.2. Argentina
- 2.3. Rest of South America
-
3. Europe
- 3.1. United Kingdom
- 3.2. Germany
- 3.3. France
- 3.4. Italy
- 3.5. Spain
- 3.6. Russia
- 3.7. Benelux
- 3.8. Nordics
- 3.9. Rest of Europe
-
4. Middle East & Africa
- 4.1. Turkey
- 4.2. Israel
- 4.3. GCC
- 4.4. North Africa
- 4.5. South Africa
- 4.6. Rest of Middle East & Africa
-
5. Asia Pacific
- 5.1. China
- 5.2. India
- 5.3. Japan
- 5.4. South Korea
- 5.5. ASEAN
- 5.6. Oceania
- 5.7. Rest of Asia Pacific
Pure Electric Bus Regional Market Share
Geographic Coverage of Pure Electric Bus
Pure Electric Bus REPORT HIGHLIGHTS
| Aspects | Details |
|---|---|
| Study Period | 2020-2034 |
| Base Year | 2025 |
| Estimated Year | 2026 |
| Forecast Period | 2026-2034 |
| Historical Period | 2020-2025 |
| Growth Rate | CAGR of 28% from 2020-2034 |
| Segmentation |
|
Table of Contents
- 1. Introduction
- 1.1. Research Scope
- 1.2. Market Segmentation
- 1.3. Research Methodology
- 1.4. Definitions and Assumptions
- 2. Executive Summary
- 2.1. Introduction
- 3. Market Dynamics
- 3.1. Introduction
- 3.2. Market Drivers
- 3.3. Market Restrains
- 3.4. Market Trends
- 4. Market Factor Analysis
- 4.1. Porters Five Forces
- 4.2. Supply/Value Chain
- 4.3. PESTEL analysis
- 4.4. Market Entropy
- 4.5. Patent/Trademark Analysis
- 5. Global Pure Electric Bus Analysis, Insights and Forecast, 2020-2032
- 5.1. Market Analysis, Insights and Forecast - by Application
- 5.1.1. Intercity Bus
- 5.1.2. Long-Distance Bus
- 5.2. Market Analysis, Insights and Forecast - by Type
- 5.2.1. Single Layer
- 5.2.2. Double Layer
- 5.3. Market Analysis, Insights and Forecast - by Region
- 5.3.1. North America
- 5.3.2. South America
- 5.3.3. Europe
- 5.3.4. Middle East & Africa
- 5.3.5. Asia Pacific
- 5.1. Market Analysis, Insights and Forecast - by Application
- 6. North America Pure Electric Bus Analysis, Insights and Forecast, 2020-2032
- 6.1. Market Analysis, Insights and Forecast - by Application
- 6.1.1. Intercity Bus
- 6.1.2. Long-Distance Bus
- 6.2. Market Analysis, Insights and Forecast - by Type
- 6.2.1. Single Layer
- 6.2.2. Double Layer
- 6.1. Market Analysis, Insights and Forecast - by Application
- 7. South America Pure Electric Bus Analysis, Insights and Forecast, 2020-2032
- 7.1. Market Analysis, Insights and Forecast - by Application
- 7.1.1. Intercity Bus
- 7.1.2. Long-Distance Bus
- 7.2. Market Analysis, Insights and Forecast - by Type
- 7.2.1. Single Layer
- 7.2.2. Double Layer
- 7.1. Market Analysis, Insights and Forecast - by Application
- 8. Europe Pure Electric Bus Analysis, Insights and Forecast, 2020-2032
- 8.1. Market Analysis, Insights and Forecast - by Application
- 8.1.1. Intercity Bus
- 8.1.2. Long-Distance Bus
- 8.2. Market Analysis, Insights and Forecast - by Type
- 8.2.1. Single Layer
- 8.2.2. Double Layer
- 8.1. Market Analysis, Insights and Forecast - by Application
- 9. Middle East & Africa Pure Electric Bus Analysis, Insights and Forecast, 2020-2032
- 9.1. Market Analysis, Insights and Forecast - by Application
- 9.1.1. Intercity Bus
- 9.1.2. Long-Distance Bus
- 9.2. Market Analysis, Insights and Forecast - by Type
- 9.2.1. Single Layer
- 9.2.2. Double Layer
- 9.1. Market Analysis, Insights and Forecast - by Application
- 10. Asia Pacific Pure Electric Bus Analysis, Insights and Forecast, 2020-2032
- 10.1. Market Analysis, Insights and Forecast - by Application
- 10.1.1. Intercity Bus
- 10.1.2. Long-Distance Bus
- 10.2. Market Analysis, Insights and Forecast - by Type
- 10.2.1. Single Layer
- 10.2.2. Double Layer
- 10.1. Market Analysis, Insights and Forecast - by Application
- 11. Competitive Analysis
- 11.1. Global Market Share Analysis 2025
- 11.2. Company Profiles
- 11.2.1 PINNACLE INDUSTRIES
- 11.2.1.1. Overview
- 11.2.1.2. Products
- 11.2.1.3. SWOT Analysis
- 11.2.1.4. Recent Developments
- 11.2.1.5. Financials (Based on Availability)
- 11.2.2 Solaris Bus&Coach sp.Zoo
- 11.2.2.1. Overview
- 11.2.2.2. Products
- 11.2.2.3. SWOT Analysis
- 11.2.2.4. Recent Developments
- 11.2.2.5. Financials (Based on Availability)
- 11.2.3 Ev Dynamics
- 11.2.3.1. Overview
- 11.2.3.2. Products
- 11.2.3.3. SWOT Analysis
- 11.2.3.4. Recent Developments
- 11.2.3.5. Financials (Based on Availability)
- 11.2.4 Volvo Group
- 11.2.4.1. Overview
- 11.2.4.2. Products
- 11.2.4.3. SWOT Analysis
- 11.2.4.4. Recent Developments
- 11.2.4.5. Financials (Based on Availability)
- 11.2.5 Yutong Bus Co.
- 11.2.5.1. Overview
- 11.2.5.2. Products
- 11.2.5.3. SWOT Analysis
- 11.2.5.4. Recent Developments
- 11.2.5.5. Financials (Based on Availability)
- 11.2.6 Ltd.
- 11.2.6.1. Overview
- 11.2.6.2. Products
- 11.2.6.3. SWOT Analysis
- 11.2.6.4. Recent Developments
- 11.2.6.5. Financials (Based on Availability)
- 11.2.7 VDL Bus&Coach
- 11.2.7.1. Overview
- 11.2.7.2. Products
- 11.2.7.3. SWOT Analysis
- 11.2.7.4. Recent Developments
- 11.2.7.5. Financials (Based on Availability)
- 11.2.8 Hyundai Motor Company
- 11.2.8.1. Overview
- 11.2.8.2. Products
- 11.2.8.3. SWOT Analysis
- 11.2.8.4. Recent Developments
- 11.2.8.5. Financials (Based on Availability)
- 11.2.9 Edison Motors
- 11.2.9.1. Overview
- 11.2.9.2. Products
- 11.2.9.3. SWOT Analysis
- 11.2.9.4. Recent Developments
- 11.2.9.5. Financials (Based on Availability)
- 11.2.10 IVECO S.p.A.
- 11.2.10.1. Overview
- 11.2.10.2. Products
- 11.2.10.3. SWOT Analysis
- 11.2.10.4. Recent Developments
- 11.2.10.5. Financials (Based on Availability)
- 11.2.11 Daimler Truck AG
- 11.2.11.1. Overview
- 11.2.11.2. Products
- 11.2.11.3. SWOT Analysis
- 11.2.11.4. Recent Developments
- 11.2.11.5. Financials (Based on Availability)
- 11.2.12 Xiamen King Long International Trading Co.
- 11.2.12.1. Overview
- 11.2.12.2. Products
- 11.2.12.3. SWOT Analysis
- 11.2.12.4. Recent Developments
- 11.2.12.5. Financials (Based on Availability)
- 11.2.13 Ltd.
- 11.2.13.1. Overview
- 11.2.13.2. Products
- 11.2.13.3. SWOT Analysis
- 11.2.13.4. Recent Developments
- 11.2.13.5. Financials (Based on Availability)
- 11.2.14 BYD
- 11.2.14.1. Overview
- 11.2.14.2. Products
- 11.2.14.3. SWOT Analysis
- 11.2.14.4. Recent Developments
- 11.2.14.5. Financials (Based on Availability)
- 11.2.1 PINNACLE INDUSTRIES
List of Figures
- Figure 1: Global Pure Electric Bus Revenue Breakdown (million, %) by Region 2025 & 2033
- Figure 2: Global Pure Electric Bus Volume Breakdown (K, %) by Region 2025 & 2033
- Figure 3: North America Pure Electric Bus Revenue (million), by Application 2025 & 2033
- Figure 4: North America Pure Electric Bus Volume (K), by Application 2025 & 2033
- Figure 5: North America Pure Electric Bus Revenue Share (%), by Application 2025 & 2033
- Figure 6: North America Pure Electric Bus Volume Share (%), by Application 2025 & 2033
- Figure 7: North America Pure Electric Bus Revenue (million), by Type 2025 & 2033
- Figure 8: North America Pure Electric Bus Volume (K), by Type 2025 & 2033
- Figure 9: North America Pure Electric Bus Revenue Share (%), by Type 2025 & 2033
- Figure 10: North America Pure Electric Bus Volume Share (%), by Type 2025 & 2033
- Figure 11: North America Pure Electric Bus Revenue (million), by Country 2025 & 2033
- Figure 12: North America Pure Electric Bus Volume (K), by Country 2025 & 2033
- Figure 13: North America Pure Electric Bus Revenue Share (%), by Country 2025 & 2033
- Figure 14: North America Pure Electric Bus Volume Share (%), by Country 2025 & 2033
- Figure 15: South America Pure Electric Bus Revenue (million), by Application 2025 & 2033
- Figure 16: South America Pure Electric Bus Volume (K), by Application 2025 & 2033
- Figure 17: South America Pure Electric Bus Revenue Share (%), by Application 2025 & 2033
- Figure 18: South America Pure Electric Bus Volume Share (%), by Application 2025 & 2033
- Figure 19: South America Pure Electric Bus Revenue (million), by Type 2025 & 2033
- Figure 20: South America Pure Electric Bus Volume (K), by Type 2025 & 2033
- Figure 21: South America Pure Electric Bus Revenue Share (%), by Type 2025 & 2033
- Figure 22: South America Pure Electric Bus Volume Share (%), by Type 2025 & 2033
- Figure 23: South America Pure Electric Bus Revenue (million), by Country 2025 & 2033
- Figure 24: South America Pure Electric Bus Volume (K), by Country 2025 & 2033
- Figure 25: South America Pure Electric Bus Revenue Share (%), by Country 2025 & 2033
- Figure 26: South America Pure Electric Bus Volume Share (%), by Country 2025 & 2033
- Figure 27: Europe Pure Electric Bus Revenue (million), by Application 2025 & 2033
- Figure 28: Europe Pure Electric Bus Volume (K), by Application 2025 & 2033
- Figure 29: Europe Pure Electric Bus Revenue Share (%), by Application 2025 & 2033
- Figure 30: Europe Pure Electric Bus Volume Share (%), by Application 2025 & 2033
- Figure 31: Europe Pure Electric Bus Revenue (million), by Type 2025 & 2033
- Figure 32: Europe Pure Electric Bus Volume (K), by Type 2025 & 2033
- Figure 33: Europe Pure Electric Bus Revenue Share (%), by Type 2025 & 2033
- Figure 34: Europe Pure Electric Bus Volume Share (%), by Type 2025 & 2033
- Figure 35: Europe Pure Electric Bus Revenue (million), by Country 2025 & 2033
- Figure 36: Europe Pure Electric Bus Volume (K), by Country 2025 & 2033
- Figure 37: Europe Pure Electric Bus Revenue Share (%), by Country 2025 & 2033
- Figure 38: Europe Pure Electric Bus Volume Share (%), by Country 2025 & 2033
- Figure 39: Middle East & Africa Pure Electric Bus Revenue (million), by Application 2025 & 2033
- Figure 40: Middle East & Africa Pure Electric Bus Volume (K), by Application 2025 & 2033
- Figure 41: Middle East & Africa Pure Electric Bus Revenue Share (%), by Application 2025 & 2033
- Figure 42: Middle East & Africa Pure Electric Bus Volume Share (%), by Application 2025 & 2033
- Figure 43: Middle East & Africa Pure Electric Bus Revenue (million), by Type 2025 & 2033
- Figure 44: Middle East & Africa Pure Electric Bus Volume (K), by Type 2025 & 2033
- Figure 45: Middle East & Africa Pure Electric Bus Revenue Share (%), by Type 2025 & 2033
- Figure 46: Middle East & Africa Pure Electric Bus Volume Share (%), by Type 2025 & 2033
- Figure 47: Middle East & Africa Pure Electric Bus Revenue (million), by Country 2025 & 2033
- Figure 48: Middle East & Africa Pure Electric Bus Volume (K), by Country 2025 & 2033
- Figure 49: Middle East & Africa Pure Electric Bus Revenue Share (%), by Country 2025 & 2033
- Figure 50: Middle East & Africa Pure Electric Bus Volume Share (%), by Country 2025 & 2033
- Figure 51: Asia Pacific Pure Electric Bus Revenue (million), by Application 2025 & 2033
- Figure 52: Asia Pacific Pure Electric Bus Volume (K), by Application 2025 & 2033
- Figure 53: Asia Pacific Pure Electric Bus Revenue Share (%), by Application 2025 & 2033
- Figure 54: Asia Pacific Pure Electric Bus Volume Share (%), by Application 2025 & 2033
- Figure 55: Asia Pacific Pure Electric Bus Revenue (million), by Type 2025 & 2033
- Figure 56: Asia Pacific Pure Electric Bus Volume (K), by Type 2025 & 2033
- Figure 57: Asia Pacific Pure Electric Bus Revenue Share (%), by Type 2025 & 2033
- Figure 58: Asia Pacific Pure Electric Bus Volume Share (%), by Type 2025 & 2033
- Figure 59: Asia Pacific Pure Electric Bus Revenue (million), by Country 2025 & 2033
- Figure 60: Asia Pacific Pure Electric Bus Volume (K), by Country 2025 & 2033
- Figure 61: Asia Pacific Pure Electric Bus Revenue Share (%), by Country 2025 & 2033
- Figure 62: Asia Pacific Pure Electric Bus Volume Share (%), by Country 2025 & 2033
List of Tables
- Table 1: Global Pure Electric Bus Revenue million Forecast, by Application 2020 & 2033
- Table 2: Global Pure Electric Bus Volume K Forecast, by Application 2020 & 2033
- Table 3: Global Pure Electric Bus Revenue million Forecast, by Type 2020 & 2033
- Table 4: Global Pure Electric Bus Volume K Forecast, by Type 2020 & 2033
- Table 5: Global Pure Electric Bus Revenue million Forecast, by Region 2020 & 2033
- Table 6: Global Pure Electric Bus Volume K Forecast, by Region 2020 & 2033
- Table 7: Global Pure Electric Bus Revenue million Forecast, by Application 2020 & 2033
- Table 8: Global Pure Electric Bus Volume K Forecast, by Application 2020 & 2033
- Table 9: Global Pure Electric Bus Revenue million Forecast, by Type 2020 & 2033
- Table 10: Global Pure Electric Bus Volume K Forecast, by Type 2020 & 2033
- Table 11: Global Pure Electric Bus Revenue million Forecast, by Country 2020 & 2033
- Table 12: Global Pure Electric Bus Volume K Forecast, by Country 2020 & 2033
- Table 13: United States Pure Electric Bus Revenue (million) Forecast, by Application 2020 & 2033
- Table 14: United States Pure Electric Bus Volume (K) Forecast, by Application 2020 & 2033
- Table 15: Canada Pure Electric Bus Revenue (million) Forecast, by Application 2020 & 2033
- Table 16: Canada Pure Electric Bus Volume (K) Forecast, by Application 2020 & 2033
- Table 17: Mexico Pure Electric Bus Revenue (million) Forecast, by Application 2020 & 2033
- Table 18: Mexico Pure Electric Bus Volume (K) Forecast, by Application 2020 & 2033
- Table 19: Global Pure Electric Bus Revenue million Forecast, by Application 2020 & 2033
- Table 20: Global Pure Electric Bus Volume K Forecast, by Application 2020 & 2033
- Table 21: Global Pure Electric Bus Revenue million Forecast, by Type 2020 & 2033
- Table 22: Global Pure Electric Bus Volume K Forecast, by Type 2020 & 2033
- Table 23: Global Pure Electric Bus Revenue million Forecast, by Country 2020 & 2033
- Table 24: Global Pure Electric Bus Volume K Forecast, by Country 2020 & 2033
- Table 25: Brazil Pure Electric Bus Revenue (million) Forecast, by Application 2020 & 2033
- Table 26: Brazil Pure Electric Bus Volume (K) Forecast, by Application 2020 & 2033
- Table 27: Argentina Pure Electric Bus Revenue (million) Forecast, by Application 2020 & 2033
- Table 28: Argentina Pure Electric Bus Volume (K) Forecast, by Application 2020 & 2033
- Table 29: Rest of South America Pure Electric Bus Revenue (million) Forecast, by Application 2020 & 2033
- Table 30: Rest of South America Pure Electric Bus Volume (K) Forecast, by Application 2020 & 2033
- Table 31: Global Pure Electric Bus Revenue million Forecast, by Application 2020 & 2033
- Table 32: Global Pure Electric Bus Volume K Forecast, by Application 2020 & 2033
- Table 33: Global Pure Electric Bus Revenue million Forecast, by Type 2020 & 2033
- Table 34: Global Pure Electric Bus Volume K Forecast, by Type 2020 & 2033
- Table 35: Global Pure Electric Bus Revenue million Forecast, by Country 2020 & 2033
- Table 36: Global Pure Electric Bus Volume K Forecast, by Country 2020 & 2033
- Table 37: United Kingdom Pure Electric Bus Revenue (million) Forecast, by Application 2020 & 2033
- Table 38: United Kingdom Pure Electric Bus Volume (K) Forecast, by Application 2020 & 2033
- Table 39: Germany Pure Electric Bus Revenue (million) Forecast, by Application 2020 & 2033
- Table 40: Germany Pure Electric Bus Volume (K) Forecast, by Application 2020 & 2033
- Table 41: France Pure Electric Bus Revenue (million) Forecast, by Application 2020 & 2033
- Table 42: France Pure Electric Bus Volume (K) Forecast, by Application 2020 & 2033
- Table 43: Italy Pure Electric Bus Revenue (million) Forecast, by Application 2020 & 2033
- Table 44: Italy Pure Electric Bus Volume (K) Forecast, by Application 2020 & 2033
- Table 45: Spain Pure Electric Bus Revenue (million) Forecast, by Application 2020 & 2033
- Table 46: Spain Pure Electric Bus Volume (K) Forecast, by Application 2020 & 2033
- Table 47: Russia Pure Electric Bus Revenue (million) Forecast, by Application 2020 & 2033
- Table 48: Russia Pure Electric Bus Volume (K) Forecast, by Application 2020 & 2033
- Table 49: Benelux Pure Electric Bus Revenue (million) Forecast, by Application 2020 & 2033
- Table 50: Benelux Pure Electric Bus Volume (K) Forecast, by Application 2020 & 2033
- Table 51: Nordics Pure Electric Bus Revenue (million) Forecast, by Application 2020 & 2033
- Table 52: Nordics Pure Electric Bus Volume (K) Forecast, by Application 2020 & 2033
- Table 53: Rest of Europe Pure Electric Bus Revenue (million) Forecast, by Application 2020 & 2033
- Table 54: Rest of Europe Pure Electric Bus Volume (K) Forecast, by Application 2020 & 2033
- Table 55: Global Pure Electric Bus Revenue million Forecast, by Application 2020 & 2033
- Table 56: Global Pure Electric Bus Volume K Forecast, by Application 2020 & 2033
- Table 57: Global Pure Electric Bus Revenue million Forecast, by Type 2020 & 2033
- Table 58: Global Pure Electric Bus Volume K Forecast, by Type 2020 & 2033
- Table 59: Global Pure Electric Bus Revenue million Forecast, by Country 2020 & 2033
- Table 60: Global Pure Electric Bus Volume K Forecast, by Country 2020 & 2033
- Table 61: Turkey Pure Electric Bus Revenue (million) Forecast, by Application 2020 & 2033
- Table 62: Turkey Pure Electric Bus Volume (K) Forecast, by Application 2020 & 2033
- Table 63: Israel Pure Electric Bus Revenue (million) Forecast, by Application 2020 & 2033
- Table 64: Israel Pure Electric Bus Volume (K) Forecast, by Application 2020 & 2033
- Table 65: GCC Pure Electric Bus Revenue (million) Forecast, by Application 2020 & 2033
- Table 66: GCC Pure Electric Bus Volume (K) Forecast, by Application 2020 & 2033
- Table 67: North Africa Pure Electric Bus Revenue (million) Forecast, by Application 2020 & 2033
- Table 68: North Africa Pure Electric Bus Volume (K) Forecast, by Application 2020 & 2033
- Table 69: South Africa Pure Electric Bus Revenue (million) Forecast, by Application 2020 & 2033
- Table 70: South Africa Pure Electric Bus Volume (K) Forecast, by Application 2020 & 2033
- Table 71: Rest of Middle East & Africa Pure Electric Bus Revenue (million) Forecast, by Application 2020 & 2033
- Table 72: Rest of Middle East & Africa Pure Electric Bus Volume (K) Forecast, by Application 2020 & 2033
- Table 73: Global Pure Electric Bus Revenue million Forecast, by Application 2020 & 2033
- Table 74: Global Pure Electric Bus Volume K Forecast, by Application 2020 & 2033
- Table 75: Global Pure Electric Bus Revenue million Forecast, by Type 2020 & 2033
- Table 76: Global Pure Electric Bus Volume K Forecast, by Type 2020 & 2033
- Table 77: Global Pure Electric Bus Revenue million Forecast, by Country 2020 & 2033
- Table 78: Global Pure Electric Bus Volume K Forecast, by Country 2020 & 2033
- Table 79: China Pure Electric Bus Revenue (million) Forecast, by Application 2020 & 2033
- Table 80: China Pure Electric Bus Volume (K) Forecast, by Application 2020 & 2033
- Table 81: India Pure Electric Bus Revenue (million) Forecast, by Application 2020 & 2033
- Table 82: India Pure Electric Bus Volume (K) Forecast, by Application 2020 & 2033
- Table 83: Japan Pure Electric Bus Revenue (million) Forecast, by Application 2020 & 2033
- Table 84: Japan Pure Electric Bus Volume (K) Forecast, by Application 2020 & 2033
- Table 85: South Korea Pure Electric Bus Revenue (million) Forecast, by Application 2020 & 2033
- Table 86: South Korea Pure Electric Bus Volume (K) Forecast, by Application 2020 & 2033
- Table 87: ASEAN Pure Electric Bus Revenue (million) Forecast, by Application 2020 & 2033
- Table 88: ASEAN Pure Electric Bus Volume (K) Forecast, by Application 2020 & 2033
- Table 89: Oceania Pure Electric Bus Revenue (million) Forecast, by Application 2020 & 2033
- Table 90: Oceania Pure Electric Bus Volume (K) Forecast, by Application 2020 & 2033
- Table 91: Rest of Asia Pacific Pure Electric Bus Revenue (million) Forecast, by Application 2020 & 2033
- Table 92: Rest of Asia Pacific Pure Electric Bus Volume (K) Forecast, by Application 2020 & 2033
Frequently Asked Questions
1. What is the projected Compound Annual Growth Rate (CAGR) of the Pure Electric Bus?
The projected CAGR is approximately 28%.
2. Which companies are prominent players in the Pure Electric Bus?
Key companies in the market include PINNACLE INDUSTRIES, Solaris Bus&Coach sp.Zoo, Ev Dynamics, Volvo Group, Yutong Bus Co., Ltd., VDL Bus&Coach, Hyundai Motor Company, Edison Motors, IVECO S.p.A., Daimler Truck AG, Xiamen King Long International Trading Co., Ltd., BYD.
3. What are the main segments of the Pure Electric Bus?
The market segments include Application, Type.
4. Can you provide details about the market size?
The market size is estimated to be USD 311500 million as of 2022.
5. What are some drivers contributing to market growth?
N/A
6. What are the notable trends driving market growth?
N/A
7. Are there any restraints impacting market growth?
N/A
8. Can you provide examples of recent developments in the market?
N/A
9. What pricing options are available for accessing the report?
Pricing options include single-user, multi-user, and enterprise licenses priced at USD 3950.00, USD 5925.00, and USD 7900.00 respectively.
10. Is the market size provided in terms of value or volume?
The market size is provided in terms of value, measured in million and volume, measured in K.
11. Are there any specific market keywords associated with the report?
Yes, the market keyword associated with the report is "Pure Electric Bus," which aids in identifying and referencing the specific market segment covered.
12. How do I determine which pricing option suits my needs best?
The pricing options vary based on user requirements and access needs. Individual users may opt for single-user licenses, while businesses requiring broader access may choose multi-user or enterprise licenses for cost-effective access to the report.
13. Are there any additional resources or data provided in the Pure Electric Bus report?
While the report offers comprehensive insights, it's advisable to review the specific contents or supplementary materials provided to ascertain if additional resources or data are available.
14. How can I stay updated on further developments or reports in the Pure Electric Bus?
To stay informed about further developments, trends, and reports in the Pure Electric Bus, consider subscribing to industry newsletters, following relevant companies and organizations, or regularly checking reputable industry news sources and publications.
Methodology
Step 1 - Identification of Relevant Samples Size from Population Database


Step 2 - Approaches for Defining Global Market Size (Value, Volume* & Price*)

Note*: In applicable scenarios
Step 3 - Data Sources
Primary Research
- Web Analytics
- Survey Reports
- Research Institute
- Latest Research Reports
- Opinion Leaders
Secondary Research
- Annual Reports
- White Paper
- Latest Press Release
- Industry Association
- Paid Database
- Investor Presentations

Step 4 - Data Triangulation
Involves using different sources of information in order to increase the validity of a study
These sources are likely to be stakeholders in a program - participants, other researchers, program staff, other community members, and so on.
Then we put all data in single framework & apply various statistical tools to find out the dynamic on the market.
During the analysis stage, feedback from the stakeholder groups would be compared to determine areas of agreement as well as areas of divergence