

Key Insights
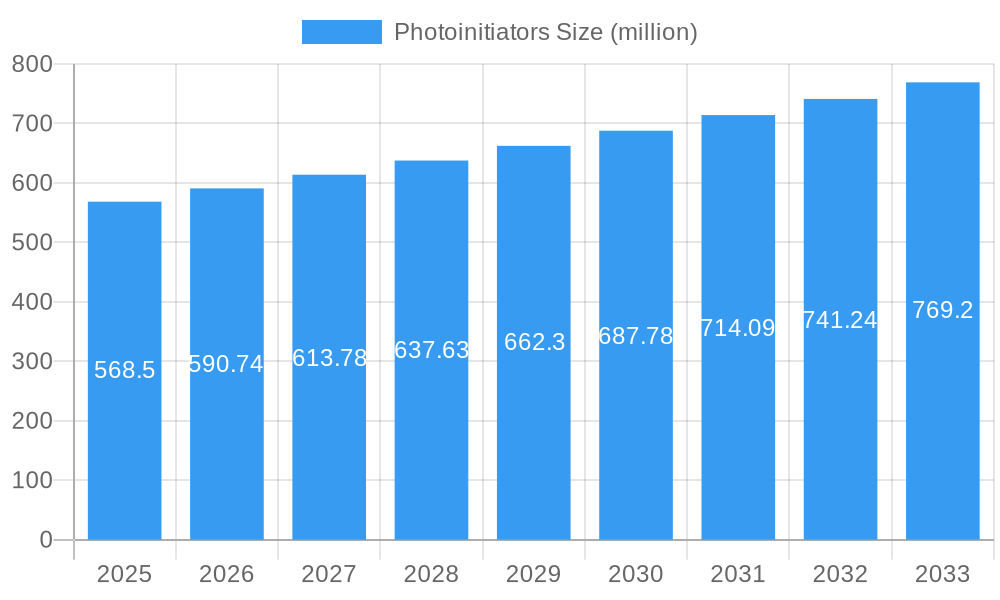
The global photoinitiators market, valued at $568.5 million in 2025, is projected to experience steady growth, driven by increasing demand from various end-use industries. A compound annual growth rate (CAGR) of 4% from 2025 to 2033 indicates a significant expansion, primarily fueled by the escalating adoption of photoinitiators in UV-curable coatings, inks, and adhesives. The rising demand for high-performance materials in packaging, electronics, and 3D printing applications further bolsters market growth. Key market players like IGM Resins, BASF, and Arkema are constantly innovating to offer specialized photoinitiators with improved efficiency, reduced toxicity, and enhanced performance characteristics, driving market competition and further propelling growth. While specific regulatory hurdles and potential fluctuations in raw material prices might pose some challenges, the overall market outlook remains positive, driven by strong technological advancements and consistent industry demand.
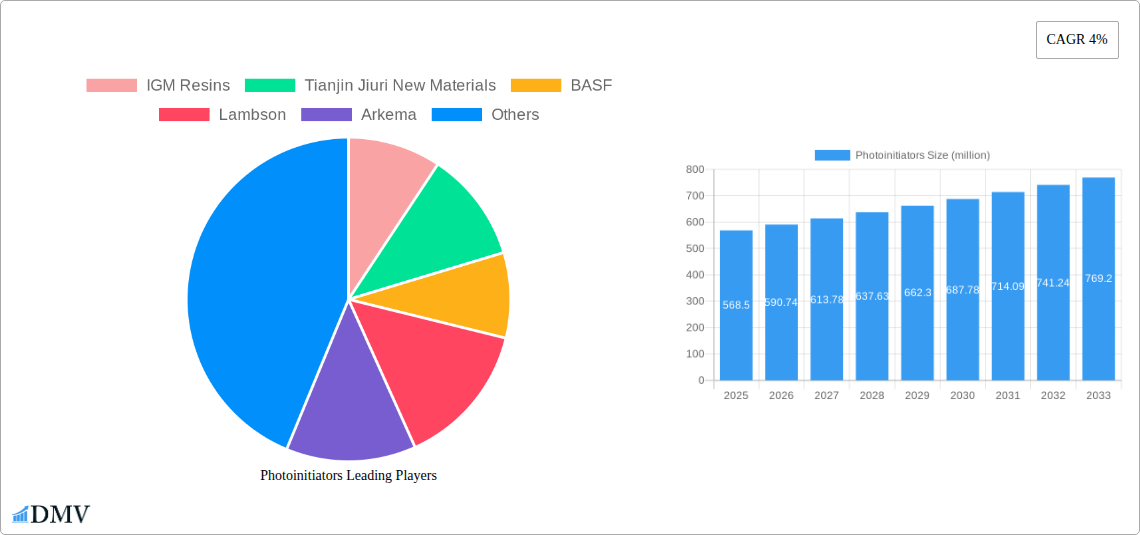
Photoinitiators Market Size (In Million)
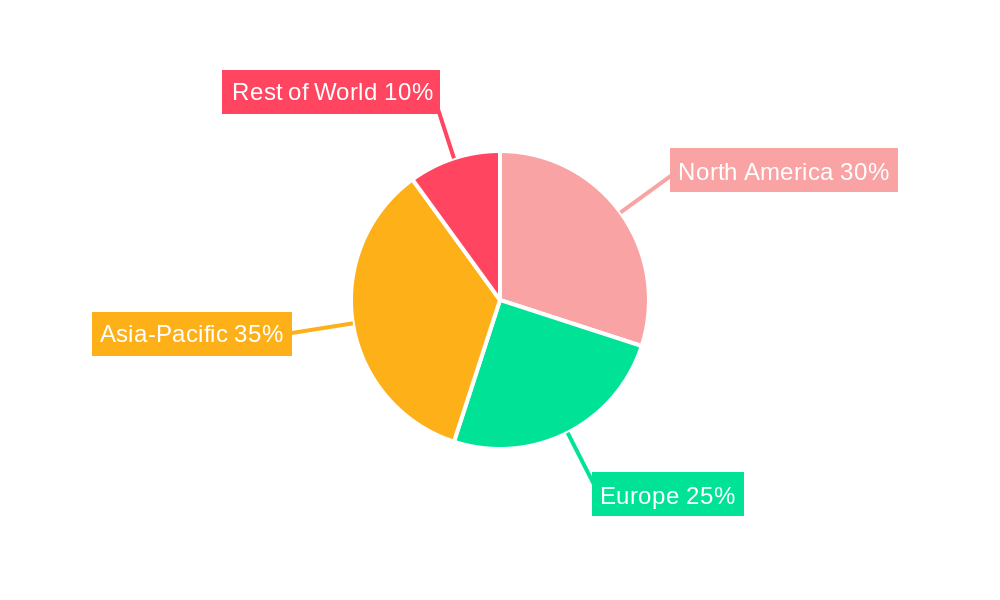
The market segmentation is likely diversified, encompassing various photoinitiator types (e.g., benzophenones, acetophenones, and others) each catering to specific application needs. Regional variations in growth rates are expected, with regions like North America and Europe maintaining substantial market shares due to the established presence of key players and strong demand from various sectors. However, rapidly developing economies in Asia-Pacific are projected to witness considerable growth as the adoption of advanced manufacturing technologies and improved infrastructure increases. The continued research and development in photoinitiator technology, focusing on sustainability and enhanced performance, will be instrumental in shaping the future trajectory of the market. The competitive landscape remains dynamic, with companies strategically focusing on innovation, mergers and acquisitions, and geographical expansion to achieve market dominance.
Photoinitiators Company Market Share
Photoinitiators Market Report: A Comprehensive Analysis (2019-2033)
This insightful report provides a comprehensive analysis of the global Photoinitiators market, offering a detailed examination of market trends, leading players, and future growth prospects. With a study period spanning 2019-2033, a base year of 2025, and a forecast period of 2025-2033, this report is an invaluable resource for stakeholders seeking to understand and capitalize on opportunities within this dynamic market. The global Photoinitiators market is projected to reach xx million by 2033, representing substantial growth from xx million in 2025.
Photoinitiators Market Composition & Trends
This section meticulously analyzes the global Photoinitiators market's structure and evolution. We delve into the competitive landscape, evaluating market concentration and the distribution of market share amongst key players including IGM Resins, Tianjin Jiuri New Materials, BASF, Lambson, Arkema, DBC, NewSun, Eutec, Zhejiang Yangfan New Materials, Tronly, Hongtai Chemical, Jinkangtai Chemical, Polynaisse, Hubei Gurun, and Kurogane Kasei. The report quantifies the market share held by each company in 2025. For instance, BASF is estimated to hold xx% market share, while IGM Resins holds approximately xx%. The report further explores the influence of innovation catalysts, including technological advancements and R&D investments, totaling approximately $xx million in 2024. We analyze the regulatory landscape, highlighting key regional regulations impacting market growth and examine the role of substitute products and their market penetration. The report also explores end-user profiles, detailing their specific needs and preferences and examines recent M&A activities, including deal values (estimated at $xx million in total for the period 2019-2024).
- Market Concentration: High/Medium/Low (Specify based on data analysis) with a Herfindahl-Hirschman Index (HHI) of xx.
- Innovation Catalysts: Focus on UV-LED curing technology advancements and the development of bio-based photoinitiators.
- Regulatory Landscape: Analysis of key regional regulations (e.g., REACH, RoHS) and their impact.
- Substitute Products: Evaluation of competitive threats from alternative curing technologies.
- End-User Profiles: Detailed analysis of major end-use industries (e.g., coatings, inks, adhesives).
- M&A Activities: Summary of significant mergers and acquisitions with deal values.
Photoinitiators Industry Evolution
This section provides a detailed analysis of the Photoinitiators industry's evolutionary trajectory from 2019 to 2033. We examine market growth trajectories, revealing a Compound Annual Growth Rate (CAGR) of xx% during the forecast period (2025-2033). The analysis incorporates technological advancements, such as the increasing adoption of UV-LED curing technology, which is estimated to account for xx% of the market by 2033. This section also explores shifting consumer demands, including a growing preference for environmentally friendly and sustainable photoinitiators. We detail the impact of these factors on market dynamics, supported by specific data points like adoption rates of new technologies and changes in consumer preferences. The report also examines the influence of macroeconomic factors, including fluctuations in raw material prices and global economic growth, on the market's overall performance. The increasing demand for high-performance coatings in various end-use sectors, including automotive and electronics, significantly contributes to market expansion. This is further supported by the rising investments in research and development across leading Photoinitiators manufacturers, totaling an estimated $xx million annually.
Leading Regions, Countries, or Segments in Photoinitiators
This section identifies the dominant regions, countries, or segments in the Photoinitiators market. [Specify the dominant region/country/segment based on your analysis - e.g., Asia-Pacific]. Its dominance is attributed to several key factors, as detailed below:
- Robust Economic Growth: Sustained economic expansion fuels high demand for various applications of photoinitiators.
- Favorable Government Policies: Supportive government initiatives and investment in infrastructure projects contribute significantly.
- High Concentration of Manufacturing Activities: Presence of major manufacturing facilities leads to significant regional production.
The analysis further explores the growth dynamics of other key regions (e.g., North America, Europe) and identifies the key factors influencing their market share. We consider aspects such as regulatory frameworks, economic indicators, and consumer behavior that shape the market's geographic distribution. Detailed analysis of country-specific data is also included, providing a granular view of market performance in each region.
Photoinitiators Product Innovations
Recent years have witnessed significant product innovation in the Photoinitiators market. Manufacturers are developing high-performance photoinitiators with improved efficiency, reduced toxicity, and enhanced compatibility with various substrates. Key innovations include the introduction of novel chemical structures that improve curing speed and efficiency, as well as the development of bio-based photoinitiators to cater to growing environmental concerns. These advancements deliver unique selling propositions such as faster curing times, improved color stability, and enhanced durability in end products. These technological strides have broadened the applications of photoinitiators, driving adoption across diverse industries like coatings, 3D printing, and medical devices.
Propelling Factors for Photoinitiators Growth
Several key factors are driving the growth of the Photoinitiators market. Technological advancements, such as the development of more efficient and environmentally friendly photoinitiators, are at the forefront. The increasing demand from key end-use sectors like coatings, adhesives, and inks also plays a crucial role. Furthermore, favorable regulatory policies and government initiatives aimed at promoting sustainable manufacturing practices contribute to market expansion. The burgeoning 3D printing industry's need for high-performance photoinitiators further boosts market growth.
Obstacles in the Photoinitiators Market
Despite promising growth prospects, the Photoinitiators market faces several challenges. Stringent environmental regulations and increasing concerns over the toxicity of certain photoinitiators create obstacles for manufacturers. Supply chain disruptions, particularly in the sourcing of raw materials, can also impact production and market stability. Intense competition amongst established players and the emergence of new entrants create pricing pressure and limit profitability for some companies. The impact of these challenges is analyzed, with quantifiable estimations of their effects on market growth.
Future Opportunities in Photoinitiators
The Photoinitiators market presents several lucrative opportunities for growth. The emergence of new applications in rapidly growing sectors like 3D printing and biomedical engineering offers significant market potential. The ongoing development of eco-friendly and bio-based photoinitiators caters to growing environmental concerns and opens new market segments. Furthermore, advancements in UV-LED curing technology create further opportunities for efficiency gains and reduced energy consumption.
Key Developments in Photoinitiators Industry
- [Month, Year]: Company X launches a new, eco-friendly photoinitiator. Impact: Increased market share in the sustainable segment.
- [Month, Year]: Merger between Company Y and Company Z. Impact: Enhanced market dominance and expansion into new geographic regions.
- (Add further bullet points with specific dates and impactful developments)
Strategic Photoinitiators Market Forecast
The Photoinitiators market is poised for robust growth in the coming years, driven by technological advancements, increased demand from various end-use industries, and supportive regulatory environments. The market's future growth trajectory will be significantly influenced by the continuous innovation in photoinitiator chemistry, focusing on sustainability and higher performance characteristics. Emerging applications in sectors like 3D printing and biomedical devices offer substantial growth opportunities. This report provides a detailed forecast for the market, outlining growth catalysts and potential market size over the forecast period.
Photoinitiators Segmentation
-
1. Application
- 1.1. Paints
- 1.2. Inks
- 1.3. Adhesives
- 1.4. Others
-
2. Types
- 2.1. Free-radical Type Photoinitiator
- 2.2. Cationic Type Photoinitiator
Photoinitiators Segmentation By Geography
-
1. North America
- 1.1. United States
- 1.2. Canada
- 1.3. Mexico
-
2. South America
- 2.1. Brazil
- 2.2. Argentina
- 2.3. Rest of South America
-
3. Europe
- 3.1. United Kingdom
- 3.2. Germany
- 3.3. France
- 3.4. Italy
- 3.5. Spain
- 3.6. Russia
- 3.7. Benelux
- 3.8. Nordics
- 3.9. Rest of Europe
-
4. Middle East & Africa
- 4.1. Turkey
- 4.2. Israel
- 4.3. GCC
- 4.4. North Africa
- 4.5. South Africa
- 4.6. Rest of Middle East & Africa
-
5. Asia Pacific
- 5.1. China
- 5.2. India
- 5.3. Japan
- 5.4. South Korea
- 5.5. ASEAN
- 5.6. Oceania
- 5.7. Rest of Asia Pacific
Photoinitiators Regional Market Share
Geographic Coverage of Photoinitiators
Photoinitiators REPORT HIGHLIGHTS
| Aspects | Details |
|---|---|
| Study Period | 2020-2034 |
| Base Year | 2025 |
| Estimated Year | 2026 |
| Forecast Period | 2026-2034 |
| Historical Period | 2020-2025 |
| Growth Rate | CAGR of 4% from 2020-2034 |
| Segmentation |
|
Table of Contents
- 1. Introduction
- 1.1. Research Scope
- 1.2. Market Segmentation
- 1.3. Research Methodology
- 1.4. Definitions and Assumptions
- 2. Executive Summary
- 2.1. Introduction
- 3. Market Dynamics
- 3.1. Introduction
- 3.2. Market Drivers
- 3.3. Market Restrains
- 3.4. Market Trends
- 4. Market Factor Analysis
- 4.1. Porters Five Forces
- 4.2. Supply/Value Chain
- 4.3. PESTEL analysis
- 4.4. Market Entropy
- 4.5. Patent/Trademark Analysis
- 5. Global Photoinitiators Analysis, Insights and Forecast, 2020-2032
- 5.1. Market Analysis, Insights and Forecast - by Application
- 5.1.1. Paints
- 5.1.2. Inks
- 5.1.3. Adhesives
- 5.1.4. Others
- 5.2. Market Analysis, Insights and Forecast - by Types
- 5.2.1. Free-radical Type Photoinitiator
- 5.2.2. Cationic Type Photoinitiator
- 5.3. Market Analysis, Insights and Forecast - by Region
- 5.3.1. North America
- 5.3.2. South America
- 5.3.3. Europe
- 5.3.4. Middle East & Africa
- 5.3.5. Asia Pacific
- 5.1. Market Analysis, Insights and Forecast - by Application
- 6. North America Photoinitiators Analysis, Insights and Forecast, 2020-2032
- 6.1. Market Analysis, Insights and Forecast - by Application
- 6.1.1. Paints
- 6.1.2. Inks
- 6.1.3. Adhesives
- 6.1.4. Others
- 6.2. Market Analysis, Insights and Forecast - by Types
- 6.2.1. Free-radical Type Photoinitiator
- 6.2.2. Cationic Type Photoinitiator
- 6.1. Market Analysis, Insights and Forecast - by Application
- 7. South America Photoinitiators Analysis, Insights and Forecast, 2020-2032
- 7.1. Market Analysis, Insights and Forecast - by Application
- 7.1.1. Paints
- 7.1.2. Inks
- 7.1.3. Adhesives
- 7.1.4. Others
- 7.2. Market Analysis, Insights and Forecast - by Types
- 7.2.1. Free-radical Type Photoinitiator
- 7.2.2. Cationic Type Photoinitiator
- 7.1. Market Analysis, Insights and Forecast - by Application
- 8. Europe Photoinitiators Analysis, Insights and Forecast, 2020-2032
- 8.1. Market Analysis, Insights and Forecast - by Application
- 8.1.1. Paints
- 8.1.2. Inks
- 8.1.3. Adhesives
- 8.1.4. Others
- 8.2. Market Analysis, Insights and Forecast - by Types
- 8.2.1. Free-radical Type Photoinitiator
- 8.2.2. Cationic Type Photoinitiator
- 8.1. Market Analysis, Insights and Forecast - by Application
- 9. Middle East & Africa Photoinitiators Analysis, Insights and Forecast, 2020-2032
- 9.1. Market Analysis, Insights and Forecast - by Application
- 9.1.1. Paints
- 9.1.2. Inks
- 9.1.3. Adhesives
- 9.1.4. Others
- 9.2. Market Analysis, Insights and Forecast - by Types
- 9.2.1. Free-radical Type Photoinitiator
- 9.2.2. Cationic Type Photoinitiator
- 9.1. Market Analysis, Insights and Forecast - by Application
- 10. Asia Pacific Photoinitiators Analysis, Insights and Forecast, 2020-2032
- 10.1. Market Analysis, Insights and Forecast - by Application
- 10.1.1. Paints
- 10.1.2. Inks
- 10.1.3. Adhesives
- 10.1.4. Others
- 10.2. Market Analysis, Insights and Forecast - by Types
- 10.2.1. Free-radical Type Photoinitiator
- 10.2.2. Cationic Type Photoinitiator
- 10.1. Market Analysis, Insights and Forecast - by Application
- 11. Competitive Analysis
- 11.1. Global Market Share Analysis 2025
- 11.2. Company Profiles
- 11.2.1 IGM Resins
- 11.2.1.1. Overview
- 11.2.1.2. Products
- 11.2.1.3. SWOT Analysis
- 11.2.1.4. Recent Developments
- 11.2.1.5. Financials (Based on Availability)
- 11.2.2 Tianjin Jiuri New Materials
- 11.2.2.1. Overview
- 11.2.2.2. Products
- 11.2.2.3. SWOT Analysis
- 11.2.2.4. Recent Developments
- 11.2.2.5. Financials (Based on Availability)
- 11.2.3 BASF
- 11.2.3.1. Overview
- 11.2.3.2. Products
- 11.2.3.3. SWOT Analysis
- 11.2.3.4. Recent Developments
- 11.2.3.5. Financials (Based on Availability)
- 11.2.4 Lambson
- 11.2.4.1. Overview
- 11.2.4.2. Products
- 11.2.4.3. SWOT Analysis
- 11.2.4.4. Recent Developments
- 11.2.4.5. Financials (Based on Availability)
- 11.2.5 Arkema
- 11.2.5.1. Overview
- 11.2.5.2. Products
- 11.2.5.3. SWOT Analysis
- 11.2.5.4. Recent Developments
- 11.2.5.5. Financials (Based on Availability)
- 11.2.6 DBC
- 11.2.6.1. Overview
- 11.2.6.2. Products
- 11.2.6.3. SWOT Analysis
- 11.2.6.4. Recent Developments
- 11.2.6.5. Financials (Based on Availability)
- 11.2.7 NewSun
- 11.2.7.1. Overview
- 11.2.7.2. Products
- 11.2.7.3. SWOT Analysis
- 11.2.7.4. Recent Developments
- 11.2.7.5. Financials (Based on Availability)
- 11.2.8 Eutec
- 11.2.8.1. Overview
- 11.2.8.2. Products
- 11.2.8.3. SWOT Analysis
- 11.2.8.4. Recent Developments
- 11.2.8.5. Financials (Based on Availability)
- 11.2.9 Zhejiang Yangfan New Materials
- 11.2.9.1. Overview
- 11.2.9.2. Products
- 11.2.9.3. SWOT Analysis
- 11.2.9.4. Recent Developments
- 11.2.9.5. Financials (Based on Availability)
- 11.2.10 Tronly
- 11.2.10.1. Overview
- 11.2.10.2. Products
- 11.2.10.3. SWOT Analysis
- 11.2.10.4. Recent Developments
- 11.2.10.5. Financials (Based on Availability)
- 11.2.11 Hongtai Chemical
- 11.2.11.1. Overview
- 11.2.11.2. Products
- 11.2.11.3. SWOT Analysis
- 11.2.11.4. Recent Developments
- 11.2.11.5. Financials (Based on Availability)
- 11.2.12 Jinkangtai Chemical
- 11.2.12.1. Overview
- 11.2.12.2. Products
- 11.2.12.3. SWOT Analysis
- 11.2.12.4. Recent Developments
- 11.2.12.5. Financials (Based on Availability)
- 11.2.13 Polynaisse
- 11.2.13.1. Overview
- 11.2.13.2. Products
- 11.2.13.3. SWOT Analysis
- 11.2.13.4. Recent Developments
- 11.2.13.5. Financials (Based on Availability)
- 11.2.14 Hubei Gurun
- 11.2.14.1. Overview
- 11.2.14.2. Products
- 11.2.14.3. SWOT Analysis
- 11.2.14.4. Recent Developments
- 11.2.14.5. Financials (Based on Availability)
- 11.2.15 Kurogane Kasei
- 11.2.15.1. Overview
- 11.2.15.2. Products
- 11.2.15.3. SWOT Analysis
- 11.2.15.4. Recent Developments
- 11.2.15.5. Financials (Based on Availability)
- 11.2.1 IGM Resins
List of Figures
- Figure 1: Global Photoinitiators Revenue Breakdown (million, %) by Region 2025 & 2033
- Figure 2: North America Photoinitiators Revenue (million), by Application 2025 & 2033
- Figure 3: North America Photoinitiators Revenue Share (%), by Application 2025 & 2033
- Figure 4: North America Photoinitiators Revenue (million), by Types 2025 & 2033
- Figure 5: North America Photoinitiators Revenue Share (%), by Types 2025 & 2033
- Figure 6: North America Photoinitiators Revenue (million), by Country 2025 & 2033
- Figure 7: North America Photoinitiators Revenue Share (%), by Country 2025 & 2033
- Figure 8: South America Photoinitiators Revenue (million), by Application 2025 & 2033
- Figure 9: South America Photoinitiators Revenue Share (%), by Application 2025 & 2033
- Figure 10: South America Photoinitiators Revenue (million), by Types 2025 & 2033
- Figure 11: South America Photoinitiators Revenue Share (%), by Types 2025 & 2033
- Figure 12: South America Photoinitiators Revenue (million), by Country 2025 & 2033
- Figure 13: South America Photoinitiators Revenue Share (%), by Country 2025 & 2033
- Figure 14: Europe Photoinitiators Revenue (million), by Application 2025 & 2033
- Figure 15: Europe Photoinitiators Revenue Share (%), by Application 2025 & 2033
- Figure 16: Europe Photoinitiators Revenue (million), by Types 2025 & 2033
- Figure 17: Europe Photoinitiators Revenue Share (%), by Types 2025 & 2033
- Figure 18: Europe Photoinitiators Revenue (million), by Country 2025 & 2033
- Figure 19: Europe Photoinitiators Revenue Share (%), by Country 2025 & 2033
- Figure 20: Middle East & Africa Photoinitiators Revenue (million), by Application 2025 & 2033
- Figure 21: Middle East & Africa Photoinitiators Revenue Share (%), by Application 2025 & 2033
- Figure 22: Middle East & Africa Photoinitiators Revenue (million), by Types 2025 & 2033
- Figure 23: Middle East & Africa Photoinitiators Revenue Share (%), by Types 2025 & 2033
- Figure 24: Middle East & Africa Photoinitiators Revenue (million), by Country 2025 & 2033
- Figure 25: Middle East & Africa Photoinitiators Revenue Share (%), by Country 2025 & 2033
- Figure 26: Asia Pacific Photoinitiators Revenue (million), by Application 2025 & 2033
- Figure 27: Asia Pacific Photoinitiators Revenue Share (%), by Application 2025 & 2033
- Figure 28: Asia Pacific Photoinitiators Revenue (million), by Types 2025 & 2033
- Figure 29: Asia Pacific Photoinitiators Revenue Share (%), by Types 2025 & 2033
- Figure 30: Asia Pacific Photoinitiators Revenue (million), by Country 2025 & 2033
- Figure 31: Asia Pacific Photoinitiators Revenue Share (%), by Country 2025 & 2033
List of Tables
- Table 1: Global Photoinitiators Revenue million Forecast, by Application 2020 & 2033
- Table 2: Global Photoinitiators Revenue million Forecast, by Types 2020 & 2033
- Table 3: Global Photoinitiators Revenue million Forecast, by Region 2020 & 2033
- Table 4: Global Photoinitiators Revenue million Forecast, by Application 2020 & 2033
- Table 5: Global Photoinitiators Revenue million Forecast, by Types 2020 & 2033
- Table 6: Global Photoinitiators Revenue million Forecast, by Country 2020 & 2033
- Table 7: United States Photoinitiators Revenue (million) Forecast, by Application 2020 & 2033
- Table 8: Canada Photoinitiators Revenue (million) Forecast, by Application 2020 & 2033
- Table 9: Mexico Photoinitiators Revenue (million) Forecast, by Application 2020 & 2033
- Table 10: Global Photoinitiators Revenue million Forecast, by Application 2020 & 2033
- Table 11: Global Photoinitiators Revenue million Forecast, by Types 2020 & 2033
- Table 12: Global Photoinitiators Revenue million Forecast, by Country 2020 & 2033
- Table 13: Brazil Photoinitiators Revenue (million) Forecast, by Application 2020 & 2033
- Table 14: Argentina Photoinitiators Revenue (million) Forecast, by Application 2020 & 2033
- Table 15: Rest of South America Photoinitiators Revenue (million) Forecast, by Application 2020 & 2033
- Table 16: Global Photoinitiators Revenue million Forecast, by Application 2020 & 2033
- Table 17: Global Photoinitiators Revenue million Forecast, by Types 2020 & 2033
- Table 18: Global Photoinitiators Revenue million Forecast, by Country 2020 & 2033
- Table 19: United Kingdom Photoinitiators Revenue (million) Forecast, by Application 2020 & 2033
- Table 20: Germany Photoinitiators Revenue (million) Forecast, by Application 2020 & 2033
- Table 21: France Photoinitiators Revenue (million) Forecast, by Application 2020 & 2033
- Table 22: Italy Photoinitiators Revenue (million) Forecast, by Application 2020 & 2033
- Table 23: Spain Photoinitiators Revenue (million) Forecast, by Application 2020 & 2033
- Table 24: Russia Photoinitiators Revenue (million) Forecast, by Application 2020 & 2033
- Table 25: Benelux Photoinitiators Revenue (million) Forecast, by Application 2020 & 2033
- Table 26: Nordics Photoinitiators Revenue (million) Forecast, by Application 2020 & 2033
- Table 27: Rest of Europe Photoinitiators Revenue (million) Forecast, by Application 2020 & 2033
- Table 28: Global Photoinitiators Revenue million Forecast, by Application 2020 & 2033
- Table 29: Global Photoinitiators Revenue million Forecast, by Types 2020 & 2033
- Table 30: Global Photoinitiators Revenue million Forecast, by Country 2020 & 2033
- Table 31: Turkey Photoinitiators Revenue (million) Forecast, by Application 2020 & 2033
- Table 32: Israel Photoinitiators Revenue (million) Forecast, by Application 2020 & 2033
- Table 33: GCC Photoinitiators Revenue (million) Forecast, by Application 2020 & 2033
- Table 34: North Africa Photoinitiators Revenue (million) Forecast, by Application 2020 & 2033
- Table 35: South Africa Photoinitiators Revenue (million) Forecast, by Application 2020 & 2033
- Table 36: Rest of Middle East & Africa Photoinitiators Revenue (million) Forecast, by Application 2020 & 2033
- Table 37: Global Photoinitiators Revenue million Forecast, by Application 2020 & 2033
- Table 38: Global Photoinitiators Revenue million Forecast, by Types 2020 & 2033
- Table 39: Global Photoinitiators Revenue million Forecast, by Country 2020 & 2033
- Table 40: China Photoinitiators Revenue (million) Forecast, by Application 2020 & 2033
- Table 41: India Photoinitiators Revenue (million) Forecast, by Application 2020 & 2033
- Table 42: Japan Photoinitiators Revenue (million) Forecast, by Application 2020 & 2033
- Table 43: South Korea Photoinitiators Revenue (million) Forecast, by Application 2020 & 2033
- Table 44: ASEAN Photoinitiators Revenue (million) Forecast, by Application 2020 & 2033
- Table 45: Oceania Photoinitiators Revenue (million) Forecast, by Application 2020 & 2033
- Table 46: Rest of Asia Pacific Photoinitiators Revenue (million) Forecast, by Application 2020 & 2033
Frequently Asked Questions
1. What is the projected Compound Annual Growth Rate (CAGR) of the Photoinitiators?
The projected CAGR is approximately 4%.
2. Which companies are prominent players in the Photoinitiators?
Key companies in the market include IGM Resins, Tianjin Jiuri New Materials, BASF, Lambson, Arkema, DBC, NewSun, Eutec, Zhejiang Yangfan New Materials, Tronly, Hongtai Chemical, Jinkangtai Chemical, Polynaisse, Hubei Gurun, Kurogane Kasei.
3. What are the main segments of the Photoinitiators?
The market segments include Application, Types.
4. Can you provide details about the market size?
The market size is estimated to be USD 568.5 million as of 2022.
5. What are some drivers contributing to market growth?
N/A
6. What are the notable trends driving market growth?
N/A
7. Are there any restraints impacting market growth?
N/A
8. Can you provide examples of recent developments in the market?
N/A
9. What pricing options are available for accessing the report?
Pricing options include single-user, multi-user, and enterprise licenses priced at USD 4900.00, USD 7350.00, and USD 9800.00 respectively.
10. Is the market size provided in terms of value or volume?
The market size is provided in terms of value, measured in million.
11. Are there any specific market keywords associated with the report?
Yes, the market keyword associated with the report is "Photoinitiators," which aids in identifying and referencing the specific market segment covered.
12. How do I determine which pricing option suits my needs best?
The pricing options vary based on user requirements and access needs. Individual users may opt for single-user licenses, while businesses requiring broader access may choose multi-user or enterprise licenses for cost-effective access to the report.
13. Are there any additional resources or data provided in the Photoinitiators report?
While the report offers comprehensive insights, it's advisable to review the specific contents or supplementary materials provided to ascertain if additional resources or data are available.
14. How can I stay updated on further developments or reports in the Photoinitiators?
To stay informed about further developments, trends, and reports in the Photoinitiators, consider subscribing to industry newsletters, following relevant companies and organizations, or regularly checking reputable industry news sources and publications.
Methodology
Step 1 - Identification of Relevant Samples Size from Population Database


Step 2 - Approaches for Defining Global Market Size (Value, Volume* & Price*)

Note*: In applicable scenarios
Step 3 - Data Sources
Primary Research
- Web Analytics
- Survey Reports
- Research Institute
- Latest Research Reports
- Opinion Leaders
Secondary Research
- Annual Reports
- White Paper
- Latest Press Release
- Industry Association
- Paid Database
- Investor Presentations

Step 4 - Data Triangulation
Involves using different sources of information in order to increase the validity of a study
These sources are likely to be stakeholders in a program - participants, other researchers, program staff, other community members, and so on.
Then we put all data in single framework & apply various statistical tools to find out the dynamic on the market.
During the analysis stage, feedback from the stakeholder groups would be compared to determine areas of agreement as well as areas of divergence