

Key Insights
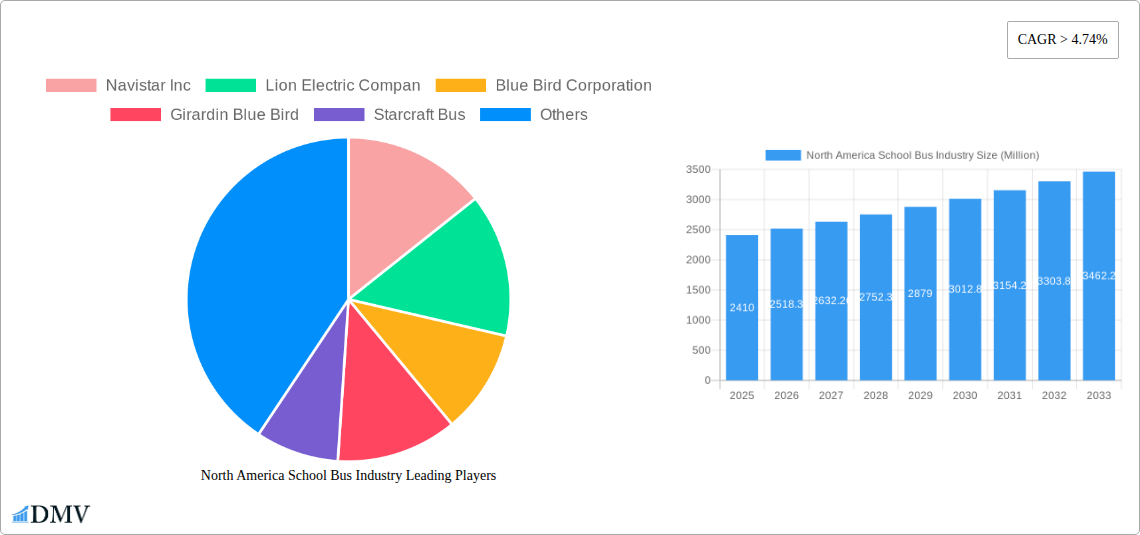
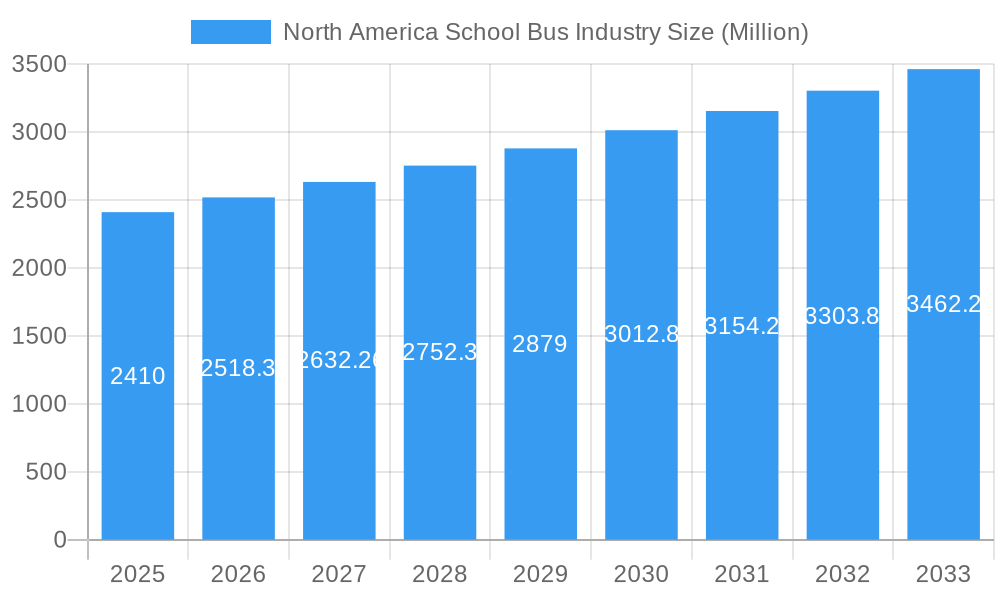
The North American school bus industry, valued at $2.41 billion in 2025, is projected to experience robust growth, exhibiting a compound annual growth rate (CAGR) exceeding 4.74% from 2025 to 2033. This expansion is fueled by several key factors. Increasing school enrollment, particularly in rapidly growing regions, necessitates a larger fleet of buses. Furthermore, stringent government regulations mandating safer and more environmentally friendly vehicles are driving demand for newer, technologically advanced models, including electric school buses. The shift towards electric powertrains is a significant trend, driven by concerns about emissions and the availability of government incentives. However, the high initial cost of electric buses remains a significant restraint, potentially slowing the overall adoption rate in the short term. Market segmentation reveals a preference for Type C and Type D buses, representing the majority of the market share, while other types cater to niche requirements. Key players like Navistar Inc, Lion Electric Co, and Blue Bird Corporation are actively competing, investing in innovation and expanding their product lines to capitalize on the growth opportunities. The industry's success hinges on striking a balance between the need for cost-effective solutions and the increasing demand for sustainable and technologically advanced transportation for students.
North America School Bus Industry Market Size (In Billion)
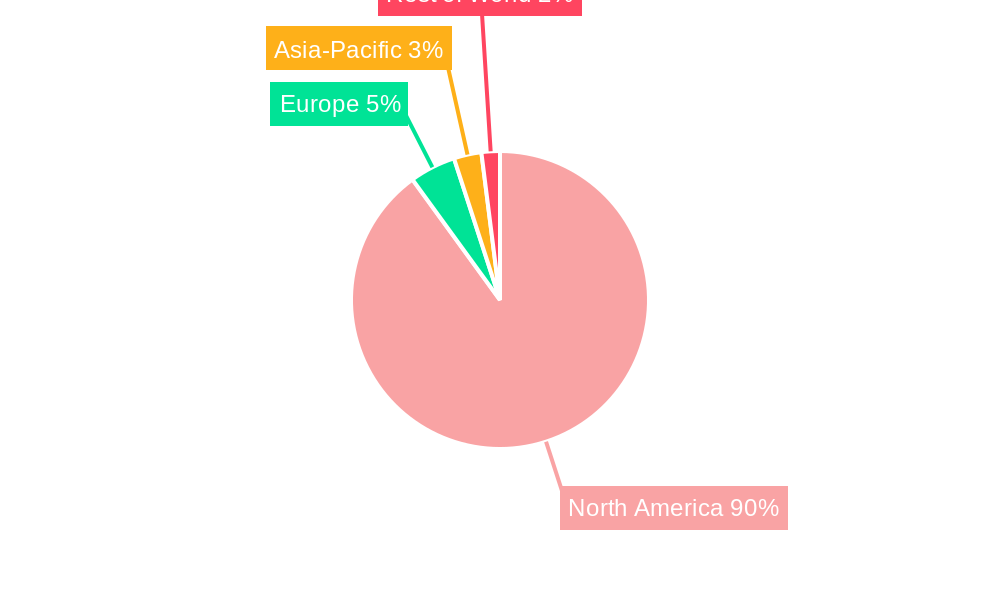
The regional breakdown shows North America, particularly the United States, as the dominant market, accounting for a significant portion of the overall revenue. Canada and Mexico contribute notably, albeit at a smaller scale. Future growth will be shaped by government policies promoting electric vehicle adoption, advancements in bus technologies (such as improved safety features and fuel efficiency), and the overall economic climate. The industry faces challenges in managing rising manufacturing and operational costs, along with the ongoing supply chain complexities impacting the availability of components. Nevertheless, the long-term outlook for the North American school bus industry remains positive, driven by consistent demand and the imperative to provide safe and reliable transportation to students.
North America School Bus Industry Company Market Share
North America School Bus Industry Market Report: 2019-2033
This comprehensive report provides an in-depth analysis of the North America school bus industry, encompassing market size, trends, leading players, and future forecasts from 2019 to 2033. With a base year of 2025 and an estimated market value of xx Million, this report offers invaluable insights for stakeholders seeking to understand and capitalize on the evolving dynamics of this crucial sector. The study period covers the historical period (2019-2024), the forecast period (2025-2033), and provides an estimated view for 2025.
North America School Bus Industry Market Composition & Trends
This section delves into the intricate landscape of the North American school bus market, analyzing key aspects driving its evolution. We examine market concentration, revealing the dominance of major players and the competitive intensity within the industry. Innovation catalysts, such as the shift towards electric vehicles and advancements in safety features, are meticulously explored. The report further investigates the regulatory landscape and its impact, scrutinizing the influence of environmental regulations and safety standards. A detailed analysis of substitute products, end-user profiles (school districts, private operators), and the impact of mergers and acquisitions (M&A) activities, including deal values (xx Million), completes this segment.
- Market Share Distribution: Blue Bird Corporation, Thomas Built Buses, and Lion Electric Company hold significant market share, with xx%, xx%, and xx% respectively, in the estimated year 2025. Other notable players like Navistar Inc., Collins Bus Corporation, and Starcraft Bus collectively contribute to the remaining market share.
- M&A Activity: The report includes a detailed analysis of recent M&A activities within the industry, pinpointing key transactions and their effect on market dynamics. For example, xx Million in M&A activity was observed between 2022 and 2023.
- Innovation Catalysts: The increasing demand for electric school buses and the integration of advanced safety technologies are driving innovation within the sector.
- Regulatory Landscape: Stringent emission standards and safety regulations are influencing product development and market strategies.
North America School Bus Industry Industry Evolution
This section provides a comprehensive analysis of the North American school bus industry's evolutionary journey, encompassing market growth trajectories, technological advancements, and evolving consumer demands over the study period (2019-2033). The transition from traditional internal combustion engine (ICE) buses to electric vehicles (EVs) is meticulously examined, with precise data points illustrating growth rates and adoption metrics. We project a compound annual growth rate (CAGR) of xx% for the electric school bus segment during the forecast period (2025-2033). The influence of factors like increasing fuel prices, environmental concerns, and government incentives on market growth will also be discussed.
Leading Regions, Countries, or Segments in North America School Bus Industry
This section identifies the dominant regions, countries, and segments within the North American school bus industry. Key factors driving the dominance of specific segments (e.g., Type C and Type D buses, electric powertrains) are analyzed.
- Dominant Segment: The Type C segment currently holds the largest market share, driven by its widespread adoption across diverse school districts. The Electric powertrain segment is experiencing rapid growth, propelled by government initiatives and environmental concerns.
- Key Drivers:
- California: Stringent emission regulations and substantial government funding for electric school buses are driving significant market growth.
- Investment Trends: Increased private and public investment in electric school bus infrastructure is supporting the adoption of electric vehicles.
- Regulatory Support: Federal and state-level incentives and mandates are creating a favorable environment for the adoption of electric and alternative fuel buses.
The analysis of this section meticulously explores the factors contributing to the dominance of each leading segment, providing a granular understanding of market dynamics within specific geographic locations and vehicle types.
North America School Bus Industry Product Innovations
The North American school bus industry is witnessing a surge of product innovations, driven by the need for enhanced safety, improved fuel efficiency, and reduced emissions. Key innovations include the adoption of electric powertrains, advanced driver-assistance systems (ADAS), and lightweight materials resulting in increased fuel efficiency and reduced operational costs. These innovations are not only improving the operational performance of school buses but also enhancing passenger safety and comfort. Unique selling propositions such as extended battery ranges and enhanced safety features are key differentiators in the increasingly competitive market.
Propelling Factors for North America School Bus Industry Growth
Several factors are fueling the growth of the North American school bus industry. Technological advancements, such as the development of electric and hybrid buses, are reducing operating costs and environmental impact. Government regulations promoting cleaner transportation and stricter emission standards are encouraging the adoption of more environmentally friendly vehicles. Economic factors, including increased funding for school districts and the growing need for reliable transportation solutions, are also contributing to industry growth.
Obstacles in the North America School Bus Industry Market
Despite the positive growth trajectory, the North American school bus industry faces several challenges. Supply chain disruptions, including the shortage of essential components like batteries and microchips, are impacting production and delivery timelines. The high upfront cost of electric school buses presents a significant barrier to adoption, and intense competition among manufacturers puts pressure on profit margins. Regulatory hurdles and inconsistencies across different states further complicate the industry landscape, hindering smooth market expansion.
Future Opportunities in North America School Bus Industry
The future of the North American school bus industry holds significant opportunities. The expanding market for electric school buses, driven by environmental concerns and government incentives, presents a major avenue for growth. The integration of advanced technologies, such as telematics and autonomous driving features, offers further opportunities for innovation and market expansion. Exploring new markets and expanding into underserved regions also presents significant growth potential for industry players.
Major Players in the North America School Bus Industry Ecosystem
- Navistar Inc.
- Lion Electric Company
- Blue Bird Corporation
- Girardin Blue Bird
- Starcraft Bus
- Trans Tech
- Collins Bus Corporation
- Daimler AG (Thomas Built Buses)
Key Developments in North America School Bus Industry Industry
- October 2023: Blue Bird delivers its 1,500th electric school bus and inaugurates its EV Build-up Center in Georgia, aiming for a 5,000-bus annual production capacity. This significantly boosts Blue Bird's position in the electric school bus market.
- November 2023: Lion Electric secures a provisional purchase order for 50 LionC all-electric school buses from Highland Electric Fleets, highlighting the increasing demand for electric school buses and the expansion of electrification-as-a-service models.
- November 2022: Lion Electric begins production of its zero-emission LionC school bus at its Joliet, Illinois, factory, marking a key milestone in expanding its US manufacturing presence.
- October 2022: Thomas Built Buses delivers its 200th electric school bus, showcasing the growing adoption of electric buses in school districts.
- March 2022: Thomas Built Buses and Highland Electric Fleets expand their partnership to accelerate electric school bus adoption by reducing upfront costs for school districts.
Strategic North America School Bus Industry Market Forecast
The North American school bus industry is poised for significant growth in the coming years, driven by the increasing demand for electric school buses, technological advancements, and supportive government policies. The continued expansion of charging infrastructure and the development of innovative battery technologies will further accelerate the transition towards cleaner transportation solutions. The market is projected to witness substantial growth, driven by both government and private sector initiatives, making it a compelling investment opportunity for stakeholders.
North America School Bus Industry Segmentation
-
1. Powertrain
- 1.1. IC Engine
- 1.2. Electric
-
2. Bus Type
- 2.1. Type C
- 2.2. Type D
- 2.3. Other Types
-
3. Geography
- 3.1. United States
- 3.2. Canada
- 3.3. Rest of North America
North America School Bus Industry Segmentation By Geography
- 1. United States
- 2. Canada
- 3. Rest of North America
North America School Bus Industry Regional Market Share
Geographic Coverage of North America School Bus Industry
North America School Bus Industry REPORT HIGHLIGHTS
| Aspects | Details |
|---|---|
| Study Period | 2020-2034 |
| Base Year | 2025 |
| Estimated Year | 2026 |
| Forecast Period | 2026-2034 |
| Historical Period | 2020-2025 |
| Growth Rate | CAGR of > 4.74% from 2020-2034 |
| Segmentation |
|
Table of Contents
- 1. Introduction
- 1.1. Research Scope
- 1.2. Market Segmentation
- 1.3. Research Objective
- 1.4. Definitions and Assumptions
- 2. Executive Summary
- 2.1. Market Snapshot
- 3. Market Dynamics
- 3.1. Market Drivers
- 3.2. Market Restrains
- 3.3. Market Trends
- 3.4. Market Opportunities
- 4. Market Factor Analysis
- 4.1. Porters Five Forces
- 4.1.1. Bargaining Power of Suppliers
- 4.1.2. Bargaining Power of Buyers
- 4.1.3. Threat of New Entrants
- 4.1.4. Threat of Substitutes
- 4.1.5. Competitive Rivalry
- 4.2. PESTEL analysis
- 4.3. BCG Analysis
- 4.3.1. Stars (High Growth, High Market Share)
- 4.3.2. Cash Cows (Low Growth, High Market Share)
- 4.3.3. Question Mark (High Growth, Low Market Share)
- 4.3.4. Dogs (Low Growth, Low Market Share)
- 4.4. Ansoff Matrix Analysis
- 4.5. Supply Chain Analysis
- 4.6. Regulatory Landscape
- 4.7. Current Market Potential and Opportunity Assessment (TAM–SAM–SOM Framework)
- 4.8. DMV Analyst Note
- 4.1. Porters Five Forces
- 5. Market Analysis, Insights and Forecast 2021-2033
- 5.1. Market Analysis, Insights and Forecast - by Powertrain
- 5.1.1. IC Engine
- 5.1.2. Electric
- 5.2. Market Analysis, Insights and Forecast - by Bus Type
- 5.2.1. Type C
- 5.2.2. Type D
- 5.2.3. Other Types
- 5.3. Market Analysis, Insights and Forecast - by Geography
- 5.3.1. United States
- 5.3.2. Canada
- 5.3.3. Rest of North America
- 5.4. Market Analysis, Insights and Forecast - by Region
- 5.4.1. United States
- 5.4.2. Canada
- 5.4.3. Rest of North America
- 5.1. Market Analysis, Insights and Forecast - by Powertrain
- 6. North America School Bus Industry Analysis, Insights and Forecast, 2021-2033
- 6.1. Market Analysis, Insights and Forecast - by Powertrain
- 6.1.1. IC Engine
- 6.1.2. Electric
- 6.2. Market Analysis, Insights and Forecast - by Bus Type
- 6.2.1. Type C
- 6.2.2. Type D
- 6.2.3. Other Types
- 6.3. Market Analysis, Insights and Forecast - by Geography
- 6.3.1. United States
- 6.3.2. Canada
- 6.3.3. Rest of North America
- 6.1. Market Analysis, Insights and Forecast - by Powertrain
- 7. United States North America School Bus Industry Analysis, Insights and Forecast, 2020-2032
- 7.1. Market Analysis, Insights and Forecast - by Powertrain
- 7.1.1. IC Engine
- 7.1.2. Electric
- 7.2. Market Analysis, Insights and Forecast - by Bus Type
- 7.2.1. Type C
- 7.2.2. Type D
- 7.2.3. Other Types
- 7.3. Market Analysis, Insights and Forecast - by Geography
- 7.3.1. United States
- 7.3.2. Canada
- 7.3.3. Rest of North America
- 7.1. Market Analysis, Insights and Forecast - by Powertrain
- 8. Canada North America School Bus Industry Analysis, Insights and Forecast, 2020-2032
- 8.1. Market Analysis, Insights and Forecast - by Powertrain
- 8.1.1. IC Engine
- 8.1.2. Electric
- 8.2. Market Analysis, Insights and Forecast - by Bus Type
- 8.2.1. Type C
- 8.2.2. Type D
- 8.2.3. Other Types
- 8.3. Market Analysis, Insights and Forecast - by Geography
- 8.3.1. United States
- 8.3.2. Canada
- 8.3.3. Rest of North America
- 8.1. Market Analysis, Insights and Forecast - by Powertrain
- 9. Rest of North America North America School Bus Industry Analysis, Insights and Forecast, 2020-2032
- 9.1. Market Analysis, Insights and Forecast - by Powertrain
- 9.1.1. IC Engine
- 9.1.2. Electric
- 9.2. Market Analysis, Insights and Forecast - by Bus Type
- 9.2.1. Type C
- 9.2.2. Type D
- 9.2.3. Other Types
- 9.3. Market Analysis, Insights and Forecast - by Geography
- 9.3.1. United States
- 9.3.2. Canada
- 9.3.3. Rest of North America
- 9.1. Market Analysis, Insights and Forecast - by Powertrain
- 10. Competitive Analysis
- 10.1. Company Profiles
- 10.1.1 Navistar Inc
- 10.1.1.1. Company Overview
- 10.1.1.2. Products
- 10.1.1.3. Company Financials
- 10.1.1.4. SWOT Analysis
- 10.1.2 Lion Electric Compan
- 10.1.2.1. Company Overview
- 10.1.2.2. Products
- 10.1.2.3. Company Financials
- 10.1.2.4. SWOT Analysis
- 10.1.3 Blue Bird Corporation
- 10.1.3.1. Company Overview
- 10.1.3.2. Products
- 10.1.3.3. Company Financials
- 10.1.3.4. SWOT Analysis
- 10.1.4 Girardin Blue Bird
- 10.1.4.1. Company Overview
- 10.1.4.2. Products
- 10.1.4.3. Company Financials
- 10.1.4.4. SWOT Analysis
- 10.1.5 Starcraft Bus
- 10.1.5.1. Company Overview
- 10.1.5.2. Products
- 10.1.5.3. Company Financials
- 10.1.5.4. SWOT Analysis
- 10.1.6 Trans Tech
- 10.1.6.1. Company Overview
- 10.1.6.2. Products
- 10.1.6.3. Company Financials
- 10.1.6.4. SWOT Analysis
- 10.1.7 Collins Bus Corporation
- 10.1.7.1. Company Overview
- 10.1.7.2. Products
- 10.1.7.3. Company Financials
- 10.1.7.4. SWOT Analysis
- 10.1.8 Daimler AG (Thomas Built Buses)
- 10.1.8.1. Company Overview
- 10.1.8.2. Products
- 10.1.8.3. Company Financials
- 10.1.8.4. SWOT Analysis
- 10.1.1 Navistar Inc
- 10.2. Market Entropy
- 10.2.1 Company's Key Areas Served
- 10.2.2 Recent Developments
- 10.3. Company Market Share Analysis 2025
- 10.3.1 Top 5 Companies Market Share Analysis
- 10.3.2 Top 3 Companies Market Share Analysis
- 10.4. List of Potential Customers
- 11. Research Methodology
List of Figures
- Figure 1: North America School Bus Industry Revenue Breakdown (Million, %) by Product 2025 & 2033
- Figure 2: North America School Bus Industry Share (%) by Company 2025
List of Tables
- Table 1: North America School Bus Industry Revenue Million Forecast, by Powertrain 2020 & 2033
- Table 2: North America School Bus Industry Revenue Million Forecast, by Bus Type 2020 & 2033
- Table 3: North America School Bus Industry Revenue Million Forecast, by Geography 2020 & 2033
- Table 4: North America School Bus Industry Revenue Million Forecast, by Region 2020 & 2033
- Table 5: North America School Bus Industry Revenue Million Forecast, by Powertrain 2020 & 2033
- Table 6: North America School Bus Industry Revenue Million Forecast, by Bus Type 2020 & 2033
- Table 7: North America School Bus Industry Revenue Million Forecast, by Geography 2020 & 2033
- Table 8: North America School Bus Industry Revenue Million Forecast, by Country 2020 & 2033
- Table 9: North America School Bus Industry Revenue Million Forecast, by Powertrain 2020 & 2033
- Table 10: North America School Bus Industry Revenue Million Forecast, by Bus Type 2020 & 2033
- Table 11: North America School Bus Industry Revenue Million Forecast, by Geography 2020 & 2033
- Table 12: North America School Bus Industry Revenue Million Forecast, by Country 2020 & 2033
- Table 13: North America School Bus Industry Revenue Million Forecast, by Powertrain 2020 & 2033
- Table 14: North America School Bus Industry Revenue Million Forecast, by Bus Type 2020 & 2033
- Table 15: North America School Bus Industry Revenue Million Forecast, by Geography 2020 & 2033
- Table 16: North America School Bus Industry Revenue Million Forecast, by Country 2020 & 2033
Frequently Asked Questions
1. What is the projected Compound Annual Growth Rate (CAGR) of the North America School Bus Industry?
The projected CAGR is approximately > 4.74%.
2. Which companies are prominent players in the North America School Bus Industry?
Key companies in the market include Navistar Inc, Lion Electric Compan, Blue Bird Corporation, Girardin Blue Bird, Starcraft Bus, Trans Tech, Collins Bus Corporation, Daimler AG (Thomas Built Buses).
3. What are the main segments of the North America School Bus Industry?
The market segments include Powertrain, Bus Type, Geography.
4. Can you provide details about the market size?
The market size is estimated to be USD 2.41 Million as of 2022.
5. What are some drivers contributing to market growth?
Increasing Demand For Electric School Buses.
6. What are the notable trends driving market growth?
The Industry’s Shift Toward the Adoption of Electric School Buses.
7. Are there any restraints impacting market growth?
Uncertainty of The Global Pandemic.
8. Can you provide examples of recent developments in the market?
October 2023: Blue Bird achieved a milestone by delivering its 1,500th electric, zero-emission school bus to Modesto City Schools in California. Recently, the company marked the inauguration of its Electric Vehicle (EV) Build-up Center in Georgia, aiming to boost its long-term production capacity to 5,000 electric school buses annually. This expansion underscores Blue Bird's commitment to advancing zero-emission school buses.
9. What pricing options are available for accessing the report?
Pricing options include single-user, multi-user, and enterprise licenses priced at USD 4750, USD 5250, and USD 8750 respectively.
10. Is the market size provided in terms of value or volume?
The market size is provided in terms of value, measured in Million.
11. Are there any specific market keywords associated with the report?
Yes, the market keyword associated with the report is "North America School Bus Industry," which aids in identifying and referencing the specific market segment covered.
12. How do I determine which pricing option suits my needs best?
The pricing options vary based on user requirements and access needs. Individual users may opt for single-user licenses, while businesses requiring broader access may choose multi-user or enterprise licenses for cost-effective access to the report.
13. Are there any additional resources or data provided in the North America School Bus Industry report?
While the report offers comprehensive insights, it's advisable to review the specific contents or supplementary materials provided to ascertain if additional resources or data are available.
14. How can I stay updated on further developments or reports in the North America School Bus Industry?
To stay informed about further developments, trends, and reports in the North America School Bus Industry, consider subscribing to industry newsletters, following relevant companies and organizations, or regularly checking reputable industry news sources and publications.
Methodology
Step 1 - Identification of Relevant Samples Size from Population Database


Step 2 - Approaches for Defining Global Market Size (Value, Volume* & Price*)

Note*: In applicable scenarios
Step 3 - Data Sources
Primary Research
- Web Analytics
- Survey Reports
- Research Institute
- Latest Research Reports
- Opinion Leaders
Secondary Research
- Annual Reports
- White Paper
- Latest Press Release
- Industry Association
- Paid Database
- Investor Presentations

Step 4 - Data Triangulation
Involves using different sources of information in order to increase the validity of a study
These sources are likely to be stakeholders in a program - participants, other researchers, program staff, other community members, and so on.
Then we put all data in single framework & apply various statistical tools to find out the dynamic on the market.
During the analysis stage, feedback from the stakeholder groups would be compared to determine areas of agreement as well as areas of divergence