

Key Insights
The Nordic bike-sharing market is poised for significant expansion, driven by increasing environmental consciousness, urban congestion mitigation, and government initiatives promoting sustainable urban mobility. Projections indicate a Compound Annual Growth Rate (CAGR) of 7.8%, leading to a projected market size of 280 million by the base year 2024. The integration of e-bikes is a key trend, enhancing user accessibility and broadening the market's appeal. Both dockless and docked systems are witnessing adoption, catering to diverse user preferences and urban environments. Competitive dynamics among key providers are fostering innovation and improving cost-effectiveness. While initial infrastructure investment presents a challenge, sustained government support and market growth are expected to offset this. Sweden, Norway, and Denmark currently lead the market, with Finland and other Nordic nations exhibiting substantial growth potential. The market's segmentation by bike type, sharing system, and geography allows for strategic penetration.
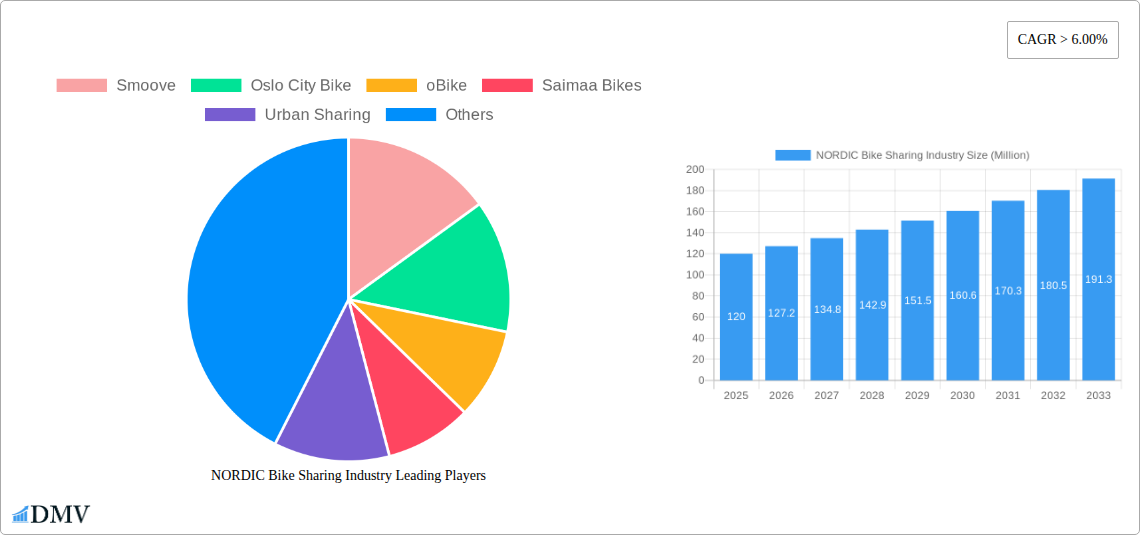
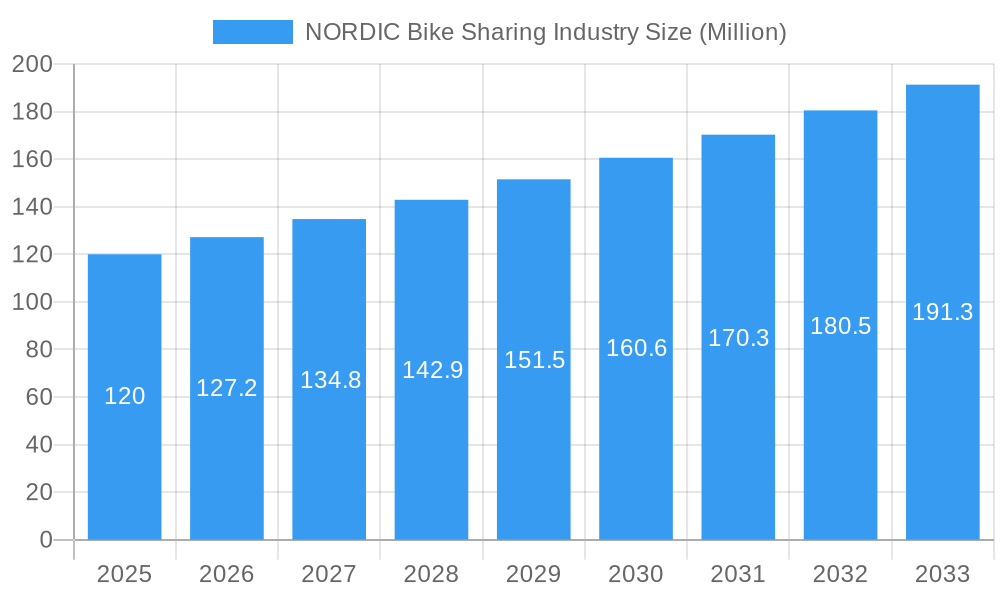
NORDIC Bike Sharing Industry Market Size (In Million)
The Nordic region's commitment to sustainability underscores the robust growth trajectory of its bike-sharing sector. The total Nordic bike-sharing market value is estimated at 280 million in 2024, with strong growth anticipated through 2033. Future expansion will be contingent upon technological integration, infrastructure investment, and usage incentive programs. The market's competitive landscape is dynamic, offering opportunities for both established players and new entrants. Long-term success will depend on adaptability to evolving consumer demands and technological advancements, alongside efficient cost management. Expansion into under-penetrated segments and regions presents considerable growth opportunities.
NORDIC Bike Sharing Industry Company Market Share
NORDIC Bike Sharing Industry Market Report: 2019-2033
This comprehensive report provides a detailed analysis of the Nordic bike sharing industry, offering invaluable insights for stakeholders seeking to understand market dynamics, growth trajectories, and future opportunities. Covering the period from 2019 to 2033, with a base year of 2025, this report leverages extensive data analysis to forecast market trends and identify key players. The study encompasses Sweden, Norway, Finland, Denmark, and the rest of the Nordic region, examining various segments including bike types (traditional/regular bikes and e-bikes) and sharing system types (docked and dockless). The total market value is predicted to reach XX Million by 2033.
NORDIC Bike Sharing Industry Market Composition & Trends
This section analyzes the competitive landscape of the Nordic bike-sharing market, encompassing market concentration, innovation drivers, regulatory frameworks, substitute products, user profiles, and mergers & acquisitions (M&A) activities. The report details market share distribution among key players, including Smoove, Oslo City Bike, oBike, Saimaa Bikes, Urban Sharing, Rekola, Malmö By Bike, Helsinki City Bikes, and Bycyklen. We delve into the impact of regulatory changes on market growth, exploring the influence of factors like government subsidies and infrastructure development. Furthermore, the report assesses the prevalence of substitute modes of transportation and their impact on market share. The analysis incorporates data on M&A activity within the sector, including the value of completed deals and their influence on market consolidation. The estimated market size in 2025 is XX Million, with a projected growth rate of XX% from 2025 to 2033.
- Market Concentration: High fragmentation with several smaller players and a few larger regional operators. XX% market share held by the top 3 players in 2025.
- Innovation Catalysts: Increased demand for sustainable transportation, technological advancements in e-bike technology, and government incentives for green initiatives.
- Regulatory Landscape: Varying regulations across Nordic countries concerning licensing, safety standards, and infrastructure provision.
- Substitute Products: Public transportation, private vehicles, and walking. The report quantifies the competitive pressure from each.
- End-User Profiles: Analysis of demographics, usage patterns, and preferences across different user segments.
- M&A Activity: Detailed analysis of historical M&A activity, with deal values and strategic implications discussed. Total M&A deal value in 2019-2024 estimated at XX Million.
NORDIC Bike Sharing Industry Industry Evolution
This section provides a detailed account of the Nordic bike-sharing industry's historical evolution and future projections. The analysis traces the market's growth trajectory from 2019 to 2024, examining key milestones, technological advancements, and shifts in consumer demand. We highlight the growing adoption of e-bikes, the expansion of dockless systems, and the impact of technological advancements on user experience and operational efficiency. Growth rates are presented for each segment and the impact of the pandemic on the industry is analyzed.
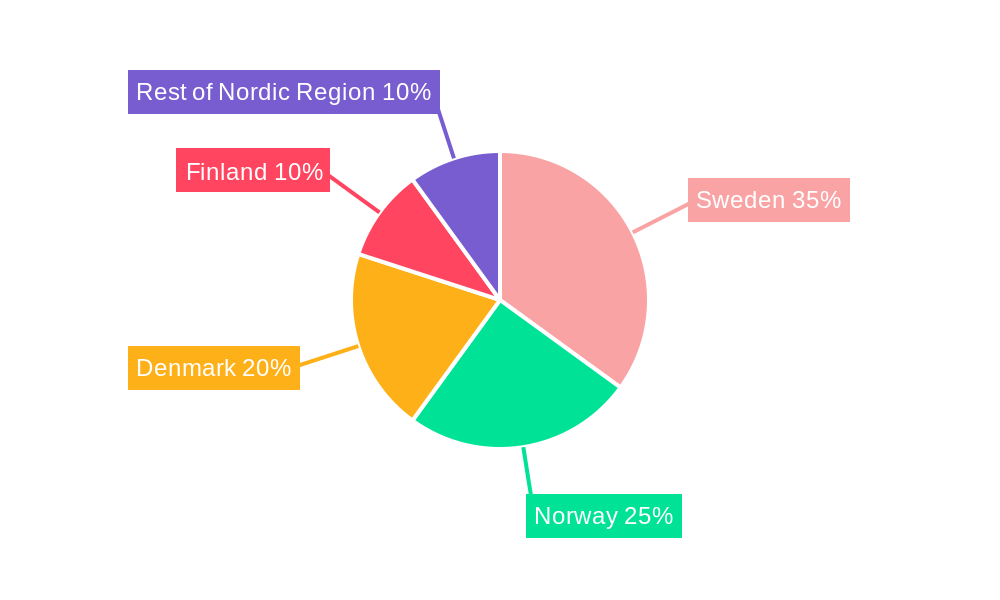
Leading Regions, Countries, or Segments in NORDIC Bike Sharing Industry
This section identifies the leading regions, countries, and segments within the Nordic bike-sharing market. Data is presented on market share by bike type (traditional/e-bike), sharing system type (docked/dockless), and country. The reasons behind the dominance of specific regions or segments are explored through detailed analysis.
- By Bike Type:
- E-bikes: High growth due to increased range, convenience, and government incentives.
- Traditional Bikes: Maintains a significant market share due to affordability and simplicity.
- By Sharing System Type:
- Dockless: Expanding rapidly due to convenience and flexibility, but facing challenges related to bike management and vandalism.
- Docked: Strong presence in urban areas with established infrastructure.
- By Country:
- [Leading Country]: Higher adoption rates driven by [specific reasons, e.g., strong government support, cycling infrastructure, and favourable demographics]. Detailed analysis is provided, including investment trends and regulatory support. Other countries are analyzed in terms of factors impacting growth.
- [Other countries]: Comparative analysis focusing on factors driving adoption and market differences.
NORDIC Bike Sharing Industry Product Innovations
This section examines recent product innovations, applications, and performance metrics within the Nordic bike-sharing industry. We analyze the technological advancements impacting the sector, including improvements in bike durability, battery technology, GPS tracking, and mobile app functionalities. Specific examples of unique selling propositions offered by various providers are highlighted. The focus is on how innovation enhances user experience, operational efficiency, and sustainability.
Propelling Factors for NORDIC Bike Sharing Industry Growth
Several factors are driving the growth of the Nordic bike-sharing industry. These include increasing environmental awareness, governmental support through subsidies and infrastructure development, technological advancements leading to improved bike designs and user experience, and the rising popularity of micro-mobility solutions in urban areas. The expansion of bike sharing into smaller towns and cities also contributes significantly.
Obstacles in the NORDIC Bike Sharing Industry Market
Despite the growth potential, the Nordic bike-sharing industry faces several challenges. These include varying regulatory landscapes across different Nordic countries, issues related to bike theft and vandalism (particularly in dockless systems), and intense competition among various operators. Seasonal variations in weather conditions also affect usage rates.
Future Opportunities in NORDIC Bike Sharing Industry
Future opportunities in the Nordic bike sharing industry include the expansion into underserved markets, integration with public transport systems, the growth of e-bike and cargo bike sharing, and the development of innovative business models like subscription services and corporate partnerships. Advances in technology are expected to enhance bike durability, security, and user experience.
Major Players in the NORDIC Bike Sharing Industry Ecosystem
- Smoove
- Oslo City Bike
- oBike
- Saimaa Bikes
- Urban Sharing
- Rekola
- Malmö By Bike
- Helsinki City bikes
- Bycyklen
Key Developments in NORDIC Bike Sharing Industry Industry
- [Month, Year]: [Specific development and its impact on the market, e.g., launch of a new e-bike model by a major player].
- [Month, Year]: [Specific development and its impact on the market].
- [Month, Year]: [Specific development and its impact on the market].
- [Month, Year]: [Specific development and its impact on the market].
Strategic NORDIC Bike Sharing Industry Market Forecast
The Nordic bike-sharing market is poised for continued growth over the forecast period (2025-2033). Key growth catalysts include increasing urbanization, heightened environmental concerns, and continued technological advancements in e-bike technology and sharing systems. The market is expected to see further consolidation through mergers and acquisitions, as well as the emergence of innovative business models. The focus will be on enhancing user experience, improving operational efficiency, and promoting sustainable transportation solutions.
NORDIC Bike Sharing Industry Segmentation
-
1. Bike Type
- 1.1. Traditional/Regular Bike
- 1.2. E-bike
-
2. Sharing System Type
- 2.1. Docked
- 2.2. Dockless
NORDIC Bike Sharing Industry Segmentation By Geography
-
1. North America
- 1.1. United States
- 1.2. Canada
- 1.3. Mexico
-
2. South America
- 2.1. Brazil
- 2.2. Argentina
- 2.3. Rest of South America
-
3. Europe
- 3.1. United Kingdom
- 3.2. Germany
- 3.3. France
- 3.4. Italy
- 3.5. Spain
- 3.6. Russia
- 3.7. Benelux
- 3.8. Nordics
- 3.9. Rest of Europe
-
4. Middle East & Africa
- 4.1. Turkey
- 4.2. Israel
- 4.3. GCC
- 4.4. North Africa
- 4.5. South Africa
- 4.6. Rest of Middle East & Africa
-
5. Asia Pacific
- 5.1. China
- 5.2. India
- 5.3. Japan
- 5.4. South Korea
- 5.5. ASEAN
- 5.6. Oceania
- 5.7. Rest of Asia Pacific
NORDIC Bike Sharing Industry Regional Market Share
Geographic Coverage of NORDIC Bike Sharing Industry
NORDIC Bike Sharing Industry REPORT HIGHLIGHTS
| Aspects | Details |
|---|---|
| Study Period | 2020-2034 |
| Base Year | 2025 |
| Estimated Year | 2026 |
| Forecast Period | 2026-2034 |
| Historical Period | 2020-2025 |
| Growth Rate | CAGR of 7.8% from 2020-2034 |
| Segmentation |
|
Table of Contents
- 1. Introduction
- 1.1. Research Scope
- 1.2. Market Segmentation
- 1.3. Research Objective
- 1.4. Definitions and Assumptions
- 2. Executive Summary
- 2.1. Market Snapshot
- 3. Market Dynamics
- 3.1. Market Drivers
- 3.2. Market Restrains
- 3.3. Market Trends
- 3.4. Market Opportunities
- 4. Market Factor Analysis
- 4.1. Porters Five Forces
- 4.1.1. Bargaining Power of Suppliers
- 4.1.2. Bargaining Power of Buyers
- 4.1.3. Threat of New Entrants
- 4.1.4. Threat of Substitutes
- 4.1.5. Competitive Rivalry
- 4.2. PESTEL analysis
- 4.3. BCG Analysis
- 4.3.1. Stars (High Growth, High Market Share)
- 4.3.2. Cash Cows (Low Growth, High Market Share)
- 4.3.3. Question Mark (High Growth, Low Market Share)
- 4.3.4. Dogs (Low Growth, Low Market Share)
- 4.4. Ansoff Matrix Analysis
- 4.5. Supply Chain Analysis
- 4.6. Regulatory Landscape
- 4.7. Current Market Potential and Opportunity Assessment (TAM–SAM–SOM Framework)
- 4.8. DMV Analyst Note
- 4.1. Porters Five Forces
- 5. Market Analysis, Insights and Forecast 2021-2033
- 5.1. Market Analysis, Insights and Forecast - by Bike Type
- 5.1.1. Traditional/Regular Bike
- 5.1.2. E-bike
- 5.2. Market Analysis, Insights and Forecast - by Sharing System Type
- 5.2.1. Docked
- 5.2.2. Dockless
- 5.3. Market Analysis, Insights and Forecast - by Region
- 5.3.1. North America
- 5.3.2. South America
- 5.3.3. Europe
- 5.3.4. Middle East & Africa
- 5.3.5. Asia Pacific
- 5.1. Market Analysis, Insights and Forecast - by Bike Type
- 6. Global NORDIC Bike Sharing Industry Analysis, Insights and Forecast, 2021-2033
- 6.1. Market Analysis, Insights and Forecast - by Bike Type
- 6.1.1. Traditional/Regular Bike
- 6.1.2. E-bike
- 6.2. Market Analysis, Insights and Forecast - by Sharing System Type
- 6.2.1. Docked
- 6.2.2. Dockless
- 6.1. Market Analysis, Insights and Forecast - by Bike Type
- 7. North America NORDIC Bike Sharing Industry Analysis, Insights and Forecast, 2020-2032
- 7.1. Market Analysis, Insights and Forecast - by Bike Type
- 7.1.1. Traditional/Regular Bike
- 7.1.2. E-bike
- 7.2. Market Analysis, Insights and Forecast - by Sharing System Type
- 7.2.1. Docked
- 7.2.2. Dockless
- 7.1. Market Analysis, Insights and Forecast - by Bike Type
- 8. South America NORDIC Bike Sharing Industry Analysis, Insights and Forecast, 2020-2032
- 8.1. Market Analysis, Insights and Forecast - by Bike Type
- 8.1.1. Traditional/Regular Bike
- 8.1.2. E-bike
- 8.2. Market Analysis, Insights and Forecast - by Sharing System Type
- 8.2.1. Docked
- 8.2.2. Dockless
- 8.1. Market Analysis, Insights and Forecast - by Bike Type
- 9. Europe NORDIC Bike Sharing Industry Analysis, Insights and Forecast, 2020-2032
- 9.1. Market Analysis, Insights and Forecast - by Bike Type
- 9.1.1. Traditional/Regular Bike
- 9.1.2. E-bike
- 9.2. Market Analysis, Insights and Forecast - by Sharing System Type
- 9.2.1. Docked
- 9.2.2. Dockless
- 9.1. Market Analysis, Insights and Forecast - by Bike Type
- 10. Middle East & Africa NORDIC Bike Sharing Industry Analysis, Insights and Forecast, 2020-2032
- 10.1. Market Analysis, Insights and Forecast - by Bike Type
- 10.1.1. Traditional/Regular Bike
- 10.1.2. E-bike
- 10.2. Market Analysis, Insights and Forecast - by Sharing System Type
- 10.2.1. Docked
- 10.2.2. Dockless
- 10.1. Market Analysis, Insights and Forecast - by Bike Type
- 11. Asia Pacific NORDIC Bike Sharing Industry Analysis, Insights and Forecast, 2020-2032
- 11.1. Market Analysis, Insights and Forecast - by Bike Type
- 11.1.1. Traditional/Regular Bike
- 11.1.2. E-bike
- 11.2. Market Analysis, Insights and Forecast - by Sharing System Type
- 11.2.1. Docked
- 11.2.2. Dockless
- 11.1. Market Analysis, Insights and Forecast - by Bike Type
- 12. Competitive Analysis
- 12.1. Company Profiles
- 12.1.1 Smoove
- 12.1.1.1. Company Overview
- 12.1.1.2. Products
- 12.1.1.3. Company Financials
- 12.1.1.4. SWOT Analysis
- 12.1.2 Oslo City Bike
- 12.1.2.1. Company Overview
- 12.1.2.2. Products
- 12.1.2.3. Company Financials
- 12.1.2.4. SWOT Analysis
- 12.1.3 oBike
- 12.1.3.1. Company Overview
- 12.1.3.2. Products
- 12.1.3.3. Company Financials
- 12.1.3.4. SWOT Analysis
- 12.1.4 Saimaa Bikes
- 12.1.4.1. Company Overview
- 12.1.4.2. Products
- 12.1.4.3. Company Financials
- 12.1.4.4. SWOT Analysis
- 12.1.5 Urban Sharing
- 12.1.5.1. Company Overview
- 12.1.5.2. Products
- 12.1.5.3. Company Financials
- 12.1.5.4. SWOT Analysis
- 12.1.6 Rekola
- 12.1.6.1. Company Overview
- 12.1.6.2. Products
- 12.1.6.3. Company Financials
- 12.1.6.4. SWOT Analysis
- 12.1.7 Malmo By Bike
- 12.1.7.1. Company Overview
- 12.1.7.2. Products
- 12.1.7.3. Company Financials
- 12.1.7.4. SWOT Analysis
- 12.1.8 Helsinki City bikes
- 12.1.8.1. Company Overview
- 12.1.8.2. Products
- 12.1.8.3. Company Financials
- 12.1.8.4. SWOT Analysis
- 12.1.9 Bycyklen*List Not Exhaustive
- 12.1.9.1. Company Overview
- 12.1.9.2. Products
- 12.1.9.3. Company Financials
- 12.1.9.4. SWOT Analysis
- 12.1.1 Smoove
- 12.2. Market Entropy
- 12.2.1 Company's Key Areas Served
- 12.2.2 Recent Developments
- 12.3. Company Market Share Analysis 2025
- 12.3.1 Top 5 Companies Market Share Analysis
- 12.3.2 Top 3 Companies Market Share Analysis
- 12.4. List of Potential Customers
- 13. Research Methodology
List of Figures
- Figure 1: Global NORDIC Bike Sharing Industry Revenue Breakdown (million, %) by Region 2025 & 2033
- Figure 2: North America NORDIC Bike Sharing Industry Revenue (million), by Bike Type 2025 & 2033
- Figure 3: North America NORDIC Bike Sharing Industry Revenue Share (%), by Bike Type 2025 & 2033
- Figure 4: North America NORDIC Bike Sharing Industry Revenue (million), by Sharing System Type 2025 & 2033
- Figure 5: North America NORDIC Bike Sharing Industry Revenue Share (%), by Sharing System Type 2025 & 2033
- Figure 6: North America NORDIC Bike Sharing Industry Revenue (million), by Country 2025 & 2033
- Figure 7: North America NORDIC Bike Sharing Industry Revenue Share (%), by Country 2025 & 2033
- Figure 8: South America NORDIC Bike Sharing Industry Revenue (million), by Bike Type 2025 & 2033
- Figure 9: South America NORDIC Bike Sharing Industry Revenue Share (%), by Bike Type 2025 & 2033
- Figure 10: South America NORDIC Bike Sharing Industry Revenue (million), by Sharing System Type 2025 & 2033
- Figure 11: South America NORDIC Bike Sharing Industry Revenue Share (%), by Sharing System Type 2025 & 2033
- Figure 12: South America NORDIC Bike Sharing Industry Revenue (million), by Country 2025 & 2033
- Figure 13: South America NORDIC Bike Sharing Industry Revenue Share (%), by Country 2025 & 2033
- Figure 14: Europe NORDIC Bike Sharing Industry Revenue (million), by Bike Type 2025 & 2033
- Figure 15: Europe NORDIC Bike Sharing Industry Revenue Share (%), by Bike Type 2025 & 2033
- Figure 16: Europe NORDIC Bike Sharing Industry Revenue (million), by Sharing System Type 2025 & 2033
- Figure 17: Europe NORDIC Bike Sharing Industry Revenue Share (%), by Sharing System Type 2025 & 2033
- Figure 18: Europe NORDIC Bike Sharing Industry Revenue (million), by Country 2025 & 2033
- Figure 19: Europe NORDIC Bike Sharing Industry Revenue Share (%), by Country 2025 & 2033
- Figure 20: Middle East & Africa NORDIC Bike Sharing Industry Revenue (million), by Bike Type 2025 & 2033
- Figure 21: Middle East & Africa NORDIC Bike Sharing Industry Revenue Share (%), by Bike Type 2025 & 2033
- Figure 22: Middle East & Africa NORDIC Bike Sharing Industry Revenue (million), by Sharing System Type 2025 & 2033
- Figure 23: Middle East & Africa NORDIC Bike Sharing Industry Revenue Share (%), by Sharing System Type 2025 & 2033
- Figure 24: Middle East & Africa NORDIC Bike Sharing Industry Revenue (million), by Country 2025 & 2033
- Figure 25: Middle East & Africa NORDIC Bike Sharing Industry Revenue Share (%), by Country 2025 & 2033
- Figure 26: Asia Pacific NORDIC Bike Sharing Industry Revenue (million), by Bike Type 2025 & 2033
- Figure 27: Asia Pacific NORDIC Bike Sharing Industry Revenue Share (%), by Bike Type 2025 & 2033
- Figure 28: Asia Pacific NORDIC Bike Sharing Industry Revenue (million), by Sharing System Type 2025 & 2033
- Figure 29: Asia Pacific NORDIC Bike Sharing Industry Revenue Share (%), by Sharing System Type 2025 & 2033
- Figure 30: Asia Pacific NORDIC Bike Sharing Industry Revenue (million), by Country 2025 & 2033
- Figure 31: Asia Pacific NORDIC Bike Sharing Industry Revenue Share (%), by Country 2025 & 2033
List of Tables
- Table 1: Global NORDIC Bike Sharing Industry Revenue million Forecast, by Bike Type 2020 & 2033
- Table 2: Global NORDIC Bike Sharing Industry Revenue million Forecast, by Sharing System Type 2020 & 2033
- Table 3: Global NORDIC Bike Sharing Industry Revenue million Forecast, by Region 2020 & 2033
- Table 4: Global NORDIC Bike Sharing Industry Revenue million Forecast, by Bike Type 2020 & 2033
- Table 5: Global NORDIC Bike Sharing Industry Revenue million Forecast, by Sharing System Type 2020 & 2033
- Table 6: Global NORDIC Bike Sharing Industry Revenue million Forecast, by Country 2020 & 2033
- Table 7: United States NORDIC Bike Sharing Industry Revenue (million) Forecast, by Application 2020 & 2033
- Table 8: Canada NORDIC Bike Sharing Industry Revenue (million) Forecast, by Application 2020 & 2033
- Table 9: Mexico NORDIC Bike Sharing Industry Revenue (million) Forecast, by Application 2020 & 2033
- Table 10: Global NORDIC Bike Sharing Industry Revenue million Forecast, by Bike Type 2020 & 2033
- Table 11: Global NORDIC Bike Sharing Industry Revenue million Forecast, by Sharing System Type 2020 & 2033
- Table 12: Global NORDIC Bike Sharing Industry Revenue million Forecast, by Country 2020 & 2033
- Table 13: Brazil NORDIC Bike Sharing Industry Revenue (million) Forecast, by Application 2020 & 2033
- Table 14: Argentina NORDIC Bike Sharing Industry Revenue (million) Forecast, by Application 2020 & 2033
- Table 15: Rest of South America NORDIC Bike Sharing Industry Revenue (million) Forecast, by Application 2020 & 2033
- Table 16: Global NORDIC Bike Sharing Industry Revenue million Forecast, by Bike Type 2020 & 2033
- Table 17: Global NORDIC Bike Sharing Industry Revenue million Forecast, by Sharing System Type 2020 & 2033
- Table 18: Global NORDIC Bike Sharing Industry Revenue million Forecast, by Country 2020 & 2033
- Table 19: United Kingdom NORDIC Bike Sharing Industry Revenue (million) Forecast, by Application 2020 & 2033
- Table 20: Germany NORDIC Bike Sharing Industry Revenue (million) Forecast, by Application 2020 & 2033
- Table 21: France NORDIC Bike Sharing Industry Revenue (million) Forecast, by Application 2020 & 2033
- Table 22: Italy NORDIC Bike Sharing Industry Revenue (million) Forecast, by Application 2020 & 2033
- Table 23: Spain NORDIC Bike Sharing Industry Revenue (million) Forecast, by Application 2020 & 2033
- Table 24: Russia NORDIC Bike Sharing Industry Revenue (million) Forecast, by Application 2020 & 2033
- Table 25: Benelux NORDIC Bike Sharing Industry Revenue (million) Forecast, by Application 2020 & 2033
- Table 26: Nordics NORDIC Bike Sharing Industry Revenue (million) Forecast, by Application 2020 & 2033
- Table 27: Rest of Europe NORDIC Bike Sharing Industry Revenue (million) Forecast, by Application 2020 & 2033
- Table 28: Global NORDIC Bike Sharing Industry Revenue million Forecast, by Bike Type 2020 & 2033
- Table 29: Global NORDIC Bike Sharing Industry Revenue million Forecast, by Sharing System Type 2020 & 2033
- Table 30: Global NORDIC Bike Sharing Industry Revenue million Forecast, by Country 2020 & 2033
- Table 31: Turkey NORDIC Bike Sharing Industry Revenue (million) Forecast, by Application 2020 & 2033
- Table 32: Israel NORDIC Bike Sharing Industry Revenue (million) Forecast, by Application 2020 & 2033
- Table 33: GCC NORDIC Bike Sharing Industry Revenue (million) Forecast, by Application 2020 & 2033
- Table 34: North Africa NORDIC Bike Sharing Industry Revenue (million) Forecast, by Application 2020 & 2033
- Table 35: South Africa NORDIC Bike Sharing Industry Revenue (million) Forecast, by Application 2020 & 2033
- Table 36: Rest of Middle East & Africa NORDIC Bike Sharing Industry Revenue (million) Forecast, by Application 2020 & 2033
- Table 37: Global NORDIC Bike Sharing Industry Revenue million Forecast, by Bike Type 2020 & 2033
- Table 38: Global NORDIC Bike Sharing Industry Revenue million Forecast, by Sharing System Type 2020 & 2033
- Table 39: Global NORDIC Bike Sharing Industry Revenue million Forecast, by Country 2020 & 2033
- Table 40: China NORDIC Bike Sharing Industry Revenue (million) Forecast, by Application 2020 & 2033
- Table 41: India NORDIC Bike Sharing Industry Revenue (million) Forecast, by Application 2020 & 2033
- Table 42: Japan NORDIC Bike Sharing Industry Revenue (million) Forecast, by Application 2020 & 2033
- Table 43: South Korea NORDIC Bike Sharing Industry Revenue (million) Forecast, by Application 2020 & 2033
- Table 44: ASEAN NORDIC Bike Sharing Industry Revenue (million) Forecast, by Application 2020 & 2033
- Table 45: Oceania NORDIC Bike Sharing Industry Revenue (million) Forecast, by Application 2020 & 2033
- Table 46: Rest of Asia Pacific NORDIC Bike Sharing Industry Revenue (million) Forecast, by Application 2020 & 2033
Frequently Asked Questions
1. What is the projected Compound Annual Growth Rate (CAGR) of the NORDIC Bike Sharing Industry?
The projected CAGR is approximately 7.8%.
2. Which companies are prominent players in the NORDIC Bike Sharing Industry?
Key companies in the market include Smoove, Oslo City Bike, oBike, Saimaa Bikes, Urban Sharing, Rekola, Malmo By Bike, Helsinki City bikes, Bycyklen*List Not Exhaustive.
3. What are the main segments of the NORDIC Bike Sharing Industry?
The market segments include Bike Type, Sharing System Type.
4. Can you provide details about the market size?
The market size is estimated to be USD 280 million as of 2022.
5. What are some drivers contributing to market growth?
Government Policies to promote electric Vehicles Sales.
6. What are the notable trends driving market growth?
E-Bike Rentalis Providing the Growth in Market.
7. Are there any restraints impacting market growth?
High Cost of Capital Expenditure for Electric Vehicle Infrastructure.
8. Can you provide examples of recent developments in the market?
N/A
9. What pricing options are available for accessing the report?
Pricing options include single-user, multi-user, and enterprise licenses priced at USD 3800, USD 4500, and USD 5800 respectively.
10. Is the market size provided in terms of value or volume?
The market size is provided in terms of value, measured in million.
11. Are there any specific market keywords associated with the report?
Yes, the market keyword associated with the report is "NORDIC Bike Sharing Industry," which aids in identifying and referencing the specific market segment covered.
12. How do I determine which pricing option suits my needs best?
The pricing options vary based on user requirements and access needs. Individual users may opt for single-user licenses, while businesses requiring broader access may choose multi-user or enterprise licenses for cost-effective access to the report.
13. Are there any additional resources or data provided in the NORDIC Bike Sharing Industry report?
While the report offers comprehensive insights, it's advisable to review the specific contents or supplementary materials provided to ascertain if additional resources or data are available.
14. How can I stay updated on further developments or reports in the NORDIC Bike Sharing Industry?
To stay informed about further developments, trends, and reports in the NORDIC Bike Sharing Industry, consider subscribing to industry newsletters, following relevant companies and organizations, or regularly checking reputable industry news sources and publications.
Methodology
Step 1 - Identification of Relevant Samples Size from Population Database


Step 2 - Approaches for Defining Global Market Size (Value, Volume* & Price*)

Note*: In applicable scenarios
Step 3 - Data Sources
Primary Research
- Web Analytics
- Survey Reports
- Research Institute
- Latest Research Reports
- Opinion Leaders
Secondary Research
- Annual Reports
- White Paper
- Latest Press Release
- Industry Association
- Paid Database
- Investor Presentations

Step 4 - Data Triangulation
Involves using different sources of information in order to increase the validity of a study
These sources are likely to be stakeholders in a program - participants, other researchers, program staff, other community members, and so on.
Then we put all data in single framework & apply various statistical tools to find out the dynamic on the market.
During the analysis stage, feedback from the stakeholder groups would be compared to determine areas of agreement as well as areas of divergence