

Key Insights
The marine battery market is poised for substantial expansion, driven by the increasing demand for sustainable and efficient maritime power solutions. The market is projected to grow at a Compound Annual Growth Rate (CAGR) of 17.89%. This robust growth is attributed to several key factors. Firstly, stringent global emission regulations are compelling shipowners to adopt cleaner energy alternatives, with marine batteries emerging as a prime choice for smaller vessels and hybrid systems over traditional diesel engines. Secondly, significant advancements in battery technology, particularly lithium-ion batteries, are enhancing energy density, extending lifespan, and reducing the total cost of ownership, thereby accelerating adoption across both commercial and defense sectors. While lead-acid batteries maintain a considerable market share due to their established cost-effectiveness, the industry is witnessing a notable shift towards high-performance lithium-ion technologies. Emerging fuel cell technologies also represent a growing segment. Regionally, North America and Europe are expected to lead market expansion, supported by early adoption of environmental regulations and substantial investments in green shipping. The Asia-Pacific region, especially China and India, is anticipated to experience rapid growth, fueled by expanding maritime activities and increasing government support for clean energy initiatives.
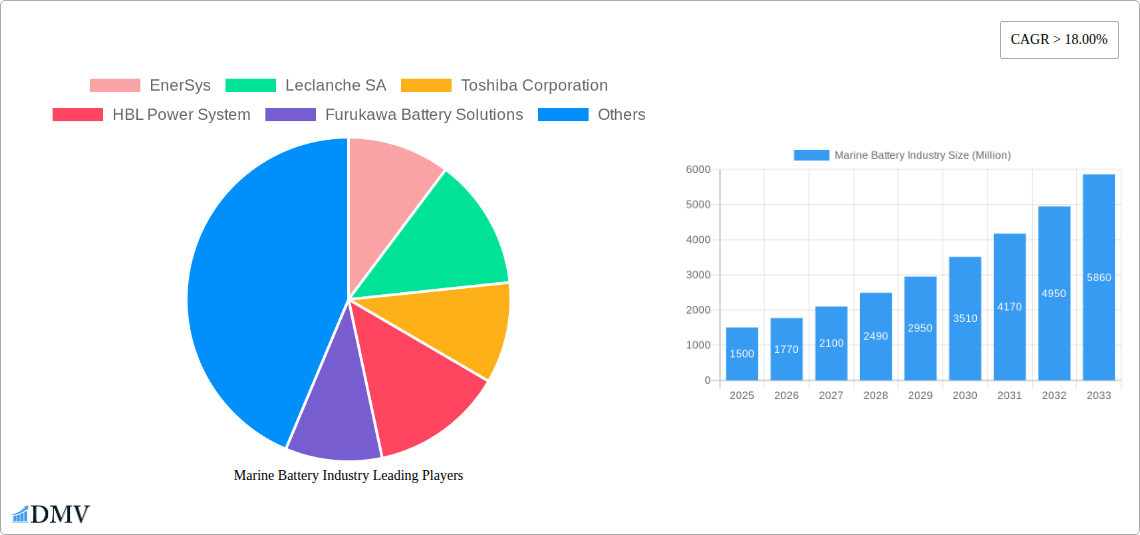
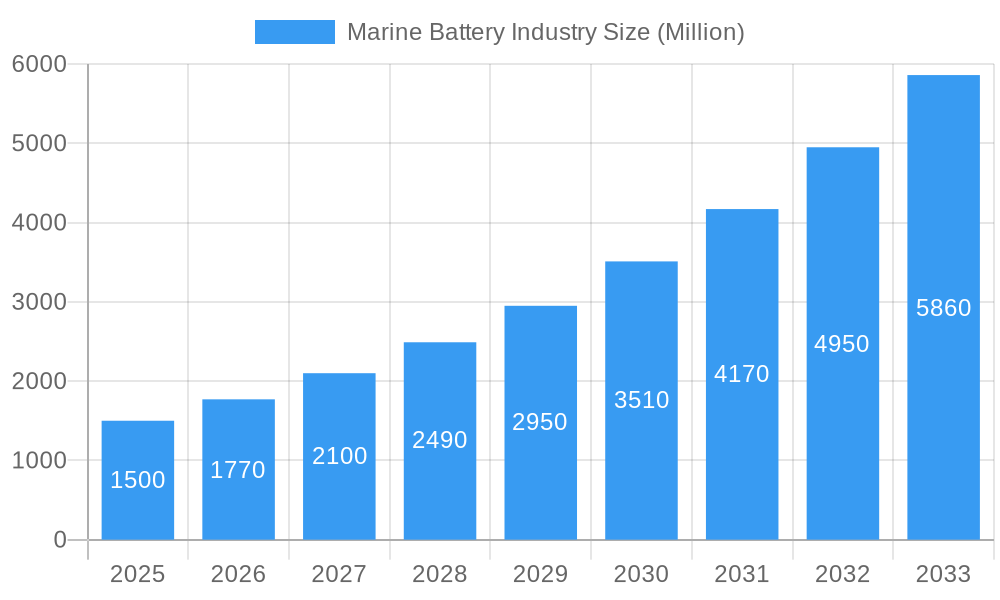
Marine Battery Industry Market Size (In Billion)
Key factors influencing market dynamics include a projected market size of 1.54 billion by 2025. While high initial investment costs for advanced battery technologies can present a barrier, ongoing technological innovation and supportive government policies are expected to mitigate these challenges. Addressing the lifecycle management and disposal of spent batteries is crucial for ensuring sustainable growth. Furthermore, technological advancements and evolving regulatory landscapes are expected to overcome limitations in battery lifespan compared to traditional engines, making them increasingly cost-effective over the long term. The market is segmented by battery type, including lithium-ion, nickel-cadmium, fuel cell, and lead-acid, and by ship type, encompassing commercial and defense vessels, enabling targeted strategic planning. Leading industry players such as EnerSys, Leclanche SA, and Toshiba Corporation are actively driving market innovation and strategic collaborations.
Marine Battery Industry Company Market Share
Marine Battery Industry Market Report: 2019-2033
This comprehensive report provides an in-depth analysis of the marine battery industry, encompassing market size, trends, leading players, and future projections from 2019 to 2033. With a focus on key segments including Lithium-ion, Nickel-Cadmium, Fuel Cell, and Lead Acid batteries, across Commercial and Defense ship types, this report offers invaluable insights for stakeholders seeking to navigate this rapidly evolving sector. The report uses 2025 as the base and estimated year, with a forecast period spanning 2025-2033 and historical data covering 2019-2024. The market value is estimated at xx Million in 2025, projected to reach xx Million by 2033.
Marine Battery Industry Market Composition & Trends
The marine battery market is experiencing significant transformation driven by the increasing adoption of electric and hybrid propulsion systems. Market concentration is moderate, with key players like EnerSys, Leclanche SA, Toshiba Corporation, and others vying for market share. The estimated market share distribution in 2025 is as follows: EnerSys (15%), Leclanche SA (10%), Toshiba Corporation (8%), Others (67%). Innovation is fueled by the demand for higher energy density, longer lifespan, and improved safety features in marine batteries. Stringent environmental regulations are pushing the adoption of cleaner energy solutions, while the availability of substitute products like fuel cells presents both challenges and opportunities. The end-user profile is diversifying, with growing participation from both commercial and defense sectors. M&A activity, while not exceptionally high, is expected to increase as companies consolidate their market positions. The total M&A deal value from 2019 to 2024 was estimated at xx Million, indicating a gradual consolidation trend.
- Market Concentration: Moderate, with a few dominant players.
- Innovation Catalysts: Demand for higher energy density, longer lifespan, and enhanced safety.
- Regulatory Landscape: Stringent environmental regulations driving cleaner energy adoption.
- Substitute Products: Fuel cells and other alternative energy sources pose both threats and opportunities.
- End-User Profile: Expanding to include both commercial and defense sectors.
- M&A Activities: Gradual increase in mergers and acquisitions to consolidate market share.
Marine Battery Industry Industry Evolution
The marine battery industry has witnessed remarkable growth, particularly in the adoption of lithium-ion batteries due to their higher energy density compared to traditional lead-acid batteries. This transition is driven by a convergence of factors including stringent environmental regulations aimed at reducing greenhouse gas emissions from shipping, increasing demand for cleaner energy solutions from environmentally conscious consumers and governments, and continuous technological advancements leading to improved performance and reduced costs of lithium-ion battery systems. Between 2019 and 2024, the market experienced a Compound Annual Growth Rate (CAGR) of approximately xx%. This growth is further propelled by the expanding commercial and defense sectors, where electric and hybrid propulsion is gaining traction. The increasing adoption of electric vessels by commercial fleets, supported by favorable government policies and incentives, continues to be a significant driver. We project a CAGR of xx% during the forecast period (2025-2033). Advancements in battery management systems (BMS) and improved thermal management are further enhancing the appeal of marine batteries. The shift towards higher power and energy density solutions caters to the growing needs of larger vessels. The transition is also fueled by the declining cost of lithium-ion batteries and growing concerns regarding carbon emissions.
Leading Regions, Countries, or Segments in Marine Battery Industry
The report identifies [Region/Country – e.g., North America/United States] as the dominant region in the marine battery market, driven primarily by strong demand from the commercial shipping sector and significant government support for clean energy initiatives. Within battery types, lithium-ion batteries are the fastest-growing segment, surpassing lead-acid batteries in terms of market share by 2025.
Key Drivers for the Dominant Region/Segment:
- Significant government investment in clean energy and electric propulsion technologies.
- Robust commercial shipping industry with a high demand for efficient and environmentally friendly solutions.
- Stringent emission regulations accelerating the adoption of electric and hybrid vessels.
- Developed infrastructure and supportive regulatory framework.
Lithium-ion Battery Dominance:
- Higher energy density compared to other battery technologies.
- Continuous advancements leading to improved performance and reduced costs.
- Growing preference amongst shipbuilders and operators.
Commercial Sector Leadership:
- Large fleet sizes in the commercial sector driving increased battery demand.
- Focus on operational cost reduction and environmental compliance.
- Increased adoption of hybrid and fully electric vessels.
Marine Battery Industry Product Innovations
Recent innovations in marine batteries focus on enhancing energy density, improving safety features, and extending lifespan. This includes the development of advanced battery management systems (BMS) for improved performance and safety, the use of new materials and cell chemistries to increase energy density, and innovative thermal management solutions to improve battery life and prevent overheating. These advancements cater to the growing demand for higher power and longer operational times for various marine applications. Unique selling propositions include extended operational life, improved safety systems, and reduced maintenance costs.
Propelling Factors for Marine Battery Industry Growth
The marine battery market is fueled by a confluence of technological, economic, and regulatory factors. Technological advancements, particularly in lithium-ion battery technology, are driving down costs and improving performance. Government regulations aimed at reducing greenhouse gas emissions from shipping are creating a strong incentive for the adoption of electric and hybrid vessels, which requires high-quality and reliable marine batteries. Furthermore, economic benefits such as reduced fuel costs and lower maintenance requirements associated with electric propulsion systems are influencing the market’s growth trajectory.
Obstacles in the Marine Battery Industry Market
Several factors are hindering the growth of the marine battery industry, including high initial investment costs of electric and hybrid propulsion systems, challenges related to the integration of battery systems into existing vessels, limited availability of charging infrastructure in ports, and concerns about battery safety and lifecycle management. Supply chain disruptions and the volatility of raw material prices can also impact the industry's growth. Competitive pressures, particularly from alternative energy technologies like fuel cells, also pose a challenge.
Future Opportunities in Marine Battery Industry
Emerging opportunities lie in the development of next-generation battery technologies with even higher energy density and longer lifespans. The expanding market for recreational boats and smaller vessels provides new avenues for growth, and advancements in battery management systems and charging technologies will significantly enhance the appeal of marine batteries. Exploration of new materials and manufacturing processes will further drive innovation and cost reduction. The focus on developing robust lifecycle management strategies for marine batteries is critical for the industry’s sustainability.
Major Players in the Marine Battery Industry Ecosystem
- EnerSys
- Leclanche SA
- Toshiba Corporation
- HBL Power System
- Furukawa Battery Solutions
- Siemens AG
- BorgWarner Inc
- Wartsila
- Saft
- Exide Technologies
Key Developments in Marine Battery Industry Industry
October 2022: ABS and Contemporary Amperex Technology Co., Limited (CATL) signed a cooperation agreement to research lithium battery propulsion for next-generation vessels, focusing on safety-related technologies. This collaboration is expected to significantly advance the development of standardized safety protocols for battery-powered vessels, boosting market confidence and adoption.
January 2022: Vision Marine Technologies partnered with Octillion Power Systems to develop a high-voltage 35 kW battery pack for the recreational boating market. This signifies expansion into a new market segment with significant growth potential, driving innovation and diversifying the applications of marine batteries.
Strategic Marine Battery Industry Market Forecast
The marine battery market is poised for robust growth, driven by the increasing adoption of electric and hybrid propulsion systems, supported by technological advancements and environmental regulations. Continued innovation in battery technology, coupled with the expansion of charging infrastructure and supportive government policies, will further accelerate market expansion. The focus on improving battery safety and extending lifespan will create new opportunities for growth and investment in the coming years, leading to a substantial increase in market value.
Marine Battery Industry Segmentation
-
1. Battery
- 1.1. Lithium-ion
- 1.2. Nickel-Cadmium
- 1.3. Fuel Cell
- 1.4. Lead Acid
-
2. Ship Type
- 2.1. Commercial
- 2.2. Defense
Marine Battery Industry Segmentation By Geography
-
1. North America
- 1.1. United States
- 1.2. Canada
-
2. Europe
- 2.1. Germany
- 2.2. United Kingdom
- 2.3. France
- 2.4. Russia
- 2.5. Rest of Europe
-
3. Asia Pacific
- 3.1. India
- 3.2. China
- 3.3. Japan
- 3.4. South Korea
- 3.5. Rest of Asia Pacific
-
4. Latin America
- 4.1. Brazil
- 4.2. Rest of Latin America
-
5. Middle East and Africa
- 5.1. United Arab Emirates
- 5.2. Saudi Arabia
- 5.3. Israel
- 5.4. South Africa
- 5.5. Rest of Middle East and Africa
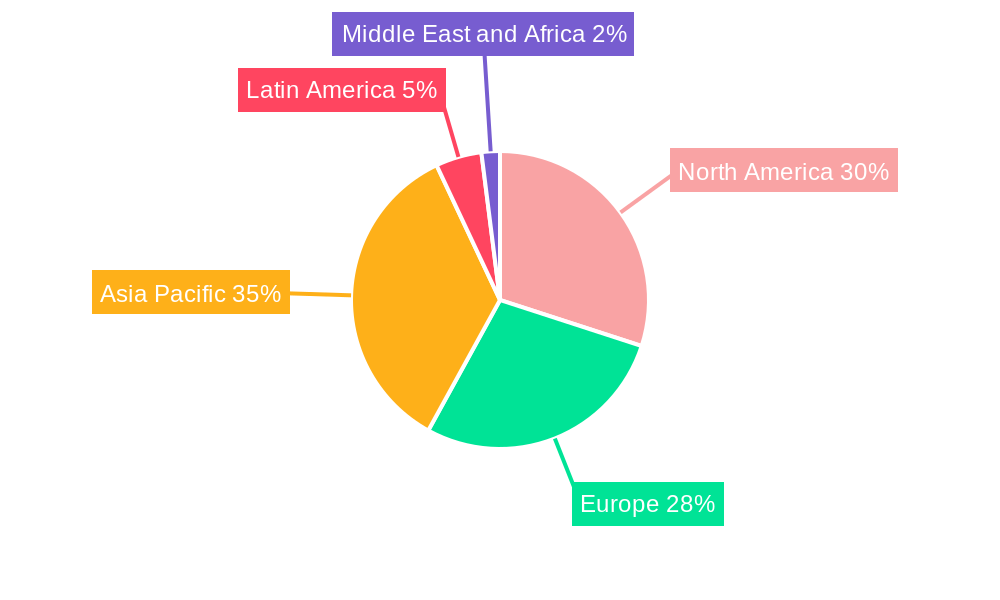
Marine Battery Industry Regional Market Share
Geographic Coverage of Marine Battery Industry
Marine Battery Industry REPORT HIGHLIGHTS
| Aspects | Details |
|---|---|
| Study Period | 2020-2034 |
| Base Year | 2025 |
| Estimated Year | 2026 |
| Forecast Period | 2026-2034 |
| Historical Period | 2020-2025 |
| Growth Rate | CAGR of 17.89% from 2020-2034 |
| Segmentation |
|
Table of Contents
- 1. Introduction
- 1.1. Research Scope
- 1.2. Market Segmentation
- 1.3. Research Objective
- 1.4. Definitions and Assumptions
- 2. Executive Summary
- 2.1. Market Snapshot
- 3. Market Dynamics
- 3.1. Market Drivers
- 3.2. Market Restrains
- 3.3. Market Trends
- 3.4. Market Opportunities
- 4. Market Factor Analysis
- 4.1. Porters Five Forces
- 4.1.1. Bargaining Power of Suppliers
- 4.1.2. Bargaining Power of Buyers
- 4.1.3. Threat of New Entrants
- 4.1.4. Threat of Substitutes
- 4.1.5. Competitive Rivalry
- 4.2. PESTEL analysis
- 4.3. BCG Analysis
- 4.3.1. Stars (High Growth, High Market Share)
- 4.3.2. Cash Cows (Low Growth, High Market Share)
- 4.3.3. Question Mark (High Growth, Low Market Share)
- 4.3.4. Dogs (Low Growth, Low Market Share)
- 4.4. Ansoff Matrix Analysis
- 4.5. Supply Chain Analysis
- 4.6. Regulatory Landscape
- 4.7. Current Market Potential and Opportunity Assessment (TAM–SAM–SOM Framework)
- 4.8. DMV Analyst Note
- 4.1. Porters Five Forces
- 5. Market Analysis, Insights and Forecast 2021-2033
- 5.1. Market Analysis, Insights and Forecast - by Battery
- 5.1.1. Lithium-ion
- 5.1.2. Nickel-Cadmium
- 5.1.3. Fuel Cell
- 5.1.4. Lead Acid
- 5.2. Market Analysis, Insights and Forecast - by Ship Type
- 5.2.1. Commercial
- 5.2.2. Defense
- 5.3. Market Analysis, Insights and Forecast - by Region
- 5.3.1. North America
- 5.3.2. Europe
- 5.3.3. Asia Pacific
- 5.3.4. Latin America
- 5.3.5. Middle East and Africa
- 5.1. Market Analysis, Insights and Forecast - by Battery
- 6. Global Marine Battery Industry Analysis, Insights and Forecast, 2021-2033
- 6.1. Market Analysis, Insights and Forecast - by Battery
- 6.1.1. Lithium-ion
- 6.1.2. Nickel-Cadmium
- 6.1.3. Fuel Cell
- 6.1.4. Lead Acid
- 6.2. Market Analysis, Insights and Forecast - by Ship Type
- 6.2.1. Commercial
- 6.2.2. Defense
- 6.1. Market Analysis, Insights and Forecast - by Battery
- 7. North America Marine Battery Industry Analysis, Insights and Forecast, 2020-2032
- 7.1. Market Analysis, Insights and Forecast - by Battery
- 7.1.1. Lithium-ion
- 7.1.2. Nickel-Cadmium
- 7.1.3. Fuel Cell
- 7.1.4. Lead Acid
- 7.2. Market Analysis, Insights and Forecast - by Ship Type
- 7.2.1. Commercial
- 7.2.2. Defense
- 7.1. Market Analysis, Insights and Forecast - by Battery
- 8. Europe Marine Battery Industry Analysis, Insights and Forecast, 2020-2032
- 8.1. Market Analysis, Insights and Forecast - by Battery
- 8.1.1. Lithium-ion
- 8.1.2. Nickel-Cadmium
- 8.1.3. Fuel Cell
- 8.1.4. Lead Acid
- 8.2. Market Analysis, Insights and Forecast - by Ship Type
- 8.2.1. Commercial
- 8.2.2. Defense
- 8.1. Market Analysis, Insights and Forecast - by Battery
- 9. Asia Pacific Marine Battery Industry Analysis, Insights and Forecast, 2020-2032
- 9.1. Market Analysis, Insights and Forecast - by Battery
- 9.1.1. Lithium-ion
- 9.1.2. Nickel-Cadmium
- 9.1.3. Fuel Cell
- 9.1.4. Lead Acid
- 9.2. Market Analysis, Insights and Forecast - by Ship Type
- 9.2.1. Commercial
- 9.2.2. Defense
- 9.1. Market Analysis, Insights and Forecast - by Battery
- 10. Latin America Marine Battery Industry Analysis, Insights and Forecast, 2020-2032
- 10.1. Market Analysis, Insights and Forecast - by Battery
- 10.1.1. Lithium-ion
- 10.1.2. Nickel-Cadmium
- 10.1.3. Fuel Cell
- 10.1.4. Lead Acid
- 10.2. Market Analysis, Insights and Forecast - by Ship Type
- 10.2.1. Commercial
- 10.2.2. Defense
- 10.1. Market Analysis, Insights and Forecast - by Battery
- 11. Middle East and Africa Marine Battery Industry Analysis, Insights and Forecast, 2020-2032
- 11.1. Market Analysis, Insights and Forecast - by Battery
- 11.1.1. Lithium-ion
- 11.1.2. Nickel-Cadmium
- 11.1.3. Fuel Cell
- 11.1.4. Lead Acid
- 11.2. Market Analysis, Insights and Forecast - by Ship Type
- 11.2.1. Commercial
- 11.2.2. Defense
- 11.1. Market Analysis, Insights and Forecast - by Battery
- 12. Competitive Analysis
- 12.1. Company Profiles
- 12.1.1 EnerSys
- 12.1.1.1. Company Overview
- 12.1.1.2. Products
- 12.1.1.3. Company Financials
- 12.1.1.4. SWOT Analysis
- 12.1.2 Leclanche SA
- 12.1.2.1. Company Overview
- 12.1.2.2. Products
- 12.1.2.3. Company Financials
- 12.1.2.4. SWOT Analysis
- 12.1.3 Toshiba Corporation
- 12.1.3.1. Company Overview
- 12.1.3.2. Products
- 12.1.3.3. Company Financials
- 12.1.3.4. SWOT Analysis
- 12.1.4 HBL Power System
- 12.1.4.1. Company Overview
- 12.1.4.2. Products
- 12.1.4.3. Company Financials
- 12.1.4.4. SWOT Analysis
- 12.1.5 Furukawa Battery Solutions
- 12.1.5.1. Company Overview
- 12.1.5.2. Products
- 12.1.5.3. Company Financials
- 12.1.5.4. SWOT Analysis
- 12.1.6 Siemens AG
- 12.1.6.1. Company Overview
- 12.1.6.2. Products
- 12.1.6.3. Company Financials
- 12.1.6.4. SWOT Analysis
- 12.1.7 BorgWarner Inc
- 12.1.7.1. Company Overview
- 12.1.7.2. Products
- 12.1.7.3. Company Financials
- 12.1.7.4. SWOT Analysis
- 12.1.8 Wartsila
- 12.1.8.1. Company Overview
- 12.1.8.2. Products
- 12.1.8.3. Company Financials
- 12.1.8.4. SWOT Analysis
- 12.1.9 Saft
- 12.1.9.1. Company Overview
- 12.1.9.2. Products
- 12.1.9.3. Company Financials
- 12.1.9.4. SWOT Analysis
- 12.1.10 Exide Technologies
- 12.1.10.1. Company Overview
- 12.1.10.2. Products
- 12.1.10.3. Company Financials
- 12.1.10.4. SWOT Analysis
- 12.1.1 EnerSys
- 12.2. Market Entropy
- 12.2.1 Company's Key Areas Served
- 12.2.2 Recent Developments
- 12.3. Company Market Share Analysis 2025
- 12.3.1 Top 5 Companies Market Share Analysis
- 12.3.2 Top 3 Companies Market Share Analysis
- 12.4. List of Potential Customers
- 13. Research Methodology
List of Figures
- Figure 1: Global Marine Battery Industry Revenue Breakdown (billion, %) by Region 2025 & 2033
- Figure 2: North America Marine Battery Industry Revenue (billion), by Battery 2025 & 2033
- Figure 3: North America Marine Battery Industry Revenue Share (%), by Battery 2025 & 2033
- Figure 4: North America Marine Battery Industry Revenue (billion), by Ship Type 2025 & 2033
- Figure 5: North America Marine Battery Industry Revenue Share (%), by Ship Type 2025 & 2033
- Figure 6: North America Marine Battery Industry Revenue (billion), by Country 2025 & 2033
- Figure 7: North America Marine Battery Industry Revenue Share (%), by Country 2025 & 2033
- Figure 8: Europe Marine Battery Industry Revenue (billion), by Battery 2025 & 2033
- Figure 9: Europe Marine Battery Industry Revenue Share (%), by Battery 2025 & 2033
- Figure 10: Europe Marine Battery Industry Revenue (billion), by Ship Type 2025 & 2033
- Figure 11: Europe Marine Battery Industry Revenue Share (%), by Ship Type 2025 & 2033
- Figure 12: Europe Marine Battery Industry Revenue (billion), by Country 2025 & 2033
- Figure 13: Europe Marine Battery Industry Revenue Share (%), by Country 2025 & 2033
- Figure 14: Asia Pacific Marine Battery Industry Revenue (billion), by Battery 2025 & 2033
- Figure 15: Asia Pacific Marine Battery Industry Revenue Share (%), by Battery 2025 & 2033
- Figure 16: Asia Pacific Marine Battery Industry Revenue (billion), by Ship Type 2025 & 2033
- Figure 17: Asia Pacific Marine Battery Industry Revenue Share (%), by Ship Type 2025 & 2033
- Figure 18: Asia Pacific Marine Battery Industry Revenue (billion), by Country 2025 & 2033
- Figure 19: Asia Pacific Marine Battery Industry Revenue Share (%), by Country 2025 & 2033
- Figure 20: Latin America Marine Battery Industry Revenue (billion), by Battery 2025 & 2033
- Figure 21: Latin America Marine Battery Industry Revenue Share (%), by Battery 2025 & 2033
- Figure 22: Latin America Marine Battery Industry Revenue (billion), by Ship Type 2025 & 2033
- Figure 23: Latin America Marine Battery Industry Revenue Share (%), by Ship Type 2025 & 2033
- Figure 24: Latin America Marine Battery Industry Revenue (billion), by Country 2025 & 2033
- Figure 25: Latin America Marine Battery Industry Revenue Share (%), by Country 2025 & 2033
- Figure 26: Middle East and Africa Marine Battery Industry Revenue (billion), by Battery 2025 & 2033
- Figure 27: Middle East and Africa Marine Battery Industry Revenue Share (%), by Battery 2025 & 2033
- Figure 28: Middle East and Africa Marine Battery Industry Revenue (billion), by Ship Type 2025 & 2033
- Figure 29: Middle East and Africa Marine Battery Industry Revenue Share (%), by Ship Type 2025 & 2033
- Figure 30: Middle East and Africa Marine Battery Industry Revenue (billion), by Country 2025 & 2033
- Figure 31: Middle East and Africa Marine Battery Industry Revenue Share (%), by Country 2025 & 2033
List of Tables
- Table 1: Global Marine Battery Industry Revenue billion Forecast, by Battery 2020 & 2033
- Table 2: Global Marine Battery Industry Revenue billion Forecast, by Ship Type 2020 & 2033
- Table 3: Global Marine Battery Industry Revenue billion Forecast, by Region 2020 & 2033
- Table 4: Global Marine Battery Industry Revenue billion Forecast, by Battery 2020 & 2033
- Table 5: Global Marine Battery Industry Revenue billion Forecast, by Ship Type 2020 & 2033
- Table 6: Global Marine Battery Industry Revenue billion Forecast, by Country 2020 & 2033
- Table 7: United States Marine Battery Industry Revenue (billion) Forecast, by Application 2020 & 2033
- Table 8: Canada Marine Battery Industry Revenue (billion) Forecast, by Application 2020 & 2033
- Table 9: Global Marine Battery Industry Revenue billion Forecast, by Battery 2020 & 2033
- Table 10: Global Marine Battery Industry Revenue billion Forecast, by Ship Type 2020 & 2033
- Table 11: Global Marine Battery Industry Revenue billion Forecast, by Country 2020 & 2033
- Table 12: Germany Marine Battery Industry Revenue (billion) Forecast, by Application 2020 & 2033
- Table 13: United Kingdom Marine Battery Industry Revenue (billion) Forecast, by Application 2020 & 2033
- Table 14: France Marine Battery Industry Revenue (billion) Forecast, by Application 2020 & 2033
- Table 15: Russia Marine Battery Industry Revenue (billion) Forecast, by Application 2020 & 2033
- Table 16: Rest of Europe Marine Battery Industry Revenue (billion) Forecast, by Application 2020 & 2033
- Table 17: Global Marine Battery Industry Revenue billion Forecast, by Battery 2020 & 2033
- Table 18: Global Marine Battery Industry Revenue billion Forecast, by Ship Type 2020 & 2033
- Table 19: Global Marine Battery Industry Revenue billion Forecast, by Country 2020 & 2033
- Table 20: India Marine Battery Industry Revenue (billion) Forecast, by Application 2020 & 2033
- Table 21: China Marine Battery Industry Revenue (billion) Forecast, by Application 2020 & 2033
- Table 22: Japan Marine Battery Industry Revenue (billion) Forecast, by Application 2020 & 2033
- Table 23: South Korea Marine Battery Industry Revenue (billion) Forecast, by Application 2020 & 2033
- Table 24: Rest of Asia Pacific Marine Battery Industry Revenue (billion) Forecast, by Application 2020 & 2033
- Table 25: Global Marine Battery Industry Revenue billion Forecast, by Battery 2020 & 2033
- Table 26: Global Marine Battery Industry Revenue billion Forecast, by Ship Type 2020 & 2033
- Table 27: Global Marine Battery Industry Revenue billion Forecast, by Country 2020 & 2033
- Table 28: Brazil Marine Battery Industry Revenue (billion) Forecast, by Application 2020 & 2033
- Table 29: Rest of Latin America Marine Battery Industry Revenue (billion) Forecast, by Application 2020 & 2033
- Table 30: Global Marine Battery Industry Revenue billion Forecast, by Battery 2020 & 2033
- Table 31: Global Marine Battery Industry Revenue billion Forecast, by Ship Type 2020 & 2033
- Table 32: Global Marine Battery Industry Revenue billion Forecast, by Country 2020 & 2033
- Table 33: United Arab Emirates Marine Battery Industry Revenue (billion) Forecast, by Application 2020 & 2033
- Table 34: Saudi Arabia Marine Battery Industry Revenue (billion) Forecast, by Application 2020 & 2033
- Table 35: Israel Marine Battery Industry Revenue (billion) Forecast, by Application 2020 & 2033
- Table 36: South Africa Marine Battery Industry Revenue (billion) Forecast, by Application 2020 & 2033
- Table 37: Rest of Middle East and Africa Marine Battery Industry Revenue (billion) Forecast, by Application 2020 & 2033
Frequently Asked Questions
1. What is the projected Compound Annual Growth Rate (CAGR) of the Marine Battery Industry?
The projected CAGR is approximately 17.89%.
2. Which companies are prominent players in the Marine Battery Industry?
Key companies in the market include EnerSys, Leclanche SA, Toshiba Corporation, HBL Power System, Furukawa Battery Solutions, Siemens AG, BorgWarner Inc, Wartsila, Saft, Exide Technologies.
3. What are the main segments of the Marine Battery Industry?
The market segments include Battery, Ship Type.
4. Can you provide details about the market size?
The market size is estimated to be USD 1.54 billion as of 2022.
5. What are some drivers contributing to market growth?
Increasing Adoption of 2-wheelers across the Globe.
6. What are the notable trends driving market growth?
Lithium-ion Segment is Projected to Highest Growth During the Forecast Period.
7. Are there any restraints impacting market growth?
Rise in demand of Electric Vehicles.
8. Can you provide examples of recent developments in the market?
October 2022: ABS signed a cooperation agreement with Contemporary Amperex Technology Co., Limited (CATL) to work together and research lithium battery propulsion for next-generation vessels. Under the agreement, the two companies would carry out research on the technical standards for battery-powered vessels, which includes key safety-related technologies such as the charging system, power battery compartment layout, propulsion system, and fire control.
9. What pricing options are available for accessing the report?
Pricing options include single-user, multi-user, and enterprise licenses priced at USD 4750, USD 5250, and USD 8750 respectively.
10. Is the market size provided in terms of value or volume?
The market size is provided in terms of value, measured in billion.
11. Are there any specific market keywords associated with the report?
Yes, the market keyword associated with the report is "Marine Battery Industry," which aids in identifying and referencing the specific market segment covered.
12. How do I determine which pricing option suits my needs best?
The pricing options vary based on user requirements and access needs. Individual users may opt for single-user licenses, while businesses requiring broader access may choose multi-user or enterprise licenses for cost-effective access to the report.
13. Are there any additional resources or data provided in the Marine Battery Industry report?
While the report offers comprehensive insights, it's advisable to review the specific contents or supplementary materials provided to ascertain if additional resources or data are available.
14. How can I stay updated on further developments or reports in the Marine Battery Industry?
To stay informed about further developments, trends, and reports in the Marine Battery Industry, consider subscribing to industry newsletters, following relevant companies and organizations, or regularly checking reputable industry news sources and publications.
Methodology
Step 1 - Identification of Relevant Samples Size from Population Database


Step 2 - Approaches for Defining Global Market Size (Value, Volume* & Price*)

Note*: In applicable scenarios
Step 3 - Data Sources
Primary Research
- Web Analytics
- Survey Reports
- Research Institute
- Latest Research Reports
- Opinion Leaders
Secondary Research
- Annual Reports
- White Paper
- Latest Press Release
- Industry Association
- Paid Database
- Investor Presentations

Step 4 - Data Triangulation
Involves using different sources of information in order to increase the validity of a study
These sources are likely to be stakeholders in a program - participants, other researchers, program staff, other community members, and so on.
Then we put all data in single framework & apply various statistical tools to find out the dynamic on the market.
During the analysis stage, feedback from the stakeholder groups would be compared to determine areas of agreement as well as areas of divergence