

Key Insights
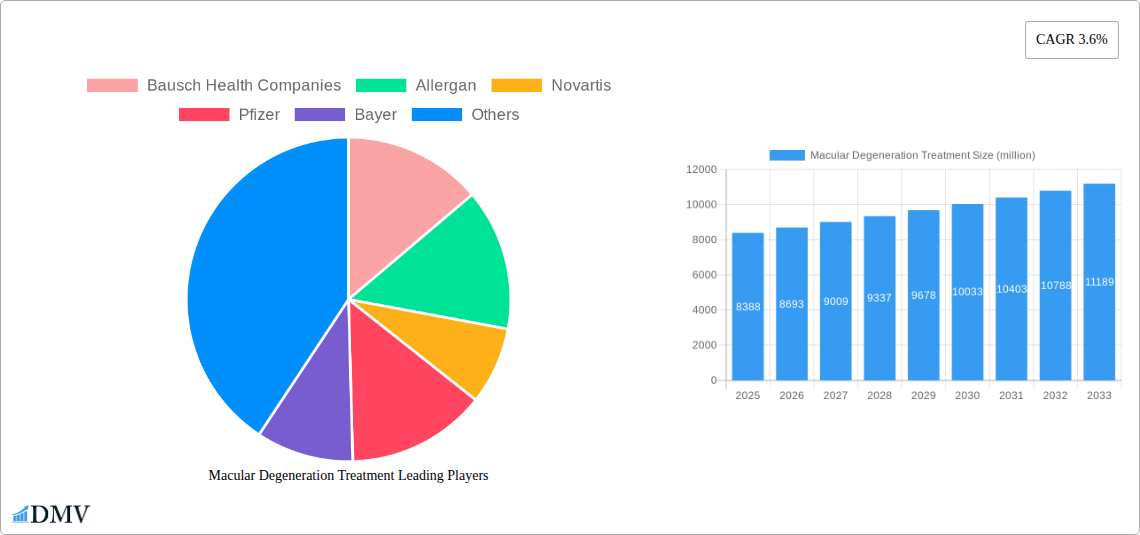
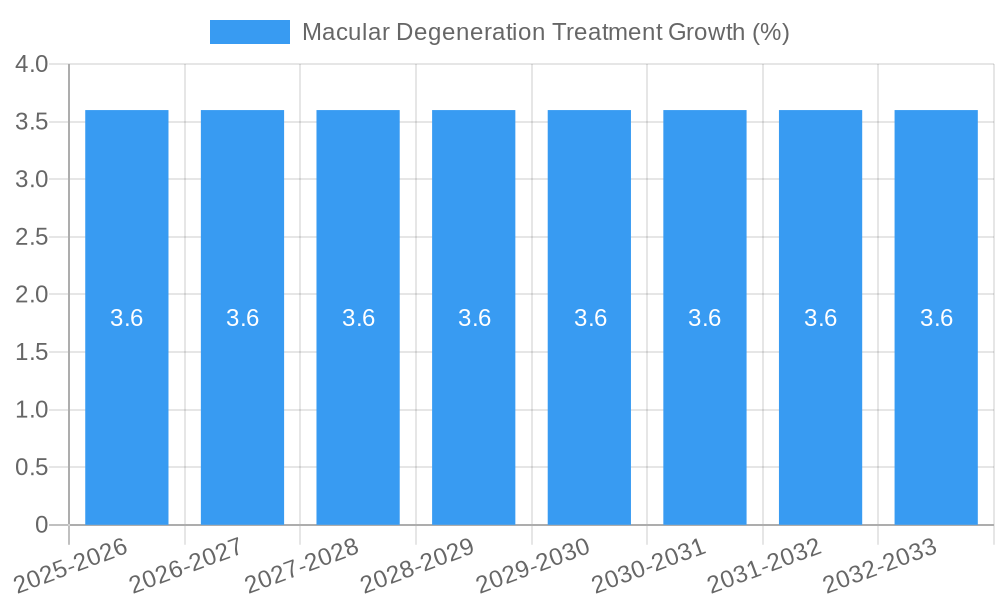
The global Macular Degeneration Treatment market is projected for robust expansion, estimated at $8,388 million in 2025 and poised for a Compound Annual Growth Rate (CAGR) of 3.6% through 2033. This upward trajectory is primarily propelled by the increasing prevalence of age-related macular degeneration (AMD), a leading cause of vision loss in older adults, coupled with advancements in therapeutic technologies and a growing emphasis on early detection and intervention. The market is witnessing significant momentum driven by the development of novel injectable therapies and a rise in diagnostic tools that enable more precise identification of disease progression. The expanding elderly population worldwide, particularly in developed regions, represents a substantial demographic driver for increased demand for effective macular degeneration treatments. Furthermore, a greater awareness among patients and healthcare providers about the availability and efficacy of treatment options is contributing to market growth.
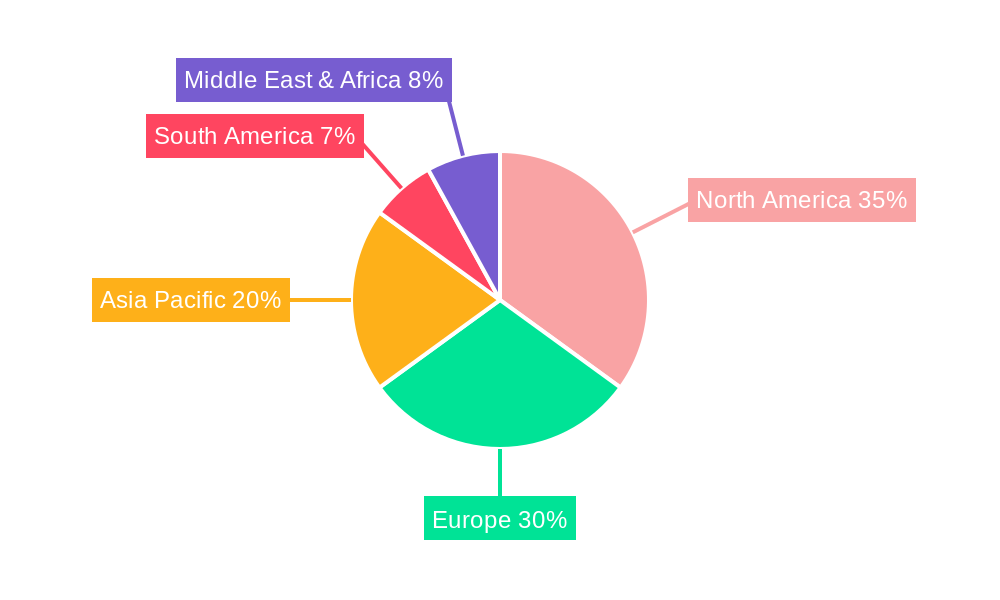
The market is segmented by application, with Hospitals and Eye Clinics forming the dominant segments, reflecting the specialized nature of diagnosis and treatment. In terms of treatment type, while established therapies like Lucentis, Eylea, and Avastin continue to hold significant market share, ongoing research and development are introducing new biologics and combination therapies that promise improved patient outcomes and are expected to capture increasing market attention. Geographically, North America and Europe currently represent the largest markets due to advanced healthcare infrastructure, high disposable incomes, and strong research capabilities. However, the Asia Pacific region is anticipated to exhibit the fastest growth, fueled by a burgeoning patient population, increasing healthcare expenditure, and the expansion of pharmaceutical manufacturing and distribution networks. Restraints such as the high cost of some advanced treatments and potential side effects remain considerations, but ongoing innovation and efforts to improve treatment accessibility are expected to mitigate these challenges.
This in-depth report offers a comprehensive analysis of the global Macular Degeneration Treatment market, providing critical insights for stakeholders navigating this dynamic sector. Spanning the historical period of 2019–2024 and projecting growth through 2033, this research delves into market composition, industry evolution, regional dominance, product innovations, growth drivers, challenges, and future opportunities. With a base year of 2025 and an estimated year also of 2025, the report equips businesses, investors, and healthcare providers with the data and strategic foresight to capitalize on the projected market expansion, estimated to reach XX million by 2033.
Macular Degeneration Treatment Market Composition & Trends
The Macular Degeneration Treatment market exhibits a moderate concentration, with key players like Bausch Health Companies, Allergan, Novartis, Pfizer, Bayer, Roche, Sanofi, Santen Pharmaceuticals, Regeneron Pharmaceuticals, and Kanghong Pharma holding significant market share. Innovation catalysts are primarily driven by advancements in targeted therapies and drug delivery systems, aiming to improve patient outcomes and reduce treatment frequency. The regulatory landscape, while robust, presents opportunities for novel therapies that demonstrate superior safety and efficacy. Substitute products, such as less invasive or adjunctive therapies, are emerging but currently hold a niche position. End-user profiles are diverse, encompassing individuals with Age-related Macular Degeneration (AMD), both wet and dry forms, with a growing emphasis on early detection and intervention. Mergers and acquisitions (M&A) activity is anticipated to increase, with projected deal values in the XX million range, as larger pharmaceutical companies seek to bolster their portfolios with innovative macular degeneration treatments.
Macular Degeneration Treatment Industry Evolution
The Macular Degeneration Treatment industry has witnessed substantial evolution driven by a confluence of scientific breakthroughs and increasing global healthcare expenditure. Over the historical period from 2019 to 2024, the market experienced a compound annual growth rate (CAGR) of approximately XX%, fueled by a rising prevalence of age-related eye conditions and a growing understanding of the underlying disease mechanisms. Technological advancements have been instrumental, particularly in the development of novel anti-vascular endothelial growth factor (anti-VEGF) therapies such as Lucentis, Eylea, and Avastin. These treatments have revolutionized the management of wet AMD, significantly improving vision outcomes for millions. The adoption rate of these advanced therapies has surged, reflecting enhanced patient and physician confidence. Consumer demands are increasingly shifting towards less invasive treatment options, longer-acting formulations to reduce injection frequency, and personalized treatment approaches based on genetic predispositions and disease severity. The estimated market growth trajectory for the forecast period (2025–2033) is projected at a robust CAGR of XX%, indicating sustained expansion driven by ongoing innovation and an expanding patient pool.
Leading Regions, Countries, or Segments in Macular Degeneration Treatment
The Eye Clinics segment is projected to lead the Macular Degeneration Treatment market in terms of revenue and adoption during the forecast period (2025–2033). This dominance is attributed to several key drivers:
- Specialized Infrastructure and Expertise: Eye clinics are equipped with the specialized diagnostic tools and highly trained ophthalmologists essential for accurate diagnosis and effective management of macular degeneration. This allows for precise administration of treatments like Lucentis, Eylea, and Avastin.
- Patient Access to Advanced Therapies: These clinics serve as primary access points for patients seeking cutting-edge treatments, often facilitating direct engagement with pharmaceutical companies for advanced therapies. The estimated patient volume in eye clinics is projected to reach XX million by 2033.
- Focus on Ophthalmology: The dedicated focus on ophthalmic care ensures that these facilities are at the forefront of adopting new treatment protocols and technologies.
North America is anticipated to be the leading geographical region, driven by high healthcare spending, a strong presence of leading pharmaceutical companies (e.g., Regeneron Pharmaceuticals, Allergan), and a high prevalence of age-related eye diseases. The region's investment trends in ophthalmic research and development are estimated to be in the XX million range annually. Europe follows closely, with robust healthcare systems and increasing awareness campaigns contributing to market growth.
Macular Degeneration Treatment Product Innovations
Product innovations in Macular Degeneration Treatment are centered on enhancing efficacy, prolonging therapeutic effects, and minimizing patient burden. Novel drug delivery systems, such as sustained-release implants and gene therapy approaches, are emerging to reduce the frequency of intravitreal injections, a key concern for patients. The performance metrics of these next-generation treatments are demonstrating improved visual acuity and anatomical outcomes, with a projected reduction in treatment cycles by XX%. Unique selling propositions include greater patient convenience and potentially lower long-term healthcare costs. Technological advancements in biosimil development are also poised to offer more affordable alternatives, increasing accessibility.
Propelling Factors for Macular Degeneration Treatment Growth
The Macular Degeneration Treatment market is propelled by several key factors. Technological advancements in drug development and delivery, particularly anti-VEGF therapies, have dramatically improved patient outcomes. The aging global population is a significant demographic driver, as macular degeneration prevalence increases with age. Increased healthcare expenditure and insurance coverage globally facilitate greater access to advanced treatments. Furthermore, growing awareness and early diagnosis initiatives are identifying more patients at earlier, more treatable stages of the disease. The projected market expansion is further supported by a robust pipeline of innovative therapies.
Obstacles in the Macular Degeneration Treatment Market
Despite its growth, the Macular Degeneration Treatment market faces several obstacles. High treatment costs associated with advanced therapies can limit accessibility for a significant patient population, with average annual treatment costs for a single eye estimated at XX million. Stringent regulatory approval processes for novel drugs can lead to lengthy development timelines. Supply chain disruptions, as witnessed in recent global events, can impact the availability of essential medications. Furthermore, competitive pressures among established players and emerging biosimil manufacturers can influence pricing strategies and market dynamics.
Future Opportunities in Macular Degeneration Treatment
The future of Macular Degeneration Treatment is ripe with opportunities. Emerging markets in Asia-Pacific and Latin America present significant untapped potential due to their growing aging populations and improving healthcare infrastructure. Advancements in genetic testing and personalized medicine offer opportunities to tailor treatments to individual patient profiles, improving efficacy and reducing adverse events. The development of novel therapeutic modalities beyond anti-VEGF, such as gene therapy and regenerative medicine, holds promise for addressing the unmet needs of patients with dry AMD. Furthermore, digital health solutions for remote patient monitoring and adherence support can enhance treatment outcomes.
Major Players in the Macular Degeneration Treatment Ecosystem
- Bausch Health Companies
- Allergan
- Novartis
- Pfizer
- Bayer
- Roche
- Sanofi
- Santen Pharmaceuticals
- Regeneron Pharmaceuticals
- Kanghong Pharma
Key Developments in Macular Degeneration Treatment Industry
- 2023: Launch of novel sustained-release intravitreal implants offering longer treatment intervals.
- 2022: Significant clinical trial results published showcasing improved efficacy of new combination therapies.
- 2021: Increased investment in gene therapy research for age-related macular degeneration.
- 2020: Regulatory approval for a new biosimilar of a leading anti-VEGF drug, increasing market competition.
- 2019: Expansion of real-world evidence studies validating the long-term benefits of existing treatments.
Strategic Macular Degeneration Treatment Market Forecast
The strategic forecast for the Macular Degeneration Treatment market indicates sustained and robust growth, driven by ongoing technological innovation and an expanding patient demographic. Key growth catalysts include the introduction of next-generation therapies with improved efficacy and patient convenience, significant investments in R&D by major pharmaceutical players like Regeneron Pharmaceuticals and Novartis, and the increasing adoption of advanced treatments in emerging economies. The market's potential is further amplified by the growing emphasis on early detection and personalized treatment approaches, creating a favorable environment for both established and emerging companies to capture significant market share in the coming years.
Macular Degeneration Treatment Segmentation
-
1. Application
- 1.1. Hospitals
- 1.2. Eye Clinics
- 1.3. Others
-
2. Type
- 2.1. Lucentis
- 2.2. Eylea
- 2.3. Avastin
- 2.4. Others
Macular Degeneration Treatment Segmentation By Geography
-
1. North America
- 1.1. United States
- 1.2. Canada
- 1.3. Mexico
-
2. South America
- 2.1. Brazil
- 2.2. Argentina
- 2.3. Rest of South America
-
3. Europe
- 3.1. United Kingdom
- 3.2. Germany
- 3.3. France
- 3.4. Italy
- 3.5. Spain
- 3.6. Russia
- 3.7. Benelux
- 3.8. Nordics
- 3.9. Rest of Europe
-
4. Middle East & Africa
- 4.1. Turkey
- 4.2. Israel
- 4.3. GCC
- 4.4. North Africa
- 4.5. South Africa
- 4.6. Rest of Middle East & Africa
-
5. Asia Pacific
- 5.1. China
- 5.2. India
- 5.3. Japan
- 5.4. South Korea
- 5.5. ASEAN
- 5.6. Oceania
- 5.7. Rest of Asia Pacific
Macular Degeneration Treatment REPORT HIGHLIGHTS
| Aspects | Details |
|---|---|
| Study Period | 2019-2033 |
| Base Year | 2024 |
| Estimated Year | 2025 |
| Forecast Period | 2025-2033 |
| Historical Period | 2019-2024 |
| Growth Rate | CAGR of 3.6% from 2019-2033 |
| Segmentation |
|
Table of Contents
- 1. Introduction
- 1.1. Research Scope
- 1.2. Market Segmentation
- 1.3. Research Methodology
- 1.4. Definitions and Assumptions
- 2. Executive Summary
- 2.1. Introduction
- 3. Market Dynamics
- 3.1. Introduction
- 3.2. Market Drivers
- 3.3. Market Restrains
- 3.4. Market Trends
- 4. Market Factor Analysis
- 4.1. Porters Five Forces
- 4.2. Supply/Value Chain
- 4.3. PESTEL analysis
- 4.4. Market Entropy
- 4.5. Patent/Trademark Analysis
- 5. Global Macular Degeneration Treatment Analysis, Insights and Forecast, 2019-2031
- 5.1. Market Analysis, Insights and Forecast - by Application
- 5.1.1. Hospitals
- 5.1.2. Eye Clinics
- 5.1.3. Others
- 5.2. Market Analysis, Insights and Forecast - by Type
- 5.2.1. Lucentis
- 5.2.2. Eylea
- 5.2.3. Avastin
- 5.2.4. Others
- 5.3. Market Analysis, Insights and Forecast - by Region
- 5.3.1. North America
- 5.3.2. South America
- 5.3.3. Europe
- 5.3.4. Middle East & Africa
- 5.3.5. Asia Pacific
- 5.1. Market Analysis, Insights and Forecast - by Application
- 6. North America Macular Degeneration Treatment Analysis, Insights and Forecast, 2019-2031
- 6.1. Market Analysis, Insights and Forecast - by Application
- 6.1.1. Hospitals
- 6.1.2. Eye Clinics
- 6.1.3. Others
- 6.2. Market Analysis, Insights and Forecast - by Type
- 6.2.1. Lucentis
- 6.2.2. Eylea
- 6.2.3. Avastin
- 6.2.4. Others
- 6.1. Market Analysis, Insights and Forecast - by Application
- 7. South America Macular Degeneration Treatment Analysis, Insights and Forecast, 2019-2031
- 7.1. Market Analysis, Insights and Forecast - by Application
- 7.1.1. Hospitals
- 7.1.2. Eye Clinics
- 7.1.3. Others
- 7.2. Market Analysis, Insights and Forecast - by Type
- 7.2.1. Lucentis
- 7.2.2. Eylea
- 7.2.3. Avastin
- 7.2.4. Others
- 7.1. Market Analysis, Insights and Forecast - by Application
- 8. Europe Macular Degeneration Treatment Analysis, Insights and Forecast, 2019-2031
- 8.1. Market Analysis, Insights and Forecast - by Application
- 8.1.1. Hospitals
- 8.1.2. Eye Clinics
- 8.1.3. Others
- 8.2. Market Analysis, Insights and Forecast - by Type
- 8.2.1. Lucentis
- 8.2.2. Eylea
- 8.2.3. Avastin
- 8.2.4. Others
- 8.1. Market Analysis, Insights and Forecast - by Application
- 9. Middle East & Africa Macular Degeneration Treatment Analysis, Insights and Forecast, 2019-2031
- 9.1. Market Analysis, Insights and Forecast - by Application
- 9.1.1. Hospitals
- 9.1.2. Eye Clinics
- 9.1.3. Others
- 9.2. Market Analysis, Insights and Forecast - by Type
- 9.2.1. Lucentis
- 9.2.2. Eylea
- 9.2.3. Avastin
- 9.2.4. Others
- 9.1. Market Analysis, Insights and Forecast - by Application
- 10. Asia Pacific Macular Degeneration Treatment Analysis, Insights and Forecast, 2019-2031
- 10.1. Market Analysis, Insights and Forecast - by Application
- 10.1.1. Hospitals
- 10.1.2. Eye Clinics
- 10.1.3. Others
- 10.2. Market Analysis, Insights and Forecast - by Type
- 10.2.1. Lucentis
- 10.2.2. Eylea
- 10.2.3. Avastin
- 10.2.4. Others
- 10.1. Market Analysis, Insights and Forecast - by Application
- 11. Competitive Analysis
- 11.1. Global Market Share Analysis 2024
- 11.2. Company Profiles
- 11.2.1 Bausch Health Companies
- 11.2.1.1. Overview
- 11.2.1.2. Products
- 11.2.1.3. SWOT Analysis
- 11.2.1.4. Recent Developments
- 11.2.1.5. Financials (Based on Availability)
- 11.2.2 Allergan
- 11.2.2.1. Overview
- 11.2.2.2. Products
- 11.2.2.3. SWOT Analysis
- 11.2.2.4. Recent Developments
- 11.2.2.5. Financials (Based on Availability)
- 11.2.3 Novartis
- 11.2.3.1. Overview
- 11.2.3.2. Products
- 11.2.3.3. SWOT Analysis
- 11.2.3.4. Recent Developments
- 11.2.3.5. Financials (Based on Availability)
- 11.2.4 Pfizer
- 11.2.4.1. Overview
- 11.2.4.2. Products
- 11.2.4.3. SWOT Analysis
- 11.2.4.4. Recent Developments
- 11.2.4.5. Financials (Based on Availability)
- 11.2.5 Bayer
- 11.2.5.1. Overview
- 11.2.5.2. Products
- 11.2.5.3. SWOT Analysis
- 11.2.5.4. Recent Developments
- 11.2.5.5. Financials (Based on Availability)
- 11.2.6 Roche
- 11.2.6.1. Overview
- 11.2.6.2. Products
- 11.2.6.3. SWOT Analysis
- 11.2.6.4. Recent Developments
- 11.2.6.5. Financials (Based on Availability)
- 11.2.7 Sanofi
- 11.2.7.1. Overview
- 11.2.7.2. Products
- 11.2.7.3. SWOT Analysis
- 11.2.7.4. Recent Developments
- 11.2.7.5. Financials (Based on Availability)
- 11.2.8 Santen Pharmaceuticals
- 11.2.8.1. Overview
- 11.2.8.2. Products
- 11.2.8.3. SWOT Analysis
- 11.2.8.4. Recent Developments
- 11.2.8.5. Financials (Based on Availability)
- 11.2.9 Regeneron Pharmaceuticals
- 11.2.9.1. Overview
- 11.2.9.2. Products
- 11.2.9.3. SWOT Analysis
- 11.2.9.4. Recent Developments
- 11.2.9.5. Financials (Based on Availability)
- 11.2.10 Kanghong Pharma
- 11.2.10.1. Overview
- 11.2.10.2. Products
- 11.2.10.3. SWOT Analysis
- 11.2.10.4. Recent Developments
- 11.2.10.5. Financials (Based on Availability)
- 11.2.1 Bausch Health Companies
List of Figures
- Figure 1: Global Macular Degeneration Treatment Revenue Breakdown (million, %) by Region 2024 & 2032
- Figure 2: North America Macular Degeneration Treatment Revenue (million), by Application 2024 & 2032
- Figure 3: North America Macular Degeneration Treatment Revenue Share (%), by Application 2024 & 2032
- Figure 4: North America Macular Degeneration Treatment Revenue (million), by Type 2024 & 2032
- Figure 5: North America Macular Degeneration Treatment Revenue Share (%), by Type 2024 & 2032
- Figure 6: North America Macular Degeneration Treatment Revenue (million), by Country 2024 & 2032
- Figure 7: North America Macular Degeneration Treatment Revenue Share (%), by Country 2024 & 2032
- Figure 8: South America Macular Degeneration Treatment Revenue (million), by Application 2024 & 2032
- Figure 9: South America Macular Degeneration Treatment Revenue Share (%), by Application 2024 & 2032
- Figure 10: South America Macular Degeneration Treatment Revenue (million), by Type 2024 & 2032
- Figure 11: South America Macular Degeneration Treatment Revenue Share (%), by Type 2024 & 2032
- Figure 12: South America Macular Degeneration Treatment Revenue (million), by Country 2024 & 2032
- Figure 13: South America Macular Degeneration Treatment Revenue Share (%), by Country 2024 & 2032
- Figure 14: Europe Macular Degeneration Treatment Revenue (million), by Application 2024 & 2032
- Figure 15: Europe Macular Degeneration Treatment Revenue Share (%), by Application 2024 & 2032
- Figure 16: Europe Macular Degeneration Treatment Revenue (million), by Type 2024 & 2032
- Figure 17: Europe Macular Degeneration Treatment Revenue Share (%), by Type 2024 & 2032
- Figure 18: Europe Macular Degeneration Treatment Revenue (million), by Country 2024 & 2032
- Figure 19: Europe Macular Degeneration Treatment Revenue Share (%), by Country 2024 & 2032
- Figure 20: Middle East & Africa Macular Degeneration Treatment Revenue (million), by Application 2024 & 2032
- Figure 21: Middle East & Africa Macular Degeneration Treatment Revenue Share (%), by Application 2024 & 2032
- Figure 22: Middle East & Africa Macular Degeneration Treatment Revenue (million), by Type 2024 & 2032
- Figure 23: Middle East & Africa Macular Degeneration Treatment Revenue Share (%), by Type 2024 & 2032
- Figure 24: Middle East & Africa Macular Degeneration Treatment Revenue (million), by Country 2024 & 2032
- Figure 25: Middle East & Africa Macular Degeneration Treatment Revenue Share (%), by Country 2024 & 2032
- Figure 26: Asia Pacific Macular Degeneration Treatment Revenue (million), by Application 2024 & 2032
- Figure 27: Asia Pacific Macular Degeneration Treatment Revenue Share (%), by Application 2024 & 2032
- Figure 28: Asia Pacific Macular Degeneration Treatment Revenue (million), by Type 2024 & 2032
- Figure 29: Asia Pacific Macular Degeneration Treatment Revenue Share (%), by Type 2024 & 2032
- Figure 30: Asia Pacific Macular Degeneration Treatment Revenue (million), by Country 2024 & 2032
- Figure 31: Asia Pacific Macular Degeneration Treatment Revenue Share (%), by Country 2024 & 2032
List of Tables
- Table 1: Global Macular Degeneration Treatment Revenue million Forecast, by Region 2019 & 2032
- Table 2: Global Macular Degeneration Treatment Revenue million Forecast, by Application 2019 & 2032
- Table 3: Global Macular Degeneration Treatment Revenue million Forecast, by Type 2019 & 2032
- Table 4: Global Macular Degeneration Treatment Revenue million Forecast, by Region 2019 & 2032
- Table 5: Global Macular Degeneration Treatment Revenue million Forecast, by Application 2019 & 2032
- Table 6: Global Macular Degeneration Treatment Revenue million Forecast, by Type 2019 & 2032
- Table 7: Global Macular Degeneration Treatment Revenue million Forecast, by Country 2019 & 2032
- Table 8: United States Macular Degeneration Treatment Revenue (million) Forecast, by Application 2019 & 2032
- Table 9: Canada Macular Degeneration Treatment Revenue (million) Forecast, by Application 2019 & 2032
- Table 10: Mexico Macular Degeneration Treatment Revenue (million) Forecast, by Application 2019 & 2032
- Table 11: Global Macular Degeneration Treatment Revenue million Forecast, by Application 2019 & 2032
- Table 12: Global Macular Degeneration Treatment Revenue million Forecast, by Type 2019 & 2032
- Table 13: Global Macular Degeneration Treatment Revenue million Forecast, by Country 2019 & 2032
- Table 14: Brazil Macular Degeneration Treatment Revenue (million) Forecast, by Application 2019 & 2032
- Table 15: Argentina Macular Degeneration Treatment Revenue (million) Forecast, by Application 2019 & 2032
- Table 16: Rest of South America Macular Degeneration Treatment Revenue (million) Forecast, by Application 2019 & 2032
- Table 17: Global Macular Degeneration Treatment Revenue million Forecast, by Application 2019 & 2032
- Table 18: Global Macular Degeneration Treatment Revenue million Forecast, by Type 2019 & 2032
- Table 19: Global Macular Degeneration Treatment Revenue million Forecast, by Country 2019 & 2032
- Table 20: United Kingdom Macular Degeneration Treatment Revenue (million) Forecast, by Application 2019 & 2032
- Table 21: Germany Macular Degeneration Treatment Revenue (million) Forecast, by Application 2019 & 2032
- Table 22: France Macular Degeneration Treatment Revenue (million) Forecast, by Application 2019 & 2032
- Table 23: Italy Macular Degeneration Treatment Revenue (million) Forecast, by Application 2019 & 2032
- Table 24: Spain Macular Degeneration Treatment Revenue (million) Forecast, by Application 2019 & 2032
- Table 25: Russia Macular Degeneration Treatment Revenue (million) Forecast, by Application 2019 & 2032
- Table 26: Benelux Macular Degeneration Treatment Revenue (million) Forecast, by Application 2019 & 2032
- Table 27: Nordics Macular Degeneration Treatment Revenue (million) Forecast, by Application 2019 & 2032
- Table 28: Rest of Europe Macular Degeneration Treatment Revenue (million) Forecast, by Application 2019 & 2032
- Table 29: Global Macular Degeneration Treatment Revenue million Forecast, by Application 2019 & 2032
- Table 30: Global Macular Degeneration Treatment Revenue million Forecast, by Type 2019 & 2032
- Table 31: Global Macular Degeneration Treatment Revenue million Forecast, by Country 2019 & 2032
- Table 32: Turkey Macular Degeneration Treatment Revenue (million) Forecast, by Application 2019 & 2032
- Table 33: Israel Macular Degeneration Treatment Revenue (million) Forecast, by Application 2019 & 2032
- Table 34: GCC Macular Degeneration Treatment Revenue (million) Forecast, by Application 2019 & 2032
- Table 35: North Africa Macular Degeneration Treatment Revenue (million) Forecast, by Application 2019 & 2032
- Table 36: South Africa Macular Degeneration Treatment Revenue (million) Forecast, by Application 2019 & 2032
- Table 37: Rest of Middle East & Africa Macular Degeneration Treatment Revenue (million) Forecast, by Application 2019 & 2032
- Table 38: Global Macular Degeneration Treatment Revenue million Forecast, by Application 2019 & 2032
- Table 39: Global Macular Degeneration Treatment Revenue million Forecast, by Type 2019 & 2032
- Table 40: Global Macular Degeneration Treatment Revenue million Forecast, by Country 2019 & 2032
- Table 41: China Macular Degeneration Treatment Revenue (million) Forecast, by Application 2019 & 2032
- Table 42: India Macular Degeneration Treatment Revenue (million) Forecast, by Application 2019 & 2032
- Table 43: Japan Macular Degeneration Treatment Revenue (million) Forecast, by Application 2019 & 2032
- Table 44: South Korea Macular Degeneration Treatment Revenue (million) Forecast, by Application 2019 & 2032
- Table 45: ASEAN Macular Degeneration Treatment Revenue (million) Forecast, by Application 2019 & 2032
- Table 46: Oceania Macular Degeneration Treatment Revenue (million) Forecast, by Application 2019 & 2032
- Table 47: Rest of Asia Pacific Macular Degeneration Treatment Revenue (million) Forecast, by Application 2019 & 2032
Frequently Asked Questions
1. What is the projected Compound Annual Growth Rate (CAGR) of the Macular Degeneration Treatment?
The projected CAGR is approximately 3.6%.
2. Which companies are prominent players in the Macular Degeneration Treatment?
Key companies in the market include Bausch Health Companies, Allergan, Novartis, Pfizer, Bayer, Roche, Sanofi, Santen Pharmaceuticals, Regeneron Pharmaceuticals, Kanghong Pharma.
3. What are the main segments of the Macular Degeneration Treatment?
The market segments include Application, Type.
4. Can you provide details about the market size?
The market size is estimated to be USD 8388 million as of 2022.
5. What are some drivers contributing to market growth?
N/A
6. What are the notable trends driving market growth?
N/A
7. Are there any restraints impacting market growth?
N/A
8. Can you provide examples of recent developments in the market?
N/A
9. What pricing options are available for accessing the report?
Pricing options include single-user, multi-user, and enterprise licenses priced at USD 2900.00, USD 4350.00, and USD 5800.00 respectively.
10. Is the market size provided in terms of value or volume?
The market size is provided in terms of value, measured in million.
11. Are there any specific market keywords associated with the report?
Yes, the market keyword associated with the report is "Macular Degeneration Treatment," which aids in identifying and referencing the specific market segment covered.
12. How do I determine which pricing option suits my needs best?
The pricing options vary based on user requirements and access needs. Individual users may opt for single-user licenses, while businesses requiring broader access may choose multi-user or enterprise licenses for cost-effective access to the report.
13. Are there any additional resources or data provided in the Macular Degeneration Treatment report?
While the report offers comprehensive insights, it's advisable to review the specific contents or supplementary materials provided to ascertain if additional resources or data are available.
14. How can I stay updated on further developments or reports in the Macular Degeneration Treatment?
To stay informed about further developments, trends, and reports in the Macular Degeneration Treatment, consider subscribing to industry newsletters, following relevant companies and organizations, or regularly checking reputable industry news sources and publications.
Methodology
Step 1 - Identification of Relevant Samples Size from Population Database


Step 2 - Approaches for Defining Global Market Size (Value, Volume* & Price*)

Note*: In applicable scenarios
Step 3 - Data Sources
Primary Research
- Web Analytics
- Survey Reports
- Research Institute
- Latest Research Reports
- Opinion Leaders
Secondary Research
- Annual Reports
- White Paper
- Latest Press Release
- Industry Association
- Paid Database
- Investor Presentations

Step 4 - Data Triangulation
Involves using different sources of information in order to increase the validity of a study
These sources are likely to be stakeholders in a program - participants, other researchers, program staff, other community members, and so on.
Then we put all data in single framework & apply various statistical tools to find out the dynamic on the market.
During the analysis stage, feedback from the stakeholder groups would be compared to determine areas of agreement as well as areas of divergence
