

Key Insights
The Low Emission Vehicle (LEV) market is exhibiting significant expansion, propelled by stringent emission reduction regulations, heightened consumer environmental consciousness, and advancements in EV battery technology enhancing range and performance. The market, valued at 334.9 billion in the base year of 2025, is projected to achieve a Compound Annual Growth Rate (CAGR) of 23.2% from 2025 to 2033. This growth is further stimulated by evolving consumer preferences for sustainable transportation, substantial investments in charging infrastructure, and favorable government incentives. While passenger vehicles currently lead, the commercial segment, encompassing electric buses and delivery trucks, is poised for notable growth in urban settings. Hybrid and mild-hybrid vehicles serve as crucial transitional technologies, facilitating the shift towards full electrification. Accelerated market expansion is attributed to technological breakthroughs such as rapid charging and increased battery energy density. However, high initial purchase costs, localized charging infrastructure limitations, and concerns regarding battery longevity and disposal remain key market restraints.
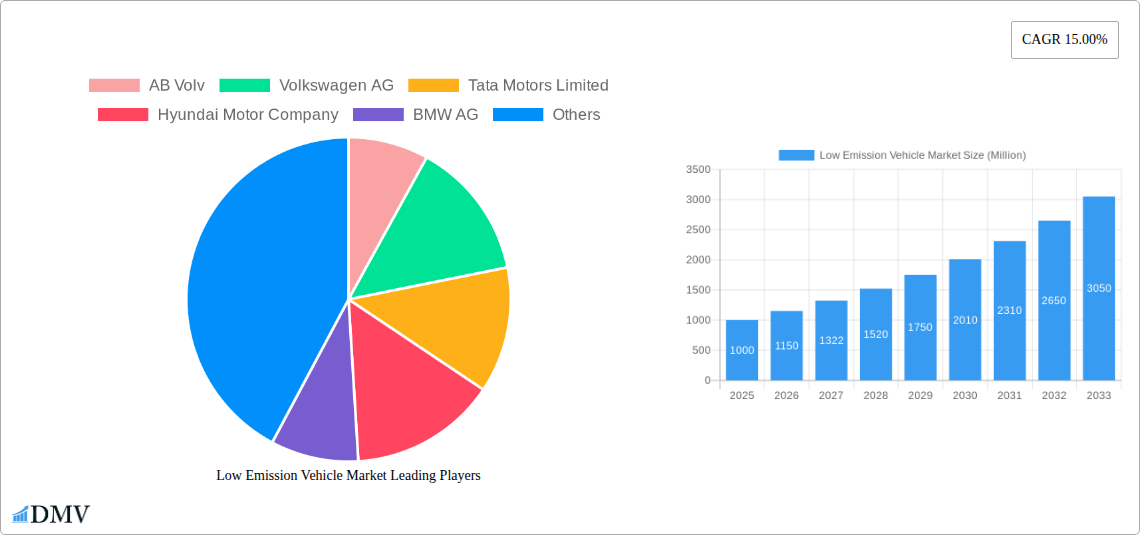
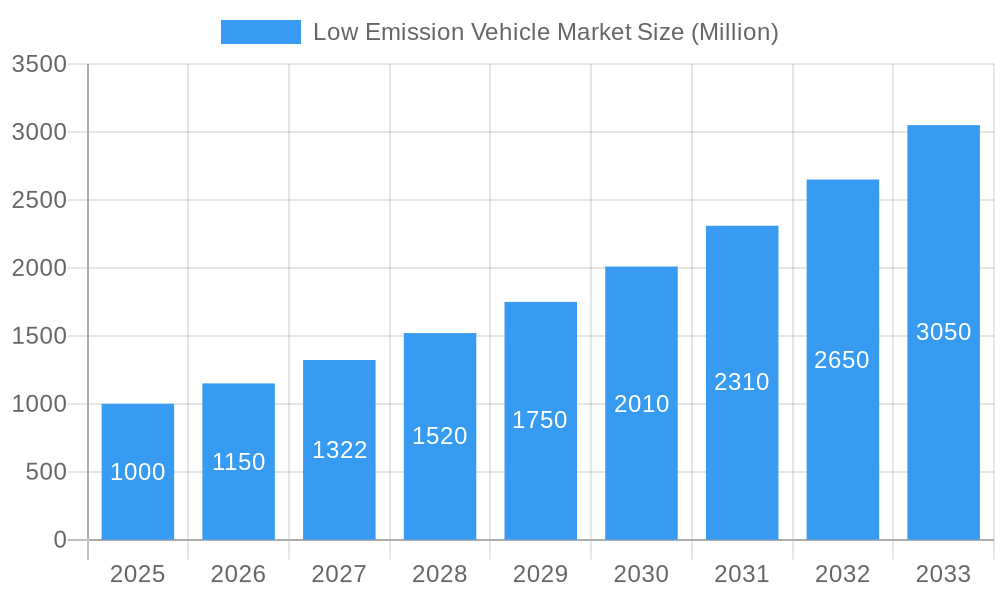
Low Emission Vehicle Market Market Size (In Billion)
Geographically, the LEV market is witnessing robust growth across all major regions. North America and Europe maintain substantial market share, supported by established automotive sectors and supportive regulatory environments. The Asia-Pacific region, particularly China and India, is emerging as a pivotal growth driver, fueled by its expanding automotive industry and government policies promoting LEV adoption. Leading players including Tesla, Volkswagen, BYD, and Toyota are instrumental in shaping market trends through innovation and strategic alliances. The competitive arena is becoming increasingly dynamic, with both established manufacturers and emerging companies vying for dominance via technological advancements, cost optimization, and strategic market expansion. The LEV market's outlook is highly positive, anticipating sustained growth as technological barriers diminish and consumer adoption accelerates.
Low Emission Vehicle Market Company Market Share
Low Emission Vehicle Market: A Comprehensive Report (2019-2033)
This insightful report provides a detailed analysis of the Low Emission Vehicle (LEV) market, offering a comprehensive overview of its current state, future trajectory, and key players. The study period spans from 2019 to 2033, with a focus on the base year 2025 and a forecast period extending to 2033. This report is invaluable for stakeholders seeking to understand the complexities of this rapidly evolving market and make informed strategic decisions. The market is segmented by Vehicle Type (Passenger Car, Commercial Vehicles) and Type (Hybrid, Mild Hybrid, Pure Electric Vehicle). Key players analyzed include AB Volvo, Volkswagen AG, Tata Motors Limited, Hyundai Motor Company, BMW AG, Tesla Inc, Mercedes-Benz Group AG, BYD Auto Co Ltd, and Toyota Motor Corporation. The total market value is projected to reach xx Million by 2033.
Low Emission Vehicle Market Composition & Trends
This section delves into the intricate dynamics of the LEV market, evaluating market concentration, innovation drivers, regulatory landscapes, substitute products, end-user profiles, and M&A activities. We analyze market share distribution across key players, highlighting the competitive landscape and identifying emerging trends. The report also quantifies M&A deal values, providing crucial insights into strategic investments and market consolidation. The analysis considers the impact of evolving regulations, the emergence of alternative fuel technologies, and shifting consumer preferences on the market's overall composition and future direction.
- Market Concentration: Analysis of market share held by top 10 players (estimated xx% market share in 2025).
- Innovation Catalysts: Detailed examination of technological advancements in battery technology, electric motor efficiency, and charging infrastructure.
- Regulatory Landscape: Assessment of government policies and incentives influencing LEV adoption across different regions.
- Substitute Products: Evaluation of competing technologies and their impact on market growth.
- End-User Profiles: Segmentation of the market based on consumer demographics and purchasing behaviors.
- M&A Activities: Analysis of significant mergers and acquisitions, including deal values and strategic implications.
Low Emission Vehicle Market Industry Evolution
This section provides a detailed analysis of the LEV market's growth trajectory, technological advancements, and the changing consumer preferences driving its evolution. We examine historical growth rates (2019-2024) and project future growth (2025-2033), considering factors such as increasing environmental concerns, government regulations, and technological breakthroughs. The report also quantifies the adoption rates of different LEV types and explores the impact of these trends on market dynamics. Specific data points, including CAGR and market size projections are provided to support the analysis.
Leading Regions, Countries, or Segments in Low Emission Vehicle Market
This section identifies the dominant regions, countries, and market segments within the LEV market. The analysis focuses on Passenger Car, Commercial Vehicles, Hybrid, Mild Hybrid, and Pure Electric Vehicle segments, pinpointing the factors driving their dominance. The geographical analysis includes key regions and countries, considering local regulations, economic factors, and infrastructure development.
Key Drivers (Bullet Points):
- Investment trends in specific regions.
- Government policies and incentives promoting LEV adoption.
- Infrastructure development (charging stations, etc.).
- Consumer preferences and purchasing power.
Dominance Factors (Paragraphs): In-depth analysis of the reasons behind the leading segment's superior performance. This includes a detailed explanation of the factors mentioned above in relation to the leading segment.
Low Emission Vehicle Market Product Innovations
This section explores the latest innovations in LEV technology, focusing on product features, applications, and performance metrics. We highlight unique selling propositions (USPs) and technological advancements contributing to improved efficiency, range, and affordability. The analysis covers innovations in battery technology, electric motors, charging systems, and vehicle design.
Propelling Factors for Low Emission Vehicle Market Growth
This section identifies the key factors driving the growth of the LEV market. We examine technological advancements, economic incentives, and supportive government regulations, providing specific examples. This includes the decreasing cost of batteries, improving battery technology, and rising consumer demand for sustainable transportation.
Obstacles in the Low Emission Vehicle Market
This section examines barriers hindering the growth of the LEV market. We explore regulatory challenges, supply chain disruptions, and competitive pressures, providing quantifiable impacts wherever possible. This analysis includes the limitations of charging infrastructure, the high initial cost of EVs, and the range anxiety among consumers.
Future Opportunities in Low Emission Vehicle Market
This section highlights emerging opportunities for growth in the LEV market. We explore potential new markets, technological breakthroughs, and evolving consumer trends that present promising avenues for expansion and investment. This includes the rise of autonomous driving technology, advancements in solid-state batteries, and the growth of the shared mobility sector.
Major Players in the Low Emission Vehicle Market Ecosystem
Key Developments in Low Emission Vehicle Market Industry
- December 2021: Hyundai India announces six new EVs by 2028 and a Rs 4,000 crore (USD xx Million) investment in development and charging infrastructure, highlighting a strong push towards BEV adoption and local manufacturing.
- January 2022: Volkswagen Group and Bosch Group sign an MOU to create a European battery equipment solution provider, signifying a collaborative effort towards enhancing battery production capabilities.
- August 2022: Maruti Suzuki confirms its first EV launch by 2025 and its parent company, Suzuki Motor Corporation, plans a USD 127 Million investment in an EV manufacturing plant and lithium-ion battery production in Gujarat, India, addressing the current reliance on imported batteries.
Strategic Low Emission Vehicle Market Forecast
The LEV market is poised for substantial growth, driven by technological advancements, supportive government policies, and increasing environmental awareness. The forecast period (2025-2033) indicates a significant expansion, with substantial market potential across various segments and regions. Continuous innovation in battery technology, improved charging infrastructure, and the rising affordability of EVs will play a crucial role in shaping this growth. The market is expected to witness increased competition, consolidation, and the emergence of new market entrants.
Low Emission Vehicle Market Segmentation
-
1. Vehicle Type
- 1.1. Passenger Car
- 1.2. Commercial Vehicles
-
2. Type
- 2.1. Hybrid
- 2.2. Mild Hybrid
- 2.3. Pure Electric Vehicle
Low Emission Vehicle Market Segmentation By Geography
-
1. North America
- 1.1. United States Of America
- 1.2. Canada
- 1.3. Mexico
- 1.4. Rest of North America
-
2. Europe
- 2.1. Germany
- 2.2. United Kingdom
- 2.3. France
- 2.4. Italy
- 2.5. Spain
- 2.6. Rest of Europe
-
3. Asia Pacific
- 3.1. India
- 3.2. China
- 3.3. Japan
- 3.4. South Korea
- 3.5. Rest of Asia Pacific
-
4. Rest of the World
- 4.1. Brazil
- 4.2. Saudi Arabia
- 4.3. United Arab Emirates
- 4.4. South Africa
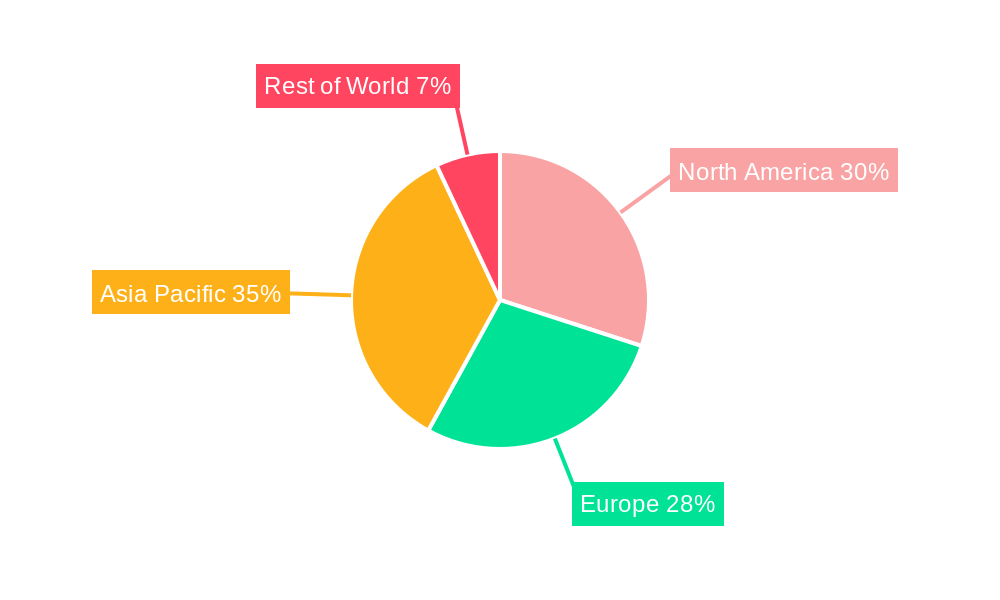
Low Emission Vehicle Market Regional Market Share
Geographic Coverage of Low Emission Vehicle Market
Low Emission Vehicle Market REPORT HIGHLIGHTS
| Aspects | Details |
|---|---|
| Study Period | 2020-2034 |
| Base Year | 2025 |
| Estimated Year | 2026 |
| Forecast Period | 2026-2034 |
| Historical Period | 2020-2025 |
| Growth Rate | CAGR of 18.2% from 2020-2034 |
| Segmentation |
|
Table of Contents
- 1. Introduction
- 1.1. Research Scope
- 1.2. Market Segmentation
- 1.3. Research Objective
- 1.4. Definitions and Assumptions
- 2. Executive Summary
- 2.1. Market Snapshot
- 3. Market Dynamics
- 3.1. Market Drivers
- 3.2. Market Restrains
- 3.3. Market Trends
- 3.4. Market Opportunities
- 4. Market Factor Analysis
- 4.1. Porters Five Forces
- 4.1.1. Bargaining Power of Suppliers
- 4.1.2. Bargaining Power of Buyers
- 4.1.3. Threat of New Entrants
- 4.1.4. Threat of Substitutes
- 4.1.5. Competitive Rivalry
- 4.2. PESTEL analysis
- 4.3. BCG Analysis
- 4.3.1. Stars (High Growth, High Market Share)
- 4.3.2. Cash Cows (Low Growth, High Market Share)
- 4.3.3. Question Mark (High Growth, Low Market Share)
- 4.3.4. Dogs (Low Growth, Low Market Share)
- 4.4. Ansoff Matrix Analysis
- 4.5. Supply Chain Analysis
- 4.6. Regulatory Landscape
- 4.7. Current Market Potential and Opportunity Assessment (TAM–SAM–SOM Framework)
- 4.8. DMV Analyst Note
- 4.1. Porters Five Forces
- 5. Market Analysis, Insights and Forecast 2021-2033
- 5.1. Market Analysis, Insights and Forecast - by Vehicle Type
- 5.1.1. Passenger Car
- 5.1.2. Commercial Vehicles
- 5.2. Market Analysis, Insights and Forecast - by Type
- 5.2.1. Hybrid
- 5.2.2. Mild Hybrid
- 5.2.3. Pure Electric Vehicle
- 5.3. Market Analysis, Insights and Forecast - by Region
- 5.3.1. North America
- 5.3.2. Europe
- 5.3.3. Asia Pacific
- 5.3.4. Rest of the World
- 5.1. Market Analysis, Insights and Forecast - by Vehicle Type
- 6. Global Low Emission Vehicle Market Analysis, Insights and Forecast, 2021-2033
- 6.1. Market Analysis, Insights and Forecast - by Vehicle Type
- 6.1.1. Passenger Car
- 6.1.2. Commercial Vehicles
- 6.2. Market Analysis, Insights and Forecast - by Type
- 6.2.1. Hybrid
- 6.2.2. Mild Hybrid
- 6.2.3. Pure Electric Vehicle
- 6.1. Market Analysis, Insights and Forecast - by Vehicle Type
- 7. North America Low Emission Vehicle Market Analysis, Insights and Forecast, 2020-2032
- 7.1. Market Analysis, Insights and Forecast - by Vehicle Type
- 7.1.1. Passenger Car
- 7.1.2. Commercial Vehicles
- 7.2. Market Analysis, Insights and Forecast - by Type
- 7.2.1. Hybrid
- 7.2.2. Mild Hybrid
- 7.2.3. Pure Electric Vehicle
- 7.1. Market Analysis, Insights and Forecast - by Vehicle Type
- 8. Europe Low Emission Vehicle Market Analysis, Insights and Forecast, 2020-2032
- 8.1. Market Analysis, Insights and Forecast - by Vehicle Type
- 8.1.1. Passenger Car
- 8.1.2. Commercial Vehicles
- 8.2. Market Analysis, Insights and Forecast - by Type
- 8.2.1. Hybrid
- 8.2.2. Mild Hybrid
- 8.2.3. Pure Electric Vehicle
- 8.1. Market Analysis, Insights and Forecast - by Vehicle Type
- 9. Asia Pacific Low Emission Vehicle Market Analysis, Insights and Forecast, 2020-2032
- 9.1. Market Analysis, Insights and Forecast - by Vehicle Type
- 9.1.1. Passenger Car
- 9.1.2. Commercial Vehicles
- 9.2. Market Analysis, Insights and Forecast - by Type
- 9.2.1. Hybrid
- 9.2.2. Mild Hybrid
- 9.2.3. Pure Electric Vehicle
- 9.1. Market Analysis, Insights and Forecast - by Vehicle Type
- 10. Rest of the World Low Emission Vehicle Market Analysis, Insights and Forecast, 2020-2032
- 10.1. Market Analysis, Insights and Forecast - by Vehicle Type
- 10.1.1. Passenger Car
- 10.1.2. Commercial Vehicles
- 10.2. Market Analysis, Insights and Forecast - by Type
- 10.2.1. Hybrid
- 10.2.2. Mild Hybrid
- 10.2.3. Pure Electric Vehicle
- 10.1. Market Analysis, Insights and Forecast - by Vehicle Type
- 11. Competitive Analysis
- 11.1. Company Profiles
- 11.1.1 AB Volv
- 11.1.1.1. Company Overview
- 11.1.1.2. Products
- 11.1.1.3. Company Financials
- 11.1.1.4. SWOT Analysis
- 11.1.2 Volkswagen AG
- 11.1.2.1. Company Overview
- 11.1.2.2. Products
- 11.1.2.3. Company Financials
- 11.1.2.4. SWOT Analysis
- 11.1.3 Tata Motors Limited
- 11.1.3.1. Company Overview
- 11.1.3.2. Products
- 11.1.3.3. Company Financials
- 11.1.3.4. SWOT Analysis
- 11.1.4 Hyundai Motor Company
- 11.1.4.1. Company Overview
- 11.1.4.2. Products
- 11.1.4.3. Company Financials
- 11.1.4.4. SWOT Analysis
- 11.1.5 BMW AG
- 11.1.5.1. Company Overview
- 11.1.5.2. Products
- 11.1.5.3. Company Financials
- 11.1.5.4. SWOT Analysis
- 11.1.6 Tesla Inc
- 11.1.6.1. Company Overview
- 11.1.6.2. Products
- 11.1.6.3. Company Financials
- 11.1.6.4. SWOT Analysis
- 11.1.7 Mercedes-Benz Group AG
- 11.1.7.1. Company Overview
- 11.1.7.2. Products
- 11.1.7.3. Company Financials
- 11.1.7.4. SWOT Analysis
- 11.1.8 BYD Auto Co Ltd
- 11.1.8.1. Company Overview
- 11.1.8.2. Products
- 11.1.8.3. Company Financials
- 11.1.8.4. SWOT Analysis
- 11.1.9 Toyota Motor Corporation
- 11.1.9.1. Company Overview
- 11.1.9.2. Products
- 11.1.9.3. Company Financials
- 11.1.9.4. SWOT Analysis
- 11.1.1 AB Volv
- 11.2. Market Entropy
- 11.2.1 Company's Key Areas Served
- 11.2.2 Recent Developments
- 11.3. Company Market Share Analysis 2025
- 11.3.1 Top 5 Companies Market Share Analysis
- 11.3.2 Top 3 Companies Market Share Analysis
- 11.4. List of Potential Customers
- 12. Research Methodology
List of Figures
- Figure 1: Global Low Emission Vehicle Market Revenue Breakdown (million, %) by Region 2025 & 2033
- Figure 2: North America Low Emission Vehicle Market Revenue (million), by Vehicle Type 2025 & 2033
- Figure 3: North America Low Emission Vehicle Market Revenue Share (%), by Vehicle Type 2025 & 2033
- Figure 4: North America Low Emission Vehicle Market Revenue (million), by Type 2025 & 2033
- Figure 5: North America Low Emission Vehicle Market Revenue Share (%), by Type 2025 & 2033
- Figure 6: North America Low Emission Vehicle Market Revenue (million), by Country 2025 & 2033
- Figure 7: North America Low Emission Vehicle Market Revenue Share (%), by Country 2025 & 2033
- Figure 8: Europe Low Emission Vehicle Market Revenue (million), by Vehicle Type 2025 & 2033
- Figure 9: Europe Low Emission Vehicle Market Revenue Share (%), by Vehicle Type 2025 & 2033
- Figure 10: Europe Low Emission Vehicle Market Revenue (million), by Type 2025 & 2033
- Figure 11: Europe Low Emission Vehicle Market Revenue Share (%), by Type 2025 & 2033
- Figure 12: Europe Low Emission Vehicle Market Revenue (million), by Country 2025 & 2033
- Figure 13: Europe Low Emission Vehicle Market Revenue Share (%), by Country 2025 & 2033
- Figure 14: Asia Pacific Low Emission Vehicle Market Revenue (million), by Vehicle Type 2025 & 2033
- Figure 15: Asia Pacific Low Emission Vehicle Market Revenue Share (%), by Vehicle Type 2025 & 2033
- Figure 16: Asia Pacific Low Emission Vehicle Market Revenue (million), by Type 2025 & 2033
- Figure 17: Asia Pacific Low Emission Vehicle Market Revenue Share (%), by Type 2025 & 2033
- Figure 18: Asia Pacific Low Emission Vehicle Market Revenue (million), by Country 2025 & 2033
- Figure 19: Asia Pacific Low Emission Vehicle Market Revenue Share (%), by Country 2025 & 2033
- Figure 20: Rest of the World Low Emission Vehicle Market Revenue (million), by Vehicle Type 2025 & 2033
- Figure 21: Rest of the World Low Emission Vehicle Market Revenue Share (%), by Vehicle Type 2025 & 2033
- Figure 22: Rest of the World Low Emission Vehicle Market Revenue (million), by Type 2025 & 2033
- Figure 23: Rest of the World Low Emission Vehicle Market Revenue Share (%), by Type 2025 & 2033
- Figure 24: Rest of the World Low Emission Vehicle Market Revenue (million), by Country 2025 & 2033
- Figure 25: Rest of the World Low Emission Vehicle Market Revenue Share (%), by Country 2025 & 2033
List of Tables
- Table 1: Global Low Emission Vehicle Market Revenue million Forecast, by Vehicle Type 2020 & 2033
- Table 2: Global Low Emission Vehicle Market Revenue million Forecast, by Type 2020 & 2033
- Table 3: Global Low Emission Vehicle Market Revenue million Forecast, by Region 2020 & 2033
- Table 4: Global Low Emission Vehicle Market Revenue million Forecast, by Vehicle Type 2020 & 2033
- Table 5: Global Low Emission Vehicle Market Revenue million Forecast, by Type 2020 & 2033
- Table 6: Global Low Emission Vehicle Market Revenue million Forecast, by Country 2020 & 2033
- Table 7: United States Of America Low Emission Vehicle Market Revenue (million) Forecast, by Application 2020 & 2033
- Table 8: Canada Low Emission Vehicle Market Revenue (million) Forecast, by Application 2020 & 2033
- Table 9: Mexico Low Emission Vehicle Market Revenue (million) Forecast, by Application 2020 & 2033
- Table 10: Rest of North America Low Emission Vehicle Market Revenue (million) Forecast, by Application 2020 & 2033
- Table 11: Global Low Emission Vehicle Market Revenue million Forecast, by Vehicle Type 2020 & 2033
- Table 12: Global Low Emission Vehicle Market Revenue million Forecast, by Type 2020 & 2033
- Table 13: Global Low Emission Vehicle Market Revenue million Forecast, by Country 2020 & 2033
- Table 14: Germany Low Emission Vehicle Market Revenue (million) Forecast, by Application 2020 & 2033
- Table 15: United Kingdom Low Emission Vehicle Market Revenue (million) Forecast, by Application 2020 & 2033
- Table 16: France Low Emission Vehicle Market Revenue (million) Forecast, by Application 2020 & 2033
- Table 17: Italy Low Emission Vehicle Market Revenue (million) Forecast, by Application 2020 & 2033
- Table 18: Spain Low Emission Vehicle Market Revenue (million) Forecast, by Application 2020 & 2033
- Table 19: Rest of Europe Low Emission Vehicle Market Revenue (million) Forecast, by Application 2020 & 2033
- Table 20: Global Low Emission Vehicle Market Revenue million Forecast, by Vehicle Type 2020 & 2033
- Table 21: Global Low Emission Vehicle Market Revenue million Forecast, by Type 2020 & 2033
- Table 22: Global Low Emission Vehicle Market Revenue million Forecast, by Country 2020 & 2033
- Table 23: India Low Emission Vehicle Market Revenue (million) Forecast, by Application 2020 & 2033
- Table 24: China Low Emission Vehicle Market Revenue (million) Forecast, by Application 2020 & 2033
- Table 25: Japan Low Emission Vehicle Market Revenue (million) Forecast, by Application 2020 & 2033
- Table 26: South Korea Low Emission Vehicle Market Revenue (million) Forecast, by Application 2020 & 2033
- Table 27: Rest of Asia Pacific Low Emission Vehicle Market Revenue (million) Forecast, by Application 2020 & 2033
- Table 28: Global Low Emission Vehicle Market Revenue million Forecast, by Vehicle Type 2020 & 2033
- Table 29: Global Low Emission Vehicle Market Revenue million Forecast, by Type 2020 & 2033
- Table 30: Global Low Emission Vehicle Market Revenue million Forecast, by Country 2020 & 2033
- Table 31: Brazil Low Emission Vehicle Market Revenue (million) Forecast, by Application 2020 & 2033
- Table 32: Saudi Arabia Low Emission Vehicle Market Revenue (million) Forecast, by Application 2020 & 2033
- Table 33: United Arab Emirates Low Emission Vehicle Market Revenue (million) Forecast, by Application 2020 & 2033
- Table 34: South Africa Low Emission Vehicle Market Revenue (million) Forecast, by Application 2020 & 2033
Frequently Asked Questions
1. What is the projected Compound Annual Growth Rate (CAGR) of the Low Emission Vehicle Market?
The projected CAGR is approximately 18.2%.
2. Which companies are prominent players in the Low Emission Vehicle Market?
Key companies in the market include AB Volv, Volkswagen AG, Tata Motors Limited, Hyundai Motor Company, BMW AG, Tesla Inc, Mercedes-Benz Group AG, BYD Auto Co Ltd, Toyota Motor Corporation.
3. What are the main segments of the Low Emission Vehicle Market?
The market segments include Vehicle Type, Type.
4. Can you provide details about the market size?
The market size is estimated to be USD XXX million as of 2022.
5. What are some drivers contributing to market growth?
Increasing Vehicle Production.
6. What are the notable trends driving market growth?
Favorable Government Policies and Regulatory Norms are Expected to Drive the Market.
7. Are there any restraints impacting market growth?
Global Trade Dynamics.
8. Can you provide examples of recent developments in the market?
August 2022: India's largest automaker Maruti Suzuki confirmed that it shall soon introduce its first electric vehicle latest by 2025 end. In addition, Its parent firm, Suzuki Motor Corporation, is looking forward to investing INR 10,400 crore (USD 127 million) in Gujarat to build a manufacturing plant to produce electric vehicles. The company said it would not only manufacture electric vehicles in the country but also start production of lithium-ion batteries, which are currently imported from other countries by several OEMs.
9. What pricing options are available for accessing the report?
Pricing options include single-user, multi-user, and enterprise licenses priced at USD 4750, USD 5250, and USD 8750 respectively.
10. Is the market size provided in terms of value or volume?
The market size is provided in terms of value, measured in million.
11. Are there any specific market keywords associated with the report?
Yes, the market keyword associated with the report is "Low Emission Vehicle Market," which aids in identifying and referencing the specific market segment covered.
12. How do I determine which pricing option suits my needs best?
The pricing options vary based on user requirements and access needs. Individual users may opt for single-user licenses, while businesses requiring broader access may choose multi-user or enterprise licenses for cost-effective access to the report.
13. Are there any additional resources or data provided in the Low Emission Vehicle Market report?
While the report offers comprehensive insights, it's advisable to review the specific contents or supplementary materials provided to ascertain if additional resources or data are available.
14. How can I stay updated on further developments or reports in the Low Emission Vehicle Market?
To stay informed about further developments, trends, and reports in the Low Emission Vehicle Market, consider subscribing to industry newsletters, following relevant companies and organizations, or regularly checking reputable industry news sources and publications.
Methodology
Step 1 - Identification of Relevant Samples Size from Population Database


Step 2 - Approaches for Defining Global Market Size (Value, Volume* & Price*)

Note*: In applicable scenarios
Step 3 - Data Sources
Primary Research
- Web Analytics
- Survey Reports
- Research Institute
- Latest Research Reports
- Opinion Leaders
Secondary Research
- Annual Reports
- White Paper
- Latest Press Release
- Industry Association
- Paid Database
- Investor Presentations

Step 4 - Data Triangulation
Involves using different sources of information in order to increase the validity of a study
These sources are likely to be stakeholders in a program - participants, other researchers, program staff, other community members, and so on.
Then we put all data in single framework & apply various statistical tools to find out the dynamic on the market.
During the analysis stage, feedback from the stakeholder groups would be compared to determine areas of agreement as well as areas of divergence