

Key Insights
The global autonomous taxi market is poised for significant expansion, driven by rapid urbanization, increasing demand for efficient mobility solutions, and advancements in self-driving technology. Projections indicate a substantial market size, with a remarkable CAGR of 99.1% from 2025 to 2033. Key growth catalysts include the declining costs of autonomous driving systems, supportive governmental policies in key regions, and the widespread adoption of electric and hybrid vehicle platforms. The market is segmented by service type (on-demand rentals, fixed-route shuttles), autonomy level (Level 3 to Level 5), propulsion (electric, hybrid, fuel cell), vehicle type (cars, vans), and application (passenger transport, logistics). Leading players include established ride-sharing services like Uber and Didi Chuxing, automotive manufacturers such as Tesla and Volvo, and specialized AV technology firms including Waymo and Cruise. North America and Asia-Pacific are expected to lead market growth, fueled by substantial R&D investments, favorable regulatory frameworks, and high urban population density. However, market penetration may be tempered by the need for enhanced safety regulations, public acceptance, infrastructure development, and initial deployment costs.
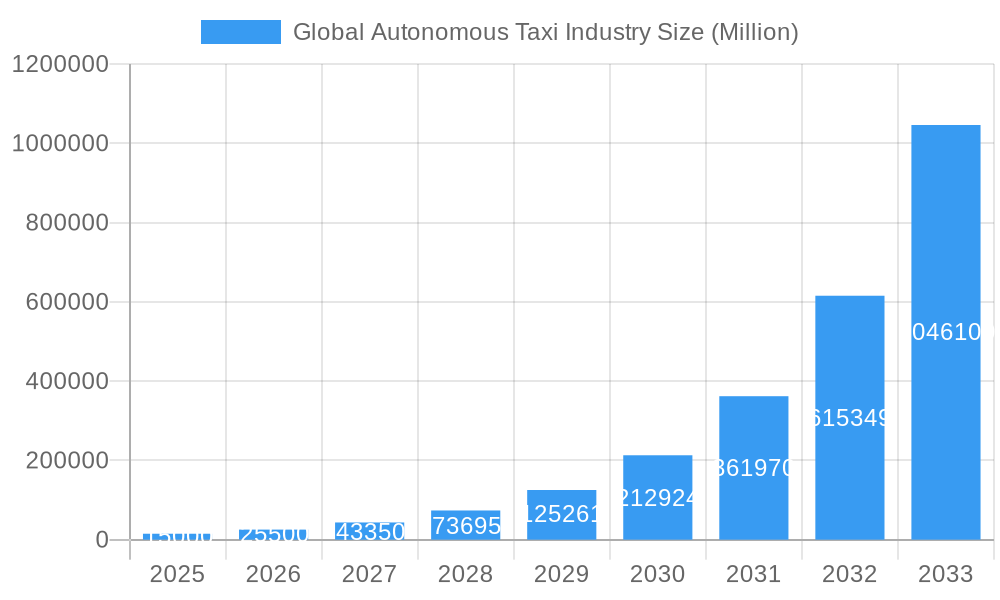
Global Autonomous Taxi Industry Market Size (In Million)
Continuous technological innovation, particularly in sensor fusion, artificial intelligence, and high-definition mapping, will further propel industry growth. Emerging business models, such as subscription services and integrated mobility platforms, will also shape market dynamics. While regulatory landscapes and public perception remain critical factors, the long-term outlook for the global autonomous taxi market is exceptionally strong, promising to revolutionize urban transportation and logistics. Strategic investments, continuous innovation, and collaborative partnerships will be paramount for success in this dynamic sector.
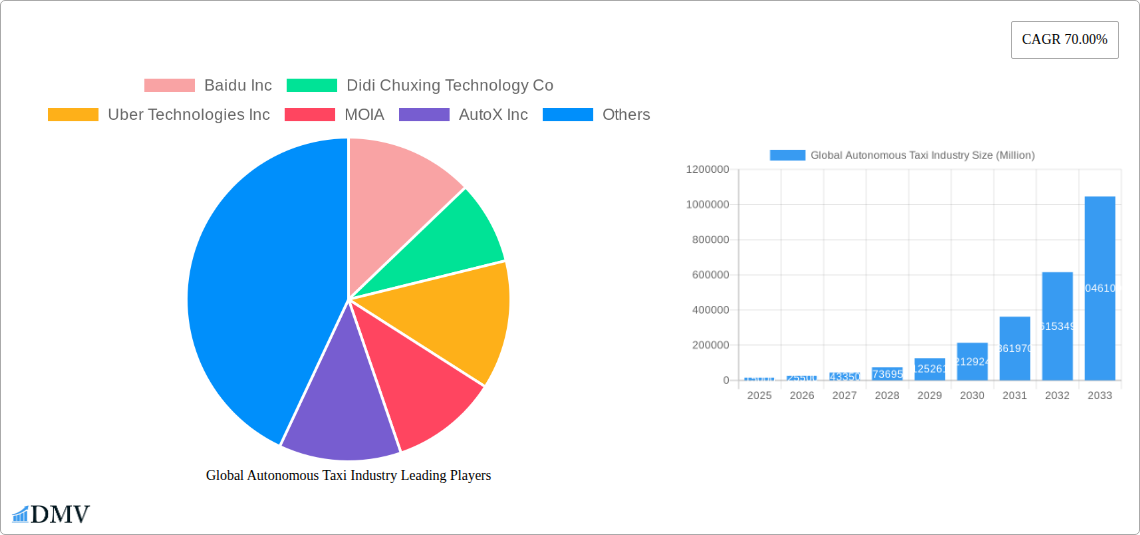
Global Autonomous Taxi Industry Company Market Share
Global Autonomous Taxi Industry Market Report: 2019-2033
This comprehensive report provides an in-depth analysis of the Global Autonomous Taxi Industry, offering invaluable insights for stakeholders seeking to navigate this rapidly evolving market. The study period covers 2019-2033, with a base year of 2025 and a forecast period of 2025-2033. We project a market valued at xx Million by 2025 and xx Million by 2033, representing substantial growth opportunities. This report meticulously examines market composition, technological advancements, leading players, and future trends, providing a crucial roadmap for informed decision-making.
Global Autonomous Taxi Industry Market Composition & Trends
This section dissects the competitive landscape, evaluating market concentration, innovation drivers, regulatory hurdles, substitute offerings, and end-user behavior. We analyze mergers and acquisitions (M&A) activities, including deal values and their impact on market share distribution. The industry exhibits a moderately concentrated structure with key players like Waymo, Cruise, and Baidu vying for market dominance. Innovation is heavily driven by advancements in AI, sensor technology (like Agro AI's 400-meter Lidar), and mapping capabilities. Stringent safety regulations and evolving data privacy laws significantly impact market entry and operations. The rise of ride-sharing apps and the potential for public transportation integration pose significant competitive pressures. M&A activity has been substantial, with deal values exceeding xx Million in the past five years, primarily focused on securing technological advantages and expanding geographical reach.
- Market Share Distribution (2024 Estimate): Waymo (xx%), Cruise (xx%), Baidu (xx%), Others (xx%).
- M&A Deal Value (2019-2024): xx Million
- Key Innovation Catalysts: AI, Sensor Technology, High-Definition Mapping.
- Regulatory Landscape: Stringent safety standards, data privacy regulations.
- Substitute Products: Traditional taxis, ride-sharing services, public transportation.
Global Autonomous Taxi Industry Industry Evolution
This section analyzes the market's growth trajectory, technological advancements, and evolving consumer preferences from 2019 to 2033. The autonomous taxi market has witnessed explosive growth, fueled by technological breakthroughs and increasing consumer demand for convenient and efficient transportation. We project a Compound Annual Growth Rate (CAGR) of xx% during the forecast period (2025-2033). The transition from lower levels of autonomy (Levels 2 and 3) to fully autonomous driving (Level 4 and 5) is a key driver of growth. This shift necessitates robust technological advancements in areas such as sensor fusion, object recognition, and decision-making algorithms. Consumer adoption is accelerating, driven by factors such as improved safety, reduced travel costs, and increased convenience. We project xx Million autonomous taxi trips by 2033.
Leading Regions, Countries, or Segments in Global Autonomous Taxi Industry
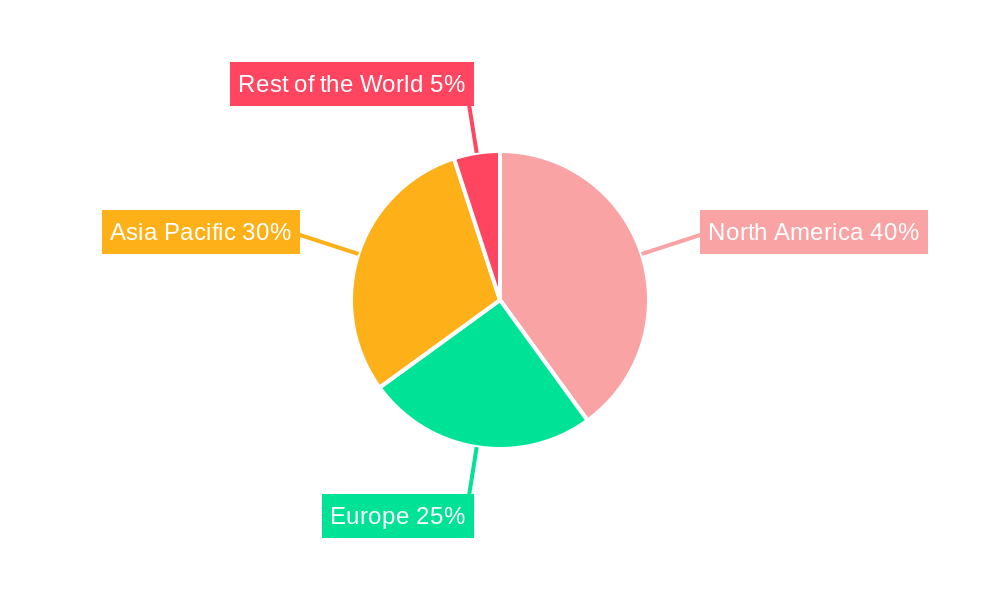
This section identifies dominant regions, countries, and market segments within the autonomous taxi industry. Based on our analysis, North America and China are currently leading the market, primarily due to higher investments in R&D and supportive regulatory frameworks. The rental-based service type dominates the market share currently. Electric vehicles represent the largest segment by propulsion type, owing to environmental concerns and technological maturity. Passenger transportation currently dominates the application segment.
- Key Drivers (North America): High levels of venture capital investment, strong technological infrastructure, supportive government policies.
- Key Drivers (China): Massive population density, significant government investment in autonomous vehicle development, large potential market.
- Dominant Service Type: Rental-Based
- Dominant Level of Autonomy (projected): Level 4
- Dominant Propulsion Type: Electric Vehicles
- Dominant Vehicle Type: Car
- Dominant Application: Passenger Transportation
Global Autonomous Taxi Industry Product Innovations
Recent years have witnessed a surge in product innovation within the autonomous taxi industry. Key advancements include the development of more robust sensor systems (e.g., Agro AI's advanced Lidar), improved mapping and localization techniques, and advancements in artificial intelligence for enhanced decision-making. These innovations lead to higher levels of safety, efficiency, and reliability, further accelerating consumer adoption and market growth. Unique selling propositions include features like enhanced safety systems, improved passenger comfort, and increased accessibility for individuals with disabilities (as exemplified by Waymo's recent initiatives).
Propelling Factors for Global Autonomous Taxi Industry Growth
Several key factors fuel the growth of the autonomous taxi industry. Technological advancements, particularly in AI and sensor technologies, are paramount. The economic benefits of reduced labor costs and increased operational efficiency attract significant investments. Supportive government policies and regulatory frameworks, including pilot programs and supportive legislation, also play a vital role.
Obstacles in the Global Autonomous Taxi Industry Market
Despite the significant growth potential, several obstacles hinder widespread adoption. Stringent safety regulations and liability issues pose significant challenges. Supply chain disruptions, particularly in the semiconductor industry, can limit production capacity. Intense competition among established players and emerging startups creates considerable market pressure.
Future Opportunities in Global Autonomous Taxi Industry
Significant opportunities lie ahead. Expansion into new geographical markets, particularly in developing economies with high population densities, offers substantial potential. Technological advancements, such as the integration of V2X communication and the development of more efficient and affordable autonomous systems, open new avenues for growth. Emerging consumer trends, such as the growing demand for sustainable transportation options, will continue to shape market demand.
Major Players in the Global Autonomous Taxi Industry Ecosystem
- Baidu Inc
- Didi Chuxing Technology Co
- Uber Technologies Inc
- MOIA
- AutoX Inc
- GM Cruise
- Tesla Inc
- Waymo LLC
- APTIV PLC
- EasyMile
- NAVYA SA
- AB Volvo
- ZF Friedrichshafen AG
Key Developments in Global Autonomous Taxi Industry Industry
- August 2022: Waymo LLC introduced accessibility features for visually impaired passengers.
- December 2021: AutoX Inc. launched a Level 4 RoboTaxi production facility in China.
- May 2021: Agro AI introduced a new long-range, high-resolution Lidar sensor.
Strategic Global Autonomous Taxi Industry Market Forecast
The global autonomous taxi industry is poised for substantial growth, driven by technological advancements, increasing consumer demand, and supportive regulatory environments. The market is expected to witness significant expansion in the coming years, creating lucrative opportunities for established players and new entrants alike. Continued innovation in areas such as AI, sensor technology, and battery technology will further accelerate market growth and redefine the future of transportation.
Global Autonomous Taxi Industry Segmentation
-
1. Level of Autonomy
- 1.1. Level 4
- 1.2. Level 5
-
2. Propulsion
- 2.1. Electric Vehicles
- 2.2. Hybrid Vehicles
- 2.3. Fuel Cell Electric Vehicles
-
3. Vehicle
- 3.1. Car
- 3.2. Van/Shuttle
-
4. Application
- 4.1. Passenger Transportation
- 4.2. Goods Transportation
-
5. Service Type
- 5.1. Rental-Based
- 5.2. Station-Based
Global Autonomous Taxi Industry Segmentation By Geography
-
1. North America
- 1.1. United States
- 1.2. Canada
- 1.3. Rest of North America
-
2. Europe
- 2.1. Germany
- 2.2. United Kingdom
- 2.3. France
- 2.4. Italy
- 2.5. Spain
- 2.6. Rest of Europe
-
3. Asia Pacific
- 3.1. China
- 3.2. Japan
- 3.3. India
- 3.4. Rest of Asia Pacific
-
4. Rest of the World
- 4.1. South America
- 4.2. Middle East and Africa
Global Autonomous Taxi Industry Regional Market Share
Geographic Coverage of Global Autonomous Taxi Industry
Global Autonomous Taxi Industry REPORT HIGHLIGHTS
| Aspects | Details |
|---|---|
| Study Period | 2020-2034 |
| Base Year | 2025 |
| Estimated Year | 2026 |
| Forecast Period | 2026-2034 |
| Historical Period | 2020-2025 |
| Growth Rate | CAGR of 99.1% from 2020-2034 |
| Segmentation |
|
Table of Contents
- 1. Introduction
- 1.1. Research Scope
- 1.2. Market Segmentation
- 1.3. Research Objective
- 1.4. Definitions and Assumptions
- 2. Executive Summary
- 2.1. Market Snapshot
- 3. Market Dynamics
- 3.1. Market Drivers
- 3.2. Market Restrains
- 3.3. Market Trends
- 3.4. Market Opportunities
- 4. Market Factor Analysis
- 4.1. Porters Five Forces
- 4.1.1. Bargaining Power of Suppliers
- 4.1.2. Bargaining Power of Buyers
- 4.1.3. Threat of New Entrants
- 4.1.4. Threat of Substitutes
- 4.1.5. Competitive Rivalry
- 4.2. PESTEL analysis
- 4.3. BCG Analysis
- 4.3.1. Stars (High Growth, High Market Share)
- 4.3.2. Cash Cows (Low Growth, High Market Share)
- 4.3.3. Question Mark (High Growth, Low Market Share)
- 4.3.4. Dogs (Low Growth, Low Market Share)
- 4.4. Ansoff Matrix Analysis
- 4.5. Supply Chain Analysis
- 4.6. Regulatory Landscape
- 4.7. Current Market Potential and Opportunity Assessment (TAM–SAM–SOM Framework)
- 4.8. DMV Analyst Note
- 4.1. Porters Five Forces
- 5. Market Analysis, Insights and Forecast 2021-2033
- 5.1. Market Analysis, Insights and Forecast - by Level of Autonomy
- 5.1.1. Level 4
- 5.1.2. Level 5
- 5.2. Market Analysis, Insights and Forecast - by Propulsion
- 5.2.1. Electric Vehicles
- 5.2.2. Hybrid Vehicles
- 5.2.3. Fuel Cell Electric Vehicles
- 5.3. Market Analysis, Insights and Forecast - by Vehicle
- 5.3.1. Car
- 5.3.2. Van/Shuttle
- 5.4. Market Analysis, Insights and Forecast - by Application
- 5.4.1. Passenger Transportation
- 5.4.2. Goods Transportation
- 5.5. Market Analysis, Insights and Forecast - by Service Type
- 5.5.1. Rental-Based
- 5.5.2. Station-Based
- 5.6. Market Analysis, Insights and Forecast - by Region
- 5.6.1. North America
- 5.6.2. Europe
- 5.6.3. Asia Pacific
- 5.6.4. Rest of the World
- 5.1. Market Analysis, Insights and Forecast - by Level of Autonomy
- 6. Global Autonomous Taxi Industry Analysis, Insights and Forecast, 2021-2033
- 6.1. Market Analysis, Insights and Forecast - by Level of Autonomy
- 6.1.1. Level 4
- 6.1.2. Level 5
- 6.2. Market Analysis, Insights and Forecast - by Propulsion
- 6.2.1. Electric Vehicles
- 6.2.2. Hybrid Vehicles
- 6.2.3. Fuel Cell Electric Vehicles
- 6.3. Market Analysis, Insights and Forecast - by Vehicle
- 6.3.1. Car
- 6.3.2. Van/Shuttle
- 6.4. Market Analysis, Insights and Forecast - by Application
- 6.4.1. Passenger Transportation
- 6.4.2. Goods Transportation
- 6.5. Market Analysis, Insights and Forecast - by Service Type
- 6.5.1. Rental-Based
- 6.5.2. Station-Based
- 6.1. Market Analysis, Insights and Forecast - by Level of Autonomy
- 7. North America Global Autonomous Taxi Industry Analysis, Insights and Forecast, 2020-2032
- 7.1. Market Analysis, Insights and Forecast - by Level of Autonomy
- 7.1.1. Level 4
- 7.1.2. Level 5
- 7.2. Market Analysis, Insights and Forecast - by Propulsion
- 7.2.1. Electric Vehicles
- 7.2.2. Hybrid Vehicles
- 7.2.3. Fuel Cell Electric Vehicles
- 7.3. Market Analysis, Insights and Forecast - by Vehicle
- 7.3.1. Car
- 7.3.2. Van/Shuttle
- 7.4. Market Analysis, Insights and Forecast - by Application
- 7.4.1. Passenger Transportation
- 7.4.2. Goods Transportation
- 7.5. Market Analysis, Insights and Forecast - by Service Type
- 7.5.1. Rental-Based
- 7.5.2. Station-Based
- 7.1. Market Analysis, Insights and Forecast - by Level of Autonomy
- 8. Europe Global Autonomous Taxi Industry Analysis, Insights and Forecast, 2020-2032
- 8.1. Market Analysis, Insights and Forecast - by Level of Autonomy
- 8.1.1. Level 4
- 8.1.2. Level 5
- 8.2. Market Analysis, Insights and Forecast - by Propulsion
- 8.2.1. Electric Vehicles
- 8.2.2. Hybrid Vehicles
- 8.2.3. Fuel Cell Electric Vehicles
- 8.3. Market Analysis, Insights and Forecast - by Vehicle
- 8.3.1. Car
- 8.3.2. Van/Shuttle
- 8.4. Market Analysis, Insights and Forecast - by Application
- 8.4.1. Passenger Transportation
- 8.4.2. Goods Transportation
- 8.5. Market Analysis, Insights and Forecast - by Service Type
- 8.5.1. Rental-Based
- 8.5.2. Station-Based
- 8.1. Market Analysis, Insights and Forecast - by Level of Autonomy
- 9. Asia Pacific Global Autonomous Taxi Industry Analysis, Insights and Forecast, 2020-2032
- 9.1. Market Analysis, Insights and Forecast - by Level of Autonomy
- 9.1.1. Level 4
- 9.1.2. Level 5
- 9.2. Market Analysis, Insights and Forecast - by Propulsion
- 9.2.1. Electric Vehicles
- 9.2.2. Hybrid Vehicles
- 9.2.3. Fuel Cell Electric Vehicles
- 9.3. Market Analysis, Insights and Forecast - by Vehicle
- 9.3.1. Car
- 9.3.2. Van/Shuttle
- 9.4. Market Analysis, Insights and Forecast - by Application
- 9.4.1. Passenger Transportation
- 9.4.2. Goods Transportation
- 9.5. Market Analysis, Insights and Forecast - by Service Type
- 9.5.1. Rental-Based
- 9.5.2. Station-Based
- 9.1. Market Analysis, Insights and Forecast - by Level of Autonomy
- 10. Rest of the World Global Autonomous Taxi Industry Analysis, Insights and Forecast, 2020-2032
- 10.1. Market Analysis, Insights and Forecast - by Level of Autonomy
- 10.1.1. Level 4
- 10.1.2. Level 5
- 10.2. Market Analysis, Insights and Forecast - by Propulsion
- 10.2.1. Electric Vehicles
- 10.2.2. Hybrid Vehicles
- 10.2.3. Fuel Cell Electric Vehicles
- 10.3. Market Analysis, Insights and Forecast - by Vehicle
- 10.3.1. Car
- 10.3.2. Van/Shuttle
- 10.4. Market Analysis, Insights and Forecast - by Application
- 10.4.1. Passenger Transportation
- 10.4.2. Goods Transportation
- 10.5. Market Analysis, Insights and Forecast - by Service Type
- 10.5.1. Rental-Based
- 10.5.2. Station-Based
- 10.1. Market Analysis, Insights and Forecast - by Level of Autonomy
- 11. Competitive Analysis
- 11.1. Company Profiles
- 11.1.1 Baidu Inc
- 11.1.1.1. Company Overview
- 11.1.1.2. Products
- 11.1.1.3. Company Financials
- 11.1.1.4. SWOT Analysis
- 11.1.2 Didi Chuxing Technology Co
- 11.1.2.1. Company Overview
- 11.1.2.2. Products
- 11.1.2.3. Company Financials
- 11.1.2.4. SWOT Analysis
- 11.1.3 Uber Technologies Inc
- 11.1.3.1. Company Overview
- 11.1.3.2. Products
- 11.1.3.3. Company Financials
- 11.1.3.4. SWOT Analysis
- 11.1.4 MOIA
- 11.1.4.1. Company Overview
- 11.1.4.2. Products
- 11.1.4.3. Company Financials
- 11.1.4.4. SWOT Analysis
- 11.1.5 AutoX Inc
- 11.1.5.1. Company Overview
- 11.1.5.2. Products
- 11.1.5.3. Company Financials
- 11.1.5.4. SWOT Analysis
- 11.1.6 GM Cruise
- 11.1.6.1. Company Overview
- 11.1.6.2. Products
- 11.1.6.3. Company Financials
- 11.1.6.4. SWOT Analysis
- 11.1.7 Tesla Inc *List Not Exhaustive
- 11.1.7.1. Company Overview
- 11.1.7.2. Products
- 11.1.7.3. Company Financials
- 11.1.7.4. SWOT Analysis
- 11.1.8 Waymo LLC
- 11.1.8.1. Company Overview
- 11.1.8.2. Products
- 11.1.8.3. Company Financials
- 11.1.8.4. SWOT Analysis
- 11.1.9 APTIV PLC
- 11.1.9.1. Company Overview
- 11.1.9.2. Products
- 11.1.9.3. Company Financials
- 11.1.9.4. SWOT Analysis
- 11.1.10 EasyMile
- 11.1.10.1. Company Overview
- 11.1.10.2. Products
- 11.1.10.3. Company Financials
- 11.1.10.4. SWOT Analysis
- 11.1.11 NAVYA SA
- 11.1.11.1. Company Overview
- 11.1.11.2. Products
- 11.1.11.3. Company Financials
- 11.1.11.4. SWOT Analysis
- 11.1.12 AB Volvo
- 11.1.12.1. Company Overview
- 11.1.12.2. Products
- 11.1.12.3. Company Financials
- 11.1.12.4. SWOT Analysis
- 11.1.13 ZF Friedrichshafen AG
- 11.1.13.1. Company Overview
- 11.1.13.2. Products
- 11.1.13.3. Company Financials
- 11.1.13.4. SWOT Analysis
- 11.1.1 Baidu Inc
- 11.2. Market Entropy
- 11.2.1 Company's Key Areas Served
- 11.2.2 Recent Developments
- 11.3. Company Market Share Analysis 2025
- 11.3.1 Top 5 Companies Market Share Analysis
- 11.3.2 Top 3 Companies Market Share Analysis
- 11.4. List of Potential Customers
- 12. Research Methodology
List of Figures
- Figure 1: Global Global Autonomous Taxi Industry Revenue Breakdown (billion, %) by Region 2025 & 2033
- Figure 2: North America Global Autonomous Taxi Industry Revenue (billion), by Level of Autonomy 2025 & 2033
- Figure 3: North America Global Autonomous Taxi Industry Revenue Share (%), by Level of Autonomy 2025 & 2033
- Figure 4: North America Global Autonomous Taxi Industry Revenue (billion), by Propulsion 2025 & 2033
- Figure 5: North America Global Autonomous Taxi Industry Revenue Share (%), by Propulsion 2025 & 2033
- Figure 6: North America Global Autonomous Taxi Industry Revenue (billion), by Vehicle 2025 & 2033
- Figure 7: North America Global Autonomous Taxi Industry Revenue Share (%), by Vehicle 2025 & 2033
- Figure 8: North America Global Autonomous Taxi Industry Revenue (billion), by Application 2025 & 2033
- Figure 9: North America Global Autonomous Taxi Industry Revenue Share (%), by Application 2025 & 2033
- Figure 10: North America Global Autonomous Taxi Industry Revenue (billion), by Service Type 2025 & 2033
- Figure 11: North America Global Autonomous Taxi Industry Revenue Share (%), by Service Type 2025 & 2033
- Figure 12: North America Global Autonomous Taxi Industry Revenue (billion), by Country 2025 & 2033
- Figure 13: North America Global Autonomous Taxi Industry Revenue Share (%), by Country 2025 & 2033
- Figure 14: Europe Global Autonomous Taxi Industry Revenue (billion), by Level of Autonomy 2025 & 2033
- Figure 15: Europe Global Autonomous Taxi Industry Revenue Share (%), by Level of Autonomy 2025 & 2033
- Figure 16: Europe Global Autonomous Taxi Industry Revenue (billion), by Propulsion 2025 & 2033
- Figure 17: Europe Global Autonomous Taxi Industry Revenue Share (%), by Propulsion 2025 & 2033
- Figure 18: Europe Global Autonomous Taxi Industry Revenue (billion), by Vehicle 2025 & 2033
- Figure 19: Europe Global Autonomous Taxi Industry Revenue Share (%), by Vehicle 2025 & 2033
- Figure 20: Europe Global Autonomous Taxi Industry Revenue (billion), by Application 2025 & 2033
- Figure 21: Europe Global Autonomous Taxi Industry Revenue Share (%), by Application 2025 & 2033
- Figure 22: Europe Global Autonomous Taxi Industry Revenue (billion), by Service Type 2025 & 2033
- Figure 23: Europe Global Autonomous Taxi Industry Revenue Share (%), by Service Type 2025 & 2033
- Figure 24: Europe Global Autonomous Taxi Industry Revenue (billion), by Country 2025 & 2033
- Figure 25: Europe Global Autonomous Taxi Industry Revenue Share (%), by Country 2025 & 2033
- Figure 26: Asia Pacific Global Autonomous Taxi Industry Revenue (billion), by Level of Autonomy 2025 & 2033
- Figure 27: Asia Pacific Global Autonomous Taxi Industry Revenue Share (%), by Level of Autonomy 2025 & 2033
- Figure 28: Asia Pacific Global Autonomous Taxi Industry Revenue (billion), by Propulsion 2025 & 2033
- Figure 29: Asia Pacific Global Autonomous Taxi Industry Revenue Share (%), by Propulsion 2025 & 2033
- Figure 30: Asia Pacific Global Autonomous Taxi Industry Revenue (billion), by Vehicle 2025 & 2033
- Figure 31: Asia Pacific Global Autonomous Taxi Industry Revenue Share (%), by Vehicle 2025 & 2033
- Figure 32: Asia Pacific Global Autonomous Taxi Industry Revenue (billion), by Application 2025 & 2033
- Figure 33: Asia Pacific Global Autonomous Taxi Industry Revenue Share (%), by Application 2025 & 2033
- Figure 34: Asia Pacific Global Autonomous Taxi Industry Revenue (billion), by Service Type 2025 & 2033
- Figure 35: Asia Pacific Global Autonomous Taxi Industry Revenue Share (%), by Service Type 2025 & 2033
- Figure 36: Asia Pacific Global Autonomous Taxi Industry Revenue (billion), by Country 2025 & 2033
- Figure 37: Asia Pacific Global Autonomous Taxi Industry Revenue Share (%), by Country 2025 & 2033
- Figure 38: Rest of the World Global Autonomous Taxi Industry Revenue (billion), by Level of Autonomy 2025 & 2033
- Figure 39: Rest of the World Global Autonomous Taxi Industry Revenue Share (%), by Level of Autonomy 2025 & 2033
- Figure 40: Rest of the World Global Autonomous Taxi Industry Revenue (billion), by Propulsion 2025 & 2033
- Figure 41: Rest of the World Global Autonomous Taxi Industry Revenue Share (%), by Propulsion 2025 & 2033
- Figure 42: Rest of the World Global Autonomous Taxi Industry Revenue (billion), by Vehicle 2025 & 2033
- Figure 43: Rest of the World Global Autonomous Taxi Industry Revenue Share (%), by Vehicle 2025 & 2033
- Figure 44: Rest of the World Global Autonomous Taxi Industry Revenue (billion), by Application 2025 & 2033
- Figure 45: Rest of the World Global Autonomous Taxi Industry Revenue Share (%), by Application 2025 & 2033
- Figure 46: Rest of the World Global Autonomous Taxi Industry Revenue (billion), by Service Type 2025 & 2033
- Figure 47: Rest of the World Global Autonomous Taxi Industry Revenue Share (%), by Service Type 2025 & 2033
- Figure 48: Rest of the World Global Autonomous Taxi Industry Revenue (billion), by Country 2025 & 2033
- Figure 49: Rest of the World Global Autonomous Taxi Industry Revenue Share (%), by Country 2025 & 2033
List of Tables
- Table 1: Global Autonomous Taxi Industry Revenue billion Forecast, by Level of Autonomy 2020 & 2033
- Table 2: Global Autonomous Taxi Industry Revenue billion Forecast, by Propulsion 2020 & 2033
- Table 3: Global Autonomous Taxi Industry Revenue billion Forecast, by Vehicle 2020 & 2033
- Table 4: Global Autonomous Taxi Industry Revenue billion Forecast, by Application 2020 & 2033
- Table 5: Global Autonomous Taxi Industry Revenue billion Forecast, by Service Type 2020 & 2033
- Table 6: Global Autonomous Taxi Industry Revenue billion Forecast, by Region 2020 & 2033
- Table 7: Global Autonomous Taxi Industry Revenue billion Forecast, by Level of Autonomy 2020 & 2033
- Table 8: Global Autonomous Taxi Industry Revenue billion Forecast, by Propulsion 2020 & 2033
- Table 9: Global Autonomous Taxi Industry Revenue billion Forecast, by Vehicle 2020 & 2033
- Table 10: Global Autonomous Taxi Industry Revenue billion Forecast, by Application 2020 & 2033
- Table 11: Global Autonomous Taxi Industry Revenue billion Forecast, by Service Type 2020 & 2033
- Table 12: Global Autonomous Taxi Industry Revenue billion Forecast, by Country 2020 & 2033
- Table 13: United States Global Autonomous Taxi Industry Revenue (billion) Forecast, by Application 2020 & 2033
- Table 14: Canada Global Autonomous Taxi Industry Revenue (billion) Forecast, by Application 2020 & 2033
- Table 15: Rest of North America Global Autonomous Taxi Industry Revenue (billion) Forecast, by Application 2020 & 2033
- Table 16: Global Autonomous Taxi Industry Revenue billion Forecast, by Level of Autonomy 2020 & 2033
- Table 17: Global Autonomous Taxi Industry Revenue billion Forecast, by Propulsion 2020 & 2033
- Table 18: Global Autonomous Taxi Industry Revenue billion Forecast, by Vehicle 2020 & 2033
- Table 19: Global Autonomous Taxi Industry Revenue billion Forecast, by Application 2020 & 2033
- Table 20: Global Autonomous Taxi Industry Revenue billion Forecast, by Service Type 2020 & 2033
- Table 21: Global Autonomous Taxi Industry Revenue billion Forecast, by Country 2020 & 2033
- Table 22: Germany Global Autonomous Taxi Industry Revenue (billion) Forecast, by Application 2020 & 2033
- Table 23: United Kingdom Global Autonomous Taxi Industry Revenue (billion) Forecast, by Application 2020 & 2033
- Table 24: France Global Autonomous Taxi Industry Revenue (billion) Forecast, by Application 2020 & 2033
- Table 25: Italy Global Autonomous Taxi Industry Revenue (billion) Forecast, by Application 2020 & 2033
- Table 26: Spain Global Autonomous Taxi Industry Revenue (billion) Forecast, by Application 2020 & 2033
- Table 27: Rest of Europe Global Autonomous Taxi Industry Revenue (billion) Forecast, by Application 2020 & 2033
- Table 28: Global Autonomous Taxi Industry Revenue billion Forecast, by Level of Autonomy 2020 & 2033
- Table 29: Global Autonomous Taxi Industry Revenue billion Forecast, by Propulsion 2020 & 2033
- Table 30: Global Autonomous Taxi Industry Revenue billion Forecast, by Vehicle 2020 & 2033
- Table 31: Global Autonomous Taxi Industry Revenue billion Forecast, by Application 2020 & 2033
- Table 32: Global Autonomous Taxi Industry Revenue billion Forecast, by Service Type 2020 & 2033
- Table 33: Global Autonomous Taxi Industry Revenue billion Forecast, by Country 2020 & 2033
- Table 34: China Global Autonomous Taxi Industry Revenue (billion) Forecast, by Application 2020 & 2033
- Table 35: Japan Global Autonomous Taxi Industry Revenue (billion) Forecast, by Application 2020 & 2033
- Table 36: India Global Autonomous Taxi Industry Revenue (billion) Forecast, by Application 2020 & 2033
- Table 37: Rest of Asia Pacific Global Autonomous Taxi Industry Revenue (billion) Forecast, by Application 2020 & 2033
- Table 38: Global Autonomous Taxi Industry Revenue billion Forecast, by Level of Autonomy 2020 & 2033
- Table 39: Global Autonomous Taxi Industry Revenue billion Forecast, by Propulsion 2020 & 2033
- Table 40: Global Autonomous Taxi Industry Revenue billion Forecast, by Vehicle 2020 & 2033
- Table 41: Global Autonomous Taxi Industry Revenue billion Forecast, by Application 2020 & 2033
- Table 42: Global Autonomous Taxi Industry Revenue billion Forecast, by Service Type 2020 & 2033
- Table 43: Global Autonomous Taxi Industry Revenue billion Forecast, by Country 2020 & 2033
- Table 44: South America Global Autonomous Taxi Industry Revenue (billion) Forecast, by Application 2020 & 2033
- Table 45: Middle East and Africa Global Autonomous Taxi Industry Revenue (billion) Forecast, by Application 2020 & 2033
Frequently Asked Questions
1. What is the projected Compound Annual Growth Rate (CAGR) of the Global Autonomous Taxi Industry?
The projected CAGR is approximately 99.1%.
2. Which companies are prominent players in the Global Autonomous Taxi Industry?
Key companies in the market include Baidu Inc, Didi Chuxing Technology Co, Uber Technologies Inc, MOIA, AutoX Inc, GM Cruise, Tesla Inc *List Not Exhaustive, Waymo LLC, APTIV PLC, EasyMile, NAVYA SA, AB Volvo, ZF Friedrichshafen AG.
3. What are the main segments of the Global Autonomous Taxi Industry?
The market segments include Level of Autonomy, Propulsion, Vehicle, Application, Service Type.
4. Can you provide details about the market size?
The market size is estimated to be USD 0.61 billion as of 2022.
5. What are some drivers contributing to market growth?
Increase in Leisure Activities in the Country.
6. What are the notable trends driving market growth?
Robo-Taxis Are Attracting People Around the World.
7. Are there any restraints impacting market growth?
Strict Vehicle Emission Regulations.
8. Can you provide examples of recent developments in the market?
In August 2022, Waymo LLC introduced new features designed to make its fleet of autonomous taxis more accessible to passengers with visual impairments and other disabilities.
9. What pricing options are available for accessing the report?
Pricing options include single-user, multi-user, and enterprise licenses priced at USD 4750, USD 5250, and USD 8750 respectively.
10. Is the market size provided in terms of value or volume?
The market size is provided in terms of value, measured in billion.
11. Are there any specific market keywords associated with the report?
Yes, the market keyword associated with the report is "Global Autonomous Taxi Industry," which aids in identifying and referencing the specific market segment covered.
12. How do I determine which pricing option suits my needs best?
The pricing options vary based on user requirements and access needs. Individual users may opt for single-user licenses, while businesses requiring broader access may choose multi-user or enterprise licenses for cost-effective access to the report.
13. Are there any additional resources or data provided in the Global Autonomous Taxi Industry report?
While the report offers comprehensive insights, it's advisable to review the specific contents or supplementary materials provided to ascertain if additional resources or data are available.
14. How can I stay updated on further developments or reports in the Global Autonomous Taxi Industry?
To stay informed about further developments, trends, and reports in the Global Autonomous Taxi Industry, consider subscribing to industry newsletters, following relevant companies and organizations, or regularly checking reputable industry news sources and publications.
Methodology
Step 1 - Identification of Relevant Samples Size from Population Database


Step 2 - Approaches for Defining Global Market Size (Value, Volume* & Price*)

Note*: In applicable scenarios
Step 3 - Data Sources
Primary Research
- Web Analytics
- Survey Reports
- Research Institute
- Latest Research Reports
- Opinion Leaders
Secondary Research
- Annual Reports
- White Paper
- Latest Press Release
- Industry Association
- Paid Database
- Investor Presentations

Step 4 - Data Triangulation
Involves using different sources of information in order to increase the validity of a study
These sources are likely to be stakeholders in a program - participants, other researchers, program staff, other community members, and so on.
Then we put all data in single framework & apply various statistical tools to find out the dynamic on the market.
During the analysis stage, feedback from the stakeholder groups would be compared to determine areas of agreement as well as areas of divergence