

Key Insights
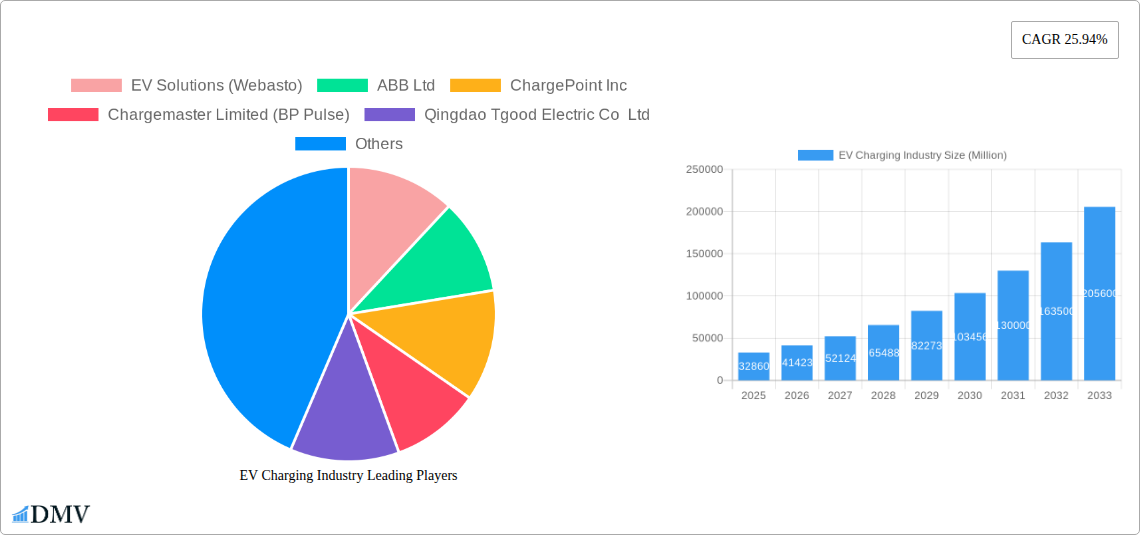
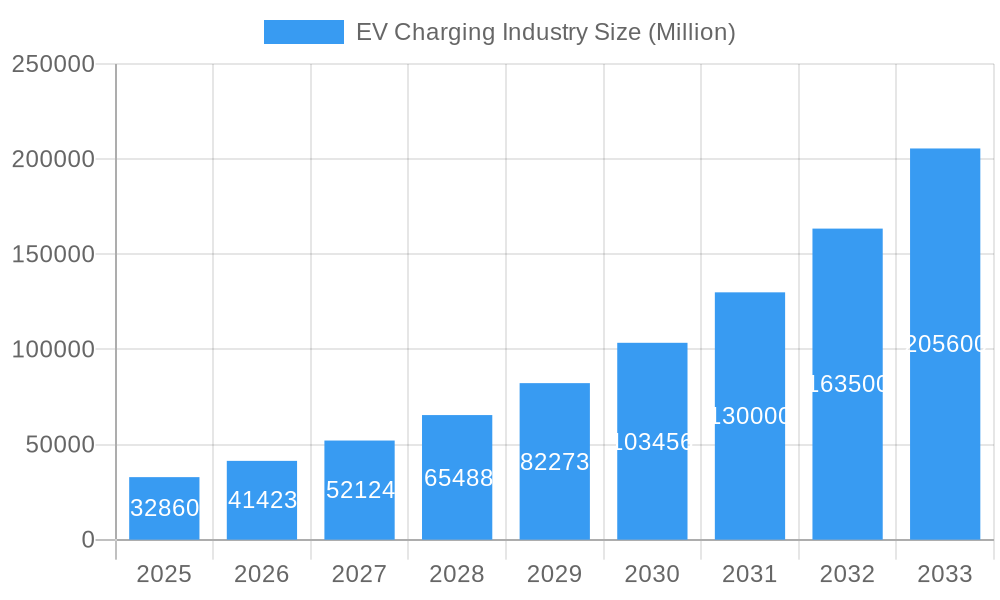
The global EV charging market is experiencing explosive growth, projected to reach \$32.86 billion in 2025 and maintain a robust Compound Annual Growth Rate (CAGR) of 25.94% from 2025 to 2033. This surge is driven by several key factors: the accelerating adoption of electric vehicles (EVs) worldwide spurred by government incentives, environmental concerns, and technological advancements in battery technology; the expansion of charging infrastructure, including both public and private charging stations, catering to diverse vehicle types (passenger cars and commercial vehicles); and the increasing availability of various charging solutions such as AC and DC charging stations, battery swapping services, and different charging infrastructure standards (CHAdeMO, CCS, GB/T, Tesla Superchargers). The market segmentation reveals significant opportunities across different charging types, ownership models, and geographic regions. North America and Europe currently hold substantial market share, fueled by early EV adoption and supportive government policies. However, the Asia-Pacific region, particularly China and India, presents immense untapped potential due to their rapidly growing EV markets and ambitious infrastructure development plans.
EV Charging Industry Market Size (In Billion)
The market's growth trajectory is further influenced by continuous technological innovation resulting in faster charging speeds, increased charging station efficiency, and improved battery technology. However, challenges remain, including the uneven distribution of charging stations, particularly in rural areas, and the need for substantial investment in grid infrastructure to accommodate the rising electricity demand. Addressing these challenges through strategic public-private partnerships and technological advancements will be crucial for realizing the full potential of the EV charging market. The competitive landscape is characterized by a mix of established players like ABB, Siemens, and Schneider Electric, alongside emerging innovative companies specializing in charging solutions and technology. The ongoing consolidation and strategic partnerships within the industry are expected to reshape the market dynamics in the coming years, leading to further innovation and market expansion.
EV Charging Industry Company Market Share
EV Charging Industry Market Report: 2019-2033
This comprehensive report provides an in-depth analysis of the global EV charging industry, offering valuable insights for stakeholders seeking to navigate this rapidly evolving market. The report covers the period from 2019 to 2033, with a focus on the forecast period of 2025-2033 and a base year of 2025. The market is analyzed across various segments, including charger type, ownership, service type, infrastructure type, and vehicle type, offering a 360-degree view of this dynamic sector. The report's findings are supported by robust data analysis and industry expert opinions, making it an indispensable resource for investment decisions and strategic planning. Expect to find detailed analysis of key players like Tesla Motors Inc, ABB Ltd, and ChargePoint Inc., among others, contributing to the expected market value of xx Million by 2033.
EV Charging Industry Market Composition & Trends
The global EV charging market is experiencing robust growth, driven by increasing EV adoption and supportive government policies. Market concentration is moderate, with several major players and numerous smaller regional players. Innovation is a key catalyst, with continuous advancements in charging technology, including faster charging speeds and improved energy efficiency. The regulatory landscape varies across regions, influencing deployment strategies and market dynamics. Substitute products are limited, mainly focusing on alternative fuel vehicles, but EVs maintain a strong competitive advantage due to their environmental benefits and technological advancements. End-users comprise a diverse group, including residential consumers, businesses, and public institutions. M&A activity has been significant, with deal values totaling xx Million in the last five years, reflecting industry consolidation and the pursuit of enhanced market share.
- Market Share Distribution (2024): Tesla Motors Inc. xx%, ABB Ltd. xx%, ChargePoint Inc. xx%, Others xx%.
- M&A Deal Values (2019-2024): xx Million
- Key Innovation Catalysts: High-power charging, smart charging technologies, battery swapping services.
- Significant M&A Activities: The acquisition of The Newmotion BV by Shell highlights the strategic importance of charging infrastructure.
EV Charging Industry Industry Evolution
The EV charging industry has witnessed exponential growth since 2019, with a Compound Annual Growth Rate (CAGR) of xx% during the historical period (2019-2024) and a projected CAGR of xx% during the forecast period (2025-2033). This expansion is primarily fueled by rising EV sales, expanding charging infrastructure, and increasing government incentives. Technological advancements, such as the introduction of ultra-fast charging stations and improved battery technologies, have further accelerated market growth. Consumer demand for convenient and reliable charging solutions is shaping market trends, driving the expansion of public charging networks and the development of sophisticated smart charging applications. By 2033, the market is projected to reach xx Million in value, demonstrating the significant potential of this sector. Adoption of EV charging is highest in regions with strong government support, coupled with existing robust power grid infrastructure.
Leading Regions, Countries, or Segments in EV Charging Industry
The dominance in the EV charging industry varies across segments.
- By Charger Type: DC fast charging stations are experiencing faster growth compared to AC charging stations due to their reduced charging times. The global market for DC fast chargers is projected to reach xx Million by 2033.
- By Charging Ownership Type: Public charging networks are expanding rapidly, driven by government support and increasing demand for charging accessibility. The public charging segment is expected to constitute xx% of the total market by 2033, valued at xx Million.
- By Charging Service Type: EV charging services account for a significant share of the market, while battery swapping services are still emerging and have a lower market penetration.
- By Charging Infrastructure Type: CCS and GB/T fast charge standards are gaining traction, alongside Tesla Superchargers which continue to dominate the market in several regions. The combined market for CCS and GB/T fast charging infrastructure is projected to reach xx Million by 2033.
- By Vehicle Type: Passenger cars currently dominate the EV charging market, but the segment for commercial vehicles is expected to see significant growth in the coming years.
Key Drivers:
- Investment Trends: Significant investments from both public and private sectors are fueling the expansion of charging infrastructure.
- Regulatory Support: Government policies and incentives are playing a crucial role in driving EV adoption and supporting the development of charging infrastructure.
EV Charging Industry Product Innovations
Recent innovations in the EV charging industry include the introduction of high-power charging stations (like EVBox Troniq High Power's 400 kW capacity), smart charging technologies that optimize energy usage and grid integration, and battery swapping solutions for faster charging turnaround. These advancements enhance charging speed, efficiency, and user experience, driving market growth and addressing consumer concerns. Unique selling propositions center around increased charging speeds, enhanced reliability, and smart grid integration capabilities.
Propelling Factors for EV Charging Industry Growth
Several factors are propelling the growth of the EV charging industry. Firstly, increasing electric vehicle sales globally are creating a substantial demand for charging infrastructure. Secondly, supportive government policies and regulations, including subsidies and tax incentives for EV adoption, are crucial in fostering industry growth. Thirdly, technological advancements in charging technologies, including faster charging speeds and enhanced energy efficiency, are enhancing the overall user experience. Fourthly, expanding public charging networks, providing greater convenience for EV owners, is further boosting market expansion. Finally, rising environmental concerns and the need for reduced carbon emissions are significantly contributing to the growing popularity of electric vehicles and thus the need for a robust charging infrastructure.
Obstacles in the EV Charging Industry Market
The EV charging industry faces several obstacles. High upfront investment costs for installing charging stations can deter development, particularly in underserved areas. Interoperability issues among different charging standards pose a significant challenge, creating inconsistencies and user inconvenience. Supply chain disruptions in the manufacturing and deployment of charging equipment can lead to delays and increased costs. Finally, intense competition among various players in the market can impact profit margins and profitability.
Future Opportunities in EV Charging Industry
Future opportunities lie in the expansion of charging infrastructure into underserved regions, the development of advanced charging technologies such as wireless charging and vehicle-to-grid (V2G) technology, and the integration of renewable energy sources into charging networks. The emergence of new business models, like charging-as-a-service, and the growth of the commercial vehicle segment also present significant growth potentials.
Major Players in the EV Charging Industry Ecosystem
- EV Solutions (Webasto)
- ABB Ltd
- ChargePoint Inc
- Chargemaster Limited (BP Pulse)
- Qingdao Tgood Electric Co Ltd
- Leviton Manufacturing Co Inc
- BYD Company
- Siemens AG
- Schneider Electric SE
- EFACEC Power Solutions SGPS
- Evbox (ENGIE)
- Wanbang Digital Energy Pte Ltd (Star Charge)
- Tesla Motors Inc
- SemaConnect Inc
Key Developments in EV Charging Industry Industry
- June 2023: Stellantis launched Free2move Charge, a comprehensive charging and energy management ecosystem.
- June 2023: Circontrol introduced the Genion One, enabling EV charging with 100% green energy.
- June 2023: EVBox unveiled the EVBox Troniq High Power, a 400 kW charging station.
- March 2023: 7-Eleven launched 7Charge, its proprietary EV charging network.
These developments demonstrate the ongoing innovation and expansion within the EV charging industry, enhancing charging capabilities and user experience. The increased competition further enhances product development and drives down costs.
Strategic EV Charging Industry Market Forecast
The future of the EV charging industry is bright, driven by continued growth in EV adoption, supportive government policies, and ongoing technological advancements. The market is poised for significant expansion, with a projected value of xx Million by 2033. New charging technologies, expanding charging networks, and innovative business models will play a key role in shaping the industry's future. The increasing focus on sustainability and the integration of renewable energy sources into charging infrastructure will also contribute to the sector's growth and sustainability.
EV Charging Industry Segmentation
-
1. Vehicle Type
- 1.1. Passenger Cars
- 1.2. Commercial Vehicles
-
2. Charger Type
- 2.1. AC Charging Station
- 2.2. DC Charging Station
-
3. Charging Ownership Type
- 3.1. Public
- 3.2. Private
-
4. Charging Service Type
- 4.1. EV Charging Services
- 4.2. Battery Swapping Services
-
5. Charging Infrastructure Type
- 5.1. Chademo
- 5.2. CCS
- 5.3. GB/T Fast Charge
- 5.4. Tesla Superchargers
- 5.5. Other Charging Infrastructure Types
EV Charging Industry Segmentation By Geography
-
1. North America
- 1.1. United States
- 1.2. Canada
- 1.3. Rest of North America
-
2. Europe
- 2.1. Germany
- 2.2. United Kingdom
- 2.3. France
- 2.4. Italy
- 2.5. Rest of Europe
-
3. Asia Pacific
- 3.1. China
- 3.2. Japan
- 3.3. India
- 3.4. South Korea
- 3.5. Rest of Asia Pacific
-
4. Rest of the World
- 4.1. South America
- 4.2. Middle East and Africa

EV Charging Industry Regional Market Share
Geographic Coverage of EV Charging Industry
EV Charging Industry REPORT HIGHLIGHTS
| Aspects | Details |
|---|---|
| Study Period | 2020-2034 |
| Base Year | 2025 |
| Estimated Year | 2026 |
| Forecast Period | 2026-2034 |
| Historical Period | 2020-2025 |
| Growth Rate | CAGR of 25.94% from 2020-2034 |
| Segmentation |
|
Table of Contents
- 1. Introduction
- 1.1. Research Scope
- 1.2. Market Segmentation
- 1.3. Research Objective
- 1.4. Definitions and Assumptions
- 2. Executive Summary
- 2.1. Market Snapshot
- 3. Market Dynamics
- 3.1. Market Drivers
- 3.2. Market Restrains
- 3.3. Market Trends
- 3.4. Market Opportunities
- 4. Market Factor Analysis
- 4.1. Porters Five Forces
- 4.1.1. Bargaining Power of Suppliers
- 4.1.2. Bargaining Power of Buyers
- 4.1.3. Threat of New Entrants
- 4.1.4. Threat of Substitutes
- 4.1.5. Competitive Rivalry
- 4.2. PESTEL analysis
- 4.3. BCG Analysis
- 4.3.1. Stars (High Growth, High Market Share)
- 4.3.2. Cash Cows (Low Growth, High Market Share)
- 4.3.3. Question Mark (High Growth, Low Market Share)
- 4.3.4. Dogs (Low Growth, Low Market Share)
- 4.4. Ansoff Matrix Analysis
- 4.5. Supply Chain Analysis
- 4.6. Regulatory Landscape
- 4.7. Current Market Potential and Opportunity Assessment (TAM–SAM–SOM Framework)
- 4.8. DMV Analyst Note
- 4.1. Porters Five Forces
- 5. Market Analysis, Insights and Forecast 2021-2033
- 5.1. Market Analysis, Insights and Forecast - by Vehicle Type
- 5.1.1. Passenger Cars
- 5.1.2. Commercial Vehicles
- 5.2. Market Analysis, Insights and Forecast - by Charger Type
- 5.2.1. AC Charging Station
- 5.2.2. DC Charging Station
- 5.3. Market Analysis, Insights and Forecast - by Charging Ownership Type
- 5.3.1. Public
- 5.3.2. Private
- 5.4. Market Analysis, Insights and Forecast - by Charging Service Type
- 5.4.1. EV Charging Services
- 5.4.2. Battery Swapping Services
- 5.5. Market Analysis, Insights and Forecast - by Charging Infrastructure Type
- 5.5.1. Chademo
- 5.5.2. CCS
- 5.5.3. GB/T Fast Charge
- 5.5.4. Tesla Superchargers
- 5.5.5. Other Charging Infrastructure Types
- 5.6. Market Analysis, Insights and Forecast - by Region
- 5.6.1. North America
- 5.6.2. Europe
- 5.6.3. Asia Pacific
- 5.6.4. Rest of the World
- 5.1. Market Analysis, Insights and Forecast - by Vehicle Type
- 6. Global EV Charging Industry Analysis, Insights and Forecast, 2021-2033
- 6.1. Market Analysis, Insights and Forecast - by Vehicle Type
- 6.1.1. Passenger Cars
- 6.1.2. Commercial Vehicles
- 6.2. Market Analysis, Insights and Forecast - by Charger Type
- 6.2.1. AC Charging Station
- 6.2.2. DC Charging Station
- 6.3. Market Analysis, Insights and Forecast - by Charging Ownership Type
- 6.3.1. Public
- 6.3.2. Private
- 6.4. Market Analysis, Insights and Forecast - by Charging Service Type
- 6.4.1. EV Charging Services
- 6.4.2. Battery Swapping Services
- 6.5. Market Analysis, Insights and Forecast - by Charging Infrastructure Type
- 6.5.1. Chademo
- 6.5.2. CCS
- 6.5.3. GB/T Fast Charge
- 6.5.4. Tesla Superchargers
- 6.5.5. Other Charging Infrastructure Types
- 6.1. Market Analysis, Insights and Forecast - by Vehicle Type
- 7. North America EV Charging Industry Analysis, Insights and Forecast, 2020-2032
- 7.1. Market Analysis, Insights and Forecast - by Vehicle Type
- 7.1.1. Passenger Cars
- 7.1.2. Commercial Vehicles
- 7.2. Market Analysis, Insights and Forecast - by Charger Type
- 7.2.1. AC Charging Station
- 7.2.2. DC Charging Station
- 7.3. Market Analysis, Insights and Forecast - by Charging Ownership Type
- 7.3.1. Public
- 7.3.2. Private
- 7.4. Market Analysis, Insights and Forecast - by Charging Service Type
- 7.4.1. EV Charging Services
- 7.4.2. Battery Swapping Services
- 7.5. Market Analysis, Insights and Forecast - by Charging Infrastructure Type
- 7.5.1. Chademo
- 7.5.2. CCS
- 7.5.3. GB/T Fast Charge
- 7.5.4. Tesla Superchargers
- 7.5.5. Other Charging Infrastructure Types
- 7.1. Market Analysis, Insights and Forecast - by Vehicle Type
- 8. Europe EV Charging Industry Analysis, Insights and Forecast, 2020-2032
- 8.1. Market Analysis, Insights and Forecast - by Vehicle Type
- 8.1.1. Passenger Cars
- 8.1.2. Commercial Vehicles
- 8.2. Market Analysis, Insights and Forecast - by Charger Type
- 8.2.1. AC Charging Station
- 8.2.2. DC Charging Station
- 8.3. Market Analysis, Insights and Forecast - by Charging Ownership Type
- 8.3.1. Public
- 8.3.2. Private
- 8.4. Market Analysis, Insights and Forecast - by Charging Service Type
- 8.4.1. EV Charging Services
- 8.4.2. Battery Swapping Services
- 8.5. Market Analysis, Insights and Forecast - by Charging Infrastructure Type
- 8.5.1. Chademo
- 8.5.2. CCS
- 8.5.3. GB/T Fast Charge
- 8.5.4. Tesla Superchargers
- 8.5.5. Other Charging Infrastructure Types
- 8.1. Market Analysis, Insights and Forecast - by Vehicle Type
- 9. Asia Pacific EV Charging Industry Analysis, Insights and Forecast, 2020-2032
- 9.1. Market Analysis, Insights and Forecast - by Vehicle Type
- 9.1.1. Passenger Cars
- 9.1.2. Commercial Vehicles
- 9.2. Market Analysis, Insights and Forecast - by Charger Type
- 9.2.1. AC Charging Station
- 9.2.2. DC Charging Station
- 9.3. Market Analysis, Insights and Forecast - by Charging Ownership Type
- 9.3.1. Public
- 9.3.2. Private
- 9.4. Market Analysis, Insights and Forecast - by Charging Service Type
- 9.4.1. EV Charging Services
- 9.4.2. Battery Swapping Services
- 9.5. Market Analysis, Insights and Forecast - by Charging Infrastructure Type
- 9.5.1. Chademo
- 9.5.2. CCS
- 9.5.3. GB/T Fast Charge
- 9.5.4. Tesla Superchargers
- 9.5.5. Other Charging Infrastructure Types
- 9.1. Market Analysis, Insights and Forecast - by Vehicle Type
- 10. Rest of the World EV Charging Industry Analysis, Insights and Forecast, 2020-2032
- 10.1. Market Analysis, Insights and Forecast - by Vehicle Type
- 10.1.1. Passenger Cars
- 10.1.2. Commercial Vehicles
- 10.2. Market Analysis, Insights and Forecast - by Charger Type
- 10.2.1. AC Charging Station
- 10.2.2. DC Charging Station
- 10.3. Market Analysis, Insights and Forecast - by Charging Ownership Type
- 10.3.1. Public
- 10.3.2. Private
- 10.4. Market Analysis, Insights and Forecast - by Charging Service Type
- 10.4.1. EV Charging Services
- 10.4.2. Battery Swapping Services
- 10.5. Market Analysis, Insights and Forecast - by Charging Infrastructure Type
- 10.5.1. Chademo
- 10.5.2. CCS
- 10.5.3. GB/T Fast Charge
- 10.5.4. Tesla Superchargers
- 10.5.5. Other Charging Infrastructure Types
- 10.1. Market Analysis, Insights and Forecast - by Vehicle Type
- 11. Competitive Analysis
- 11.1. Company Profiles
- 11.1.1 EV Solutions (Webasto)
- 11.1.1.1. Company Overview
- 11.1.1.2. Products
- 11.1.1.3. Company Financials
- 11.1.1.4. SWOT Analysis
- 11.1.2 ABB Ltd
- 11.1.2.1. Company Overview
- 11.1.2.2. Products
- 11.1.2.3. Company Financials
- 11.1.2.4. SWOT Analysis
- 11.1.3 ChargePoint Inc
- 11.1.3.1. Company Overview
- 11.1.3.2. Products
- 11.1.3.3. Company Financials
- 11.1.3.4. SWOT Analysis
- 11.1.4 Chargemaster Limited (BP Pulse)
- 11.1.4.1. Company Overview
- 11.1.4.2. Products
- 11.1.4.3. Company Financials
- 11.1.4.4. SWOT Analysis
- 11.1.5 Qingdao Tgood Electric Co Ltd
- 11.1.5.1. Company Overview
- 11.1.5.2. Products
- 11.1.5.3. Company Financials
- 11.1.5.4. SWOT Analysis
- 11.1.6 Leviton Manufacturing Co Inc
- 11.1.6.1. Company Overview
- 11.1.6.2. Products
- 11.1.6.3. Company Financials
- 11.1.6.4. SWOT Analysis
- 11.1.7 BYD Company
- 11.1.7.1. Company Overview
- 11.1.7.2. Products
- 11.1.7.3. Company Financials
- 11.1.7.4. SWOT Analysis
- 11.1.8 Siemens AG
- 11.1.8.1. Company Overview
- 11.1.8.2. Products
- 11.1.8.3. Company Financials
- 11.1.8.4. SWOT Analysis
- 11.1.9 Schneider Electric SE
- 11.1.9.1. Company Overview
- 11.1.9.2. Products
- 11.1.9.3. Company Financials
- 11.1.9.4. SWOT Analysis
- 11.1.10 EFACEC Power Solutions SGPS
- 11.1.10.1. Company Overview
- 11.1.10.2. Products
- 11.1.10.3. Company Financials
- 11.1.10.4. SWOT Analysis
- 11.1.11 Evbox (ENGIE)
- 11.1.11.1. Company Overview
- 11.1.11.2. Products
- 11.1.11.3. Company Financials
- 11.1.11.4. SWOT Analysis
- 11.1.12 Wanbang Digital Energy Pte Ltd (Star Charge
- 11.1.12.1. Company Overview
- 11.1.12.2. Products
- 11.1.12.3. Company Financials
- 11.1.12.4. SWOT Analysis
- 11.1.13 Tesla Motors Inc
- 11.1.13.1. Company Overview
- 11.1.13.2. Products
- 11.1.13.3. Company Financials
- 11.1.13.4. SWOT Analysis
- 11.1.14 SemaConnect Inc
- 11.1.14.1. Company Overview
- 11.1.14.2. Products
- 11.1.14.3. Company Financials
- 11.1.14.4. SWOT Analysis
- 11.1.15 The Newmotion BV (Acquired by Shell)
- 11.1.15.1. Company Overview
- 11.1.15.2. Products
- 11.1.15.3. Company Financials
- 11.1.15.4. SWOT Analysis
- 11.1.1 EV Solutions (Webasto)
- 11.2. Market Entropy
- 11.2.1 Company's Key Areas Served
- 11.2.2 Recent Developments
- 11.3. Company Market Share Analysis 2025
- 11.3.1 Top 5 Companies Market Share Analysis
- 11.3.2 Top 3 Companies Market Share Analysis
- 11.4. List of Potential Customers
- 12. Research Methodology
List of Figures
- Figure 1: Global EV Charging Industry Revenue Breakdown (Million, %) by Region 2025 & 2033
- Figure 2: North America EV Charging Industry Revenue (Million), by Vehicle Type 2025 & 2033
- Figure 3: North America EV Charging Industry Revenue Share (%), by Vehicle Type 2025 & 2033
- Figure 4: North America EV Charging Industry Revenue (Million), by Charger Type 2025 & 2033
- Figure 5: North America EV Charging Industry Revenue Share (%), by Charger Type 2025 & 2033
- Figure 6: North America EV Charging Industry Revenue (Million), by Charging Ownership Type 2025 & 2033
- Figure 7: North America EV Charging Industry Revenue Share (%), by Charging Ownership Type 2025 & 2033
- Figure 8: North America EV Charging Industry Revenue (Million), by Charging Service Type 2025 & 2033
- Figure 9: North America EV Charging Industry Revenue Share (%), by Charging Service Type 2025 & 2033
- Figure 10: North America EV Charging Industry Revenue (Million), by Charging Infrastructure Type 2025 & 2033
- Figure 11: North America EV Charging Industry Revenue Share (%), by Charging Infrastructure Type 2025 & 2033
- Figure 12: North America EV Charging Industry Revenue (Million), by Country 2025 & 2033
- Figure 13: North America EV Charging Industry Revenue Share (%), by Country 2025 & 2033
- Figure 14: Europe EV Charging Industry Revenue (Million), by Vehicle Type 2025 & 2033
- Figure 15: Europe EV Charging Industry Revenue Share (%), by Vehicle Type 2025 & 2033
- Figure 16: Europe EV Charging Industry Revenue (Million), by Charger Type 2025 & 2033
- Figure 17: Europe EV Charging Industry Revenue Share (%), by Charger Type 2025 & 2033
- Figure 18: Europe EV Charging Industry Revenue (Million), by Charging Ownership Type 2025 & 2033
- Figure 19: Europe EV Charging Industry Revenue Share (%), by Charging Ownership Type 2025 & 2033
- Figure 20: Europe EV Charging Industry Revenue (Million), by Charging Service Type 2025 & 2033
- Figure 21: Europe EV Charging Industry Revenue Share (%), by Charging Service Type 2025 & 2033
- Figure 22: Europe EV Charging Industry Revenue (Million), by Charging Infrastructure Type 2025 & 2033
- Figure 23: Europe EV Charging Industry Revenue Share (%), by Charging Infrastructure Type 2025 & 2033
- Figure 24: Europe EV Charging Industry Revenue (Million), by Country 2025 & 2033
- Figure 25: Europe EV Charging Industry Revenue Share (%), by Country 2025 & 2033
- Figure 26: Asia Pacific EV Charging Industry Revenue (Million), by Vehicle Type 2025 & 2033
- Figure 27: Asia Pacific EV Charging Industry Revenue Share (%), by Vehicle Type 2025 & 2033
- Figure 28: Asia Pacific EV Charging Industry Revenue (Million), by Charger Type 2025 & 2033
- Figure 29: Asia Pacific EV Charging Industry Revenue Share (%), by Charger Type 2025 & 2033
- Figure 30: Asia Pacific EV Charging Industry Revenue (Million), by Charging Ownership Type 2025 & 2033
- Figure 31: Asia Pacific EV Charging Industry Revenue Share (%), by Charging Ownership Type 2025 & 2033
- Figure 32: Asia Pacific EV Charging Industry Revenue (Million), by Charging Service Type 2025 & 2033
- Figure 33: Asia Pacific EV Charging Industry Revenue Share (%), by Charging Service Type 2025 & 2033
- Figure 34: Asia Pacific EV Charging Industry Revenue (Million), by Charging Infrastructure Type 2025 & 2033
- Figure 35: Asia Pacific EV Charging Industry Revenue Share (%), by Charging Infrastructure Type 2025 & 2033
- Figure 36: Asia Pacific EV Charging Industry Revenue (Million), by Country 2025 & 2033
- Figure 37: Asia Pacific EV Charging Industry Revenue Share (%), by Country 2025 & 2033
- Figure 38: Rest of the World EV Charging Industry Revenue (Million), by Vehicle Type 2025 & 2033
- Figure 39: Rest of the World EV Charging Industry Revenue Share (%), by Vehicle Type 2025 & 2033
- Figure 40: Rest of the World EV Charging Industry Revenue (Million), by Charger Type 2025 & 2033
- Figure 41: Rest of the World EV Charging Industry Revenue Share (%), by Charger Type 2025 & 2033
- Figure 42: Rest of the World EV Charging Industry Revenue (Million), by Charging Ownership Type 2025 & 2033
- Figure 43: Rest of the World EV Charging Industry Revenue Share (%), by Charging Ownership Type 2025 & 2033
- Figure 44: Rest of the World EV Charging Industry Revenue (Million), by Charging Service Type 2025 & 2033
- Figure 45: Rest of the World EV Charging Industry Revenue Share (%), by Charging Service Type 2025 & 2033
- Figure 46: Rest of the World EV Charging Industry Revenue (Million), by Charging Infrastructure Type 2025 & 2033
- Figure 47: Rest of the World EV Charging Industry Revenue Share (%), by Charging Infrastructure Type 2025 & 2033
- Figure 48: Rest of the World EV Charging Industry Revenue (Million), by Country 2025 & 2033
- Figure 49: Rest of the World EV Charging Industry Revenue Share (%), by Country 2025 & 2033
List of Tables
- Table 1: Global EV Charging Industry Revenue Million Forecast, by Vehicle Type 2020 & 2033
- Table 2: Global EV Charging Industry Revenue Million Forecast, by Charger Type 2020 & 2033
- Table 3: Global EV Charging Industry Revenue Million Forecast, by Charging Ownership Type 2020 & 2033
- Table 4: Global EV Charging Industry Revenue Million Forecast, by Charging Service Type 2020 & 2033
- Table 5: Global EV Charging Industry Revenue Million Forecast, by Charging Infrastructure Type 2020 & 2033
- Table 6: Global EV Charging Industry Revenue Million Forecast, by Region 2020 & 2033
- Table 7: Global EV Charging Industry Revenue Million Forecast, by Vehicle Type 2020 & 2033
- Table 8: Global EV Charging Industry Revenue Million Forecast, by Charger Type 2020 & 2033
- Table 9: Global EV Charging Industry Revenue Million Forecast, by Charging Ownership Type 2020 & 2033
- Table 10: Global EV Charging Industry Revenue Million Forecast, by Charging Service Type 2020 & 2033
- Table 11: Global EV Charging Industry Revenue Million Forecast, by Charging Infrastructure Type 2020 & 2033
- Table 12: Global EV Charging Industry Revenue Million Forecast, by Country 2020 & 2033
- Table 13: United States EV Charging Industry Revenue (Million) Forecast, by Application 2020 & 2033
- Table 14: Canada EV Charging Industry Revenue (Million) Forecast, by Application 2020 & 2033
- Table 15: Rest of North America EV Charging Industry Revenue (Million) Forecast, by Application 2020 & 2033
- Table 16: Global EV Charging Industry Revenue Million Forecast, by Vehicle Type 2020 & 2033
- Table 17: Global EV Charging Industry Revenue Million Forecast, by Charger Type 2020 & 2033
- Table 18: Global EV Charging Industry Revenue Million Forecast, by Charging Ownership Type 2020 & 2033
- Table 19: Global EV Charging Industry Revenue Million Forecast, by Charging Service Type 2020 & 2033
- Table 20: Global EV Charging Industry Revenue Million Forecast, by Charging Infrastructure Type 2020 & 2033
- Table 21: Global EV Charging Industry Revenue Million Forecast, by Country 2020 & 2033
- Table 22: Germany EV Charging Industry Revenue (Million) Forecast, by Application 2020 & 2033
- Table 23: United Kingdom EV Charging Industry Revenue (Million) Forecast, by Application 2020 & 2033
- Table 24: France EV Charging Industry Revenue (Million) Forecast, by Application 2020 & 2033
- Table 25: Italy EV Charging Industry Revenue (Million) Forecast, by Application 2020 & 2033
- Table 26: Rest of Europe EV Charging Industry Revenue (Million) Forecast, by Application 2020 & 2033
- Table 27: Global EV Charging Industry Revenue Million Forecast, by Vehicle Type 2020 & 2033
- Table 28: Global EV Charging Industry Revenue Million Forecast, by Charger Type 2020 & 2033
- Table 29: Global EV Charging Industry Revenue Million Forecast, by Charging Ownership Type 2020 & 2033
- Table 30: Global EV Charging Industry Revenue Million Forecast, by Charging Service Type 2020 & 2033
- Table 31: Global EV Charging Industry Revenue Million Forecast, by Charging Infrastructure Type 2020 & 2033
- Table 32: Global EV Charging Industry Revenue Million Forecast, by Country 2020 & 2033
- Table 33: China EV Charging Industry Revenue (Million) Forecast, by Application 2020 & 2033
- Table 34: Japan EV Charging Industry Revenue (Million) Forecast, by Application 2020 & 2033
- Table 35: India EV Charging Industry Revenue (Million) Forecast, by Application 2020 & 2033
- Table 36: South Korea EV Charging Industry Revenue (Million) Forecast, by Application 2020 & 2033
- Table 37: Rest of Asia Pacific EV Charging Industry Revenue (Million) Forecast, by Application 2020 & 2033
- Table 38: Global EV Charging Industry Revenue Million Forecast, by Vehicle Type 2020 & 2033
- Table 39: Global EV Charging Industry Revenue Million Forecast, by Charger Type 2020 & 2033
- Table 40: Global EV Charging Industry Revenue Million Forecast, by Charging Ownership Type 2020 & 2033
- Table 41: Global EV Charging Industry Revenue Million Forecast, by Charging Service Type 2020 & 2033
- Table 42: Global EV Charging Industry Revenue Million Forecast, by Charging Infrastructure Type 2020 & 2033
- Table 43: Global EV Charging Industry Revenue Million Forecast, by Country 2020 & 2033
- Table 44: South America EV Charging Industry Revenue (Million) Forecast, by Application 2020 & 2033
- Table 45: Middle East and Africa EV Charging Industry Revenue (Million) Forecast, by Application 2020 & 2033
Frequently Asked Questions
1. What is the projected Compound Annual Growth Rate (CAGR) of the EV Charging Industry?
The projected CAGR is approximately 25.94%.
2. Which companies are prominent players in the EV Charging Industry?
Key companies in the market include EV Solutions (Webasto), ABB Ltd, ChargePoint Inc, Chargemaster Limited (BP Pulse), Qingdao Tgood Electric Co Ltd, Leviton Manufacturing Co Inc, BYD Company, Siemens AG, Schneider Electric SE, EFACEC Power Solutions SGPS, Evbox (ENGIE), Wanbang Digital Energy Pte Ltd (Star Charge, Tesla Motors Inc, SemaConnect Inc, The Newmotion BV (Acquired by Shell).
3. What are the main segments of the EV Charging Industry?
The market segments include Vehicle Type, Charger Type, Charging Ownership Type, Charging Service Type, Charging Infrastructure Type.
4. Can you provide details about the market size?
The market size is estimated to be USD 32.86 Million as of 2022.
5. What are some drivers contributing to market growth?
Rising EV Sales and Decreasing EV Prices are Driving the Market.
6. What are the notable trends driving market growth?
Passenger Cars are Leading the Electric Vehicle Charging Station Market.
7. Are there any restraints impacting market growth?
High Initial Cost of Installing and Maintaining a Standard EV Charging Station is a Challenge.
8. Can you provide examples of recent developments in the market?
June 2023: Stellantis introduced Free2move Charge, a comprehensive ecosystem that provides seamless charging and energy management solutions for electric vehicle (EV) customers. This holistic approach caters to EV needs across various scenarios, including home charging, business charging, and on-the-go charging. The initiative is overseen by the newly established Stellantis Charging & Energy Business Unit, emphasizing Stellantis’s commitment to supporting the growing EV market.
9. What pricing options are available for accessing the report?
Pricing options include single-user, multi-user, and enterprise licenses priced at USD 4750, USD 5250, and USD 8750 respectively.
10. Is the market size provided in terms of value or volume?
The market size is provided in terms of value, measured in Million.
11. Are there any specific market keywords associated with the report?
Yes, the market keyword associated with the report is "EV Charging Industry," which aids in identifying and referencing the specific market segment covered.
12. How do I determine which pricing option suits my needs best?
The pricing options vary based on user requirements and access needs. Individual users may opt for single-user licenses, while businesses requiring broader access may choose multi-user or enterprise licenses for cost-effective access to the report.
13. Are there any additional resources or data provided in the EV Charging Industry report?
While the report offers comprehensive insights, it's advisable to review the specific contents or supplementary materials provided to ascertain if additional resources or data are available.
14. How can I stay updated on further developments or reports in the EV Charging Industry?
To stay informed about further developments, trends, and reports in the EV Charging Industry, consider subscribing to industry newsletters, following relevant companies and organizations, or regularly checking reputable industry news sources and publications.
Methodology
Step 1 - Identification of Relevant Samples Size from Population Database


Step 2 - Approaches for Defining Global Market Size (Value, Volume* & Price*)

Note*: In applicable scenarios
Step 3 - Data Sources
Primary Research
- Web Analytics
- Survey Reports
- Research Institute
- Latest Research Reports
- Opinion Leaders
Secondary Research
- Annual Reports
- White Paper
- Latest Press Release
- Industry Association
- Paid Database
- Investor Presentations

Step 4 - Data Triangulation
Involves using different sources of information in order to increase the validity of a study
These sources are likely to be stakeholders in a program - participants, other researchers, program staff, other community members, and so on.
Then we put all data in single framework & apply various statistical tools to find out the dynamic on the market.
During the analysis stage, feedback from the stakeholder groups would be compared to determine areas of agreement as well as areas of divergence