

Key Insights
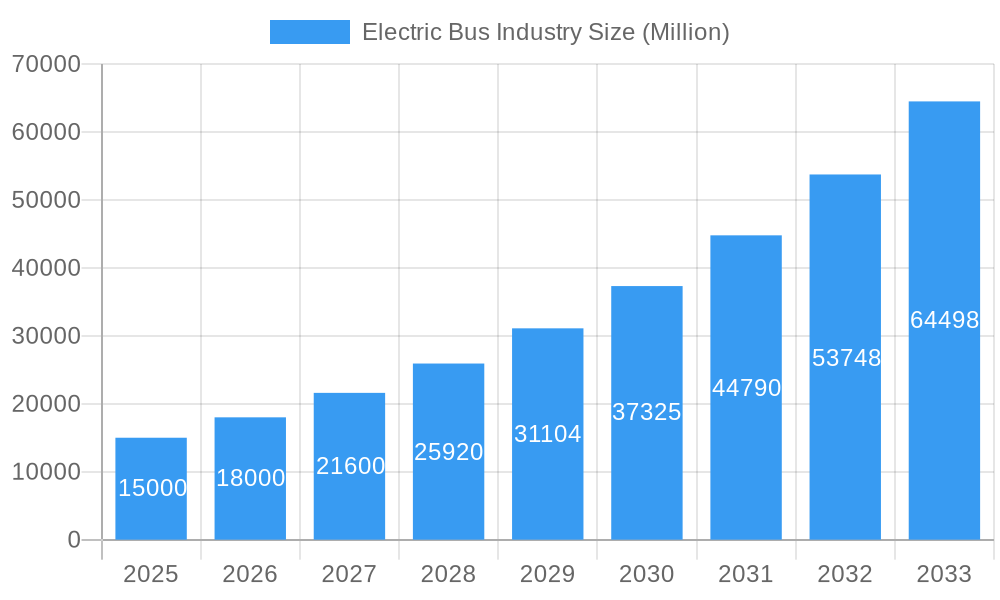
The global electric bus market is poised for substantial expansion, driven by stringent environmental regulations, escalating urban air quality concerns, and supportive government initiatives promoting sustainable transit. The market, currently valued at $44.81 billion, is projected to grow at a Compound Annual Growth Rate (CAGR) of 15.3% from a base year of 2025 through 2033. This growth is underpinned by advancements in battery technology, leading to enhanced range and faster charging, alongside declining electric bus costs and the rise of smart city initiatives prioritizing electric mobility. Market segmentation includes Battery Electric Vehicles (BEVs), Fuel Cell Electric Vehicles (FCEVs), Hybrid Electric Vehicles (HEVs), and Plug-in Hybrid Electric Vehicles (PHEVs), showcasing a diverse technological evolution. While BEVs currently lead due to maturity and cost-effectiveness, FCEVs are emerging as a key long-term solution, particularly for extended routes. The competitive landscape features established automotive giants and dedicated electric bus manufacturers, with key players like Ashok Leyland, BYD, and Daimler actively investing in R&D and portfolio expansion.
Electric Bus Industry Market Size (In Billion)
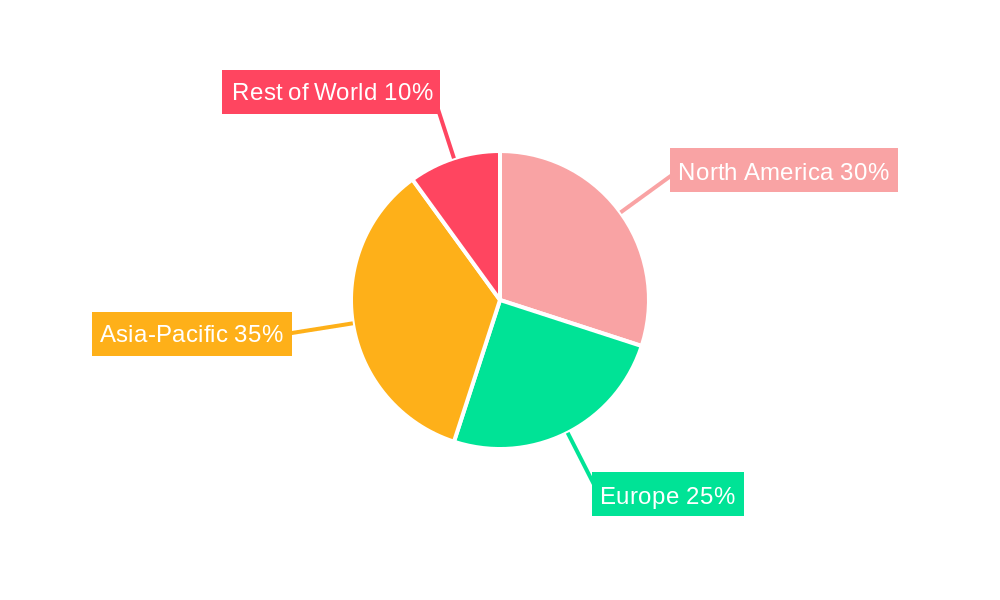
Geographically, North America and Europe lead adoption, while Asia-Pacific demonstrates rapid growth fueled by public transportation investments and emission reduction targets. Government policies, including subsidies, tax incentives, and electric fleet mandates, are shaping market dynamics. Key challenges persist, such as high initial infrastructure costs, battery lifespan concerns, charging availability, and grid capacity requirements. Nevertheless, continuous technological innovation and favorable government support are accelerating the electric bus market's growth, championing sustainable global transportation solutions.
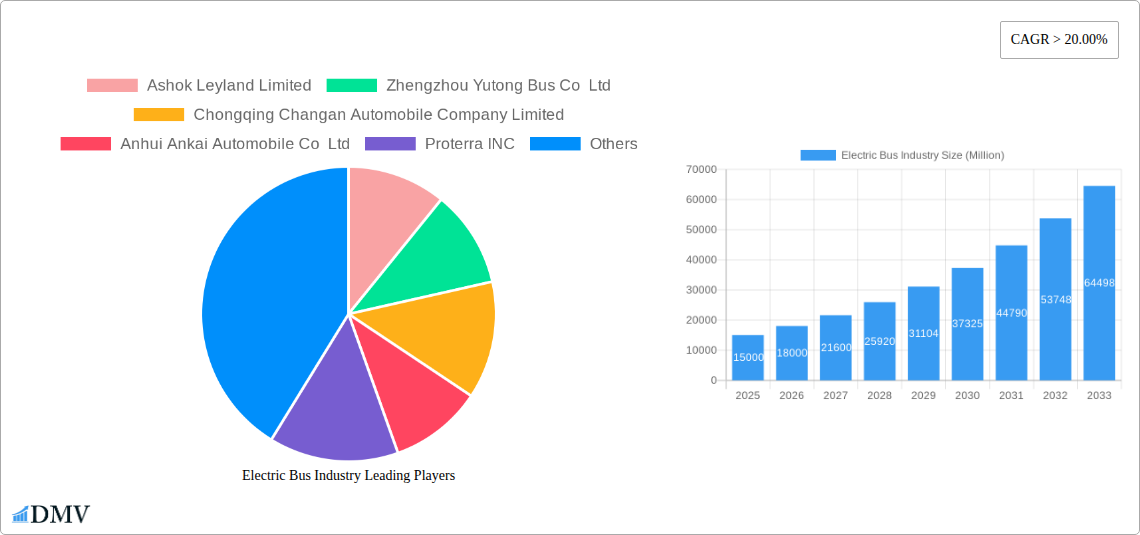
Electric Bus Industry Company Market Share
Electric Bus Industry Market Report: 2019-2033
This comprehensive report provides an in-depth analysis of the global electric bus industry, projecting a market value exceeding xx Million by 2033. The study covers the period 2019-2033, with a base year of 2025 and a forecast period of 2025-2033, offering invaluable insights for stakeholders across the value chain. This report meticulously examines market trends, technological advancements, key players, and future opportunities within the rapidly evolving electric bus sector.
Electric Bus Industry Market Composition & Trends
The global electric bus market is characterized by increasing competition, with several key players vying for market share. Market concentration is moderate, with a few dominant players and a growing number of smaller, specialized companies. Innovation is driven by advancements in battery technology, charging infrastructure, and vehicle design, leading to improved range, efficiency, and passenger comfort. Stringent emission regulations globally are a key catalyst, pushing adoption. Substitute products include traditional diesel and CNG buses, but their market share is declining due to environmental concerns and economic incentives for electric adoption. End-users primarily include public transit authorities, private fleet operators, and educational institutions. M&A activity is significant, with deal values exceeding xx Million in the last five years, consolidating the industry and driving technological integration.
- Market Share Distribution (2024): BYD Auto Industry Company Limited (xx%), Proterra INC (xx%), Tata Motors Limited (xx%), others (xx%).
- M&A Deal Value (2019-2024): xx Million
- Key Innovation Catalysts: Battery technology advancements, autonomous driving features, smart charging solutions.
- Regulatory Landscape: Stringent emission norms in many countries, government subsidies and incentives.
Electric Bus Industry Industry Evolution
The electric bus industry has witnessed remarkable growth since 2019, driven by a confluence of factors including rising environmental concerns, government regulations promoting sustainable transportation, and technological advancements that have improved the performance and cost-effectiveness of electric buses. The market has transitioned from a niche segment to a significant player in the broader bus industry. We project a Compound Annual Growth Rate (CAGR) of xx% from 2025 to 2033, reflecting the continued adoption of electric buses globally. This growth is fueled by increasing demand from urban areas facing traffic congestion and air pollution challenges. Technological advancements, particularly in battery technology and charging infrastructure, are playing a crucial role in driving down the total cost of ownership (TCO) for electric buses, making them increasingly competitive with traditional diesel buses. Consumer demand for sustainable transportation is further bolstering the industry's expansion. The adoption rate is significantly higher in developed regions with supportive policies and infrastructure.
Leading Regions, Countries, or Segments in Electric Bus Industry
China currently dominates the global electric bus market, driven by strong government support, a large public transportation network, and a thriving domestic manufacturing base. Within fuel categories, Battery Electric Vehicles (BEVs) represent the largest segment, holding over xx% of the market share in 2024.
Key Drivers for China's Dominance:
- Massive government investments in electric vehicle infrastructure and subsidies.
- Stringent emission regulations driving the adoption of clean transportation.
- Strong domestic manufacturing capabilities and a competitive supply chain.
BEV Segment Dominance:
- Lower initial cost compared to FCEVs.
- Mature technology and widespread charging infrastructure.
- Continuous improvement in battery range and performance.
Other significant regions: Europe and North America are also witnessing significant growth, fueled by government incentives and increasing environmental awareness.
Electric Bus Industry Product Innovations
Recent innovations in electric buses include advanced battery technologies offering increased range and faster charging times, improved energy management systems, and the integration of smart features such as real-time monitoring and predictive maintenance capabilities. These innovations enhance operational efficiency, reduce downtime, and improve the overall passenger experience. Unique selling propositions now include enhanced safety features, comfortable interiors, and reduced noise pollution.
Propelling Factors for Electric Bus Industry Growth
Several factors are driving the growth of the electric bus industry. Technological advancements, especially in battery technology, have significantly improved the range, lifespan, and charging speed of electric buses, making them more viable alternatives to traditional buses. Government regulations aimed at reducing emissions in urban areas are pushing the adoption of electric buses by providing subsidies and incentives. The falling cost of batteries and the increasing availability of charging infrastructure further contribute to the growth of the market.
Obstacles in the Electric Bus Industry Market
The electric bus market faces challenges including the high upfront cost of electric buses compared to traditional buses, the limited range of some electric buses, and the lack of sufficient charging infrastructure in some regions. Supply chain disruptions impacting battery production and other components create fluctuations in availability and pricing. Competition from established bus manufacturers offering hybrid or traditional fuel buses can also influence market growth.
Future Opportunities in Electric Bus Industry
Future opportunities lie in the expansion of the electric bus market into emerging economies, the development of advanced battery technologies offering extended range and faster charging, and the integration of autonomous driving features into electric buses. The growth of smart city initiatives presents significant potential for increased adoption, along with the development of integrated public transport systems. Exploring new materials and manufacturing processes can further drive down costs and improve performance.
Major Players in the Electric Bus Industry Ecosystem
- Ashok Leyland Limited
- Zhengzhou Yutong Bus Co Ltd
- Chongqing Changan Automobile Company Limited
- Anhui Ankai Automobile Co Ltd
- Proterra INC
- Tata Motors Limited
- Daimler Truck Holding AG
- Volvo Group
- Zhejiang Geely Holding Group Co Ltd
- CRRC Electric Vehicle Co Ltd
- NFI Group Inc
- King Long United Automotive Industry Co Ltd
- Byd Auto Industry Company Limited
- Zhongtong Bus Holding Co Ltd
- Chery Automobile Co Ltd
Key Developments in Electric Bus Industry Industry
- December 2023: Proterra announced its new EV battery factory in South Carolina, signaling increased production capacity to meet growing demand for commercial electric vehicles. This development strengthens the supply chain and supports the industry's growth trajectory.
- November 2023: Switch Mobility's partnership with JSW for electric buses in India highlights the increasing adoption of electric buses in emerging markets and the collaboration between major players in the industry to expand their presence.
- September 2023: Daimler Buses' launch of the next-generation Setra coaches showcases ongoing innovation and advancements in electric bus technology, focusing on safety, cost-efficiency, and versatility. This launch strengthens Daimler's market position and provides a competitive edge.
Strategic Electric Bus Industry Market Forecast
The electric bus industry is poised for significant growth in the coming years. Continued technological advancements, supportive government policies, and rising environmental awareness will drive market expansion. New markets in developing countries will offer immense potential, as will innovations in battery technology, charging infrastructure, and autonomous driving capabilities. The projected CAGR for the forecast period indicates a substantial market expansion, presenting significant opportunities for both established players and new entrants.
Electric Bus Industry Segmentation
-
1. Fuel Category
- 1.1. BEV
- 1.2. FCEV
- 1.3. HEV
- 1.4. PHEV
Electric Bus Industry Segmentation By Geography
-
1. North America
- 1.1. United States
- 1.2. Canada
- 1.3. Mexico
-
2. South America
- 2.1. Brazil
- 2.2. Argentina
- 2.3. Rest of South America
-
3. Europe
- 3.1. United Kingdom
- 3.2. Germany
- 3.3. France
- 3.4. Italy
- 3.5. Spain
- 3.6. Russia
- 3.7. Benelux
- 3.8. Nordics
- 3.9. Rest of Europe
-
4. Middle East & Africa
- 4.1. Turkey
- 4.2. Israel
- 4.3. GCC
- 4.4. North Africa
- 4.5. South Africa
- 4.6. Rest of Middle East & Africa
-
5. Asia Pacific
- 5.1. China
- 5.2. India
- 5.3. Japan
- 5.4. South Korea
- 5.5. ASEAN
- 5.6. Oceania
- 5.7. Rest of Asia Pacific
Electric Bus Industry Regional Market Share
Geographic Coverage of Electric Bus Industry
Electric Bus Industry REPORT HIGHLIGHTS
| Aspects | Details |
|---|---|
| Study Period | 2020-2034 |
| Base Year | 2025 |
| Estimated Year | 2026 |
| Forecast Period | 2026-2034 |
| Historical Period | 2020-2025 |
| Growth Rate | CAGR of 15.3% from 2020-2034 |
| Segmentation |
|
Table of Contents
- 1. Introduction
- 1.1. Research Scope
- 1.2. Market Segmentation
- 1.3. Research Objective
- 1.4. Definitions and Assumptions
- 2. Executive Summary
- 2.1. Market Snapshot
- 3. Market Dynamics
- 3.1. Market Drivers
- 3.2. Market Restrains
- 3.3. Market Trends
- 3.4. Market Opportunities
- 4. Market Factor Analysis
- 4.1. Porters Five Forces
- 4.1.1. Bargaining Power of Suppliers
- 4.1.2. Bargaining Power of Buyers
- 4.1.3. Threat of New Entrants
- 4.1.4. Threat of Substitutes
- 4.1.5. Competitive Rivalry
- 4.2. PESTEL analysis
- 4.3. BCG Analysis
- 4.3.1. Stars (High Growth, High Market Share)
- 4.3.2. Cash Cows (Low Growth, High Market Share)
- 4.3.3. Question Mark (High Growth, Low Market Share)
- 4.3.4. Dogs (Low Growth, Low Market Share)
- 4.4. Ansoff Matrix Analysis
- 4.5. Supply Chain Analysis
- 4.6. Regulatory Landscape
- 4.7. Current Market Potential and Opportunity Assessment (TAM–SAM–SOM Framework)
- 4.8. DMV Analyst Note
- 4.1. Porters Five Forces
- 5. Market Analysis, Insights and Forecast 2021-2033
- 5.1. Market Analysis, Insights and Forecast - by Fuel Category
- 5.1.1. BEV
- 5.1.2. FCEV
- 5.1.3. HEV
- 5.1.4. PHEV
- 5.2. Market Analysis, Insights and Forecast - by Region
- 5.2.1. North America
- 5.2.2. South America
- 5.2.3. Europe
- 5.2.4. Middle East & Africa
- 5.2.5. Asia Pacific
- 5.1. Market Analysis, Insights and Forecast - by Fuel Category
- 6. Global Electric Bus Industry Analysis, Insights and Forecast, 2021-2033
- 6.1. Market Analysis, Insights and Forecast - by Fuel Category
- 6.1.1. BEV
- 6.1.2. FCEV
- 6.1.3. HEV
- 6.1.4. PHEV
- 6.1. Market Analysis, Insights and Forecast - by Fuel Category
- 7. North America Electric Bus Industry Analysis, Insights and Forecast, 2020-2032
- 7.1. Market Analysis, Insights and Forecast - by Fuel Category
- 7.1.1. BEV
- 7.1.2. FCEV
- 7.1.3. HEV
- 7.1.4. PHEV
- 7.1. Market Analysis, Insights and Forecast - by Fuel Category
- 8. South America Electric Bus Industry Analysis, Insights and Forecast, 2020-2032
- 8.1. Market Analysis, Insights and Forecast - by Fuel Category
- 8.1.1. BEV
- 8.1.2. FCEV
- 8.1.3. HEV
- 8.1.4. PHEV
- 8.1. Market Analysis, Insights and Forecast - by Fuel Category
- 9. Europe Electric Bus Industry Analysis, Insights and Forecast, 2020-2032
- 9.1. Market Analysis, Insights and Forecast - by Fuel Category
- 9.1.1. BEV
- 9.1.2. FCEV
- 9.1.3. HEV
- 9.1.4. PHEV
- 9.1. Market Analysis, Insights and Forecast - by Fuel Category
- 10. Middle East & Africa Electric Bus Industry Analysis, Insights and Forecast, 2020-2032
- 10.1. Market Analysis, Insights and Forecast - by Fuel Category
- 10.1.1. BEV
- 10.1.2. FCEV
- 10.1.3. HEV
- 10.1.4. PHEV
- 10.1. Market Analysis, Insights and Forecast - by Fuel Category
- 11. Asia Pacific Electric Bus Industry Analysis, Insights and Forecast, 2020-2032
- 11.1. Market Analysis, Insights and Forecast - by Fuel Category
- 11.1.1. BEV
- 11.1.2. FCEV
- 11.1.3. HEV
- 11.1.4. PHEV
- 11.1. Market Analysis, Insights and Forecast - by Fuel Category
- 12. Competitive Analysis
- 12.1. Company Profiles
- 12.1.1 Ashok Leyland Limited
- 12.1.1.1. Company Overview
- 12.1.1.2. Products
- 12.1.1.3. Company Financials
- 12.1.1.4. SWOT Analysis
- 12.1.2 Zhengzhou Yutong Bus Co Ltd
- 12.1.2.1. Company Overview
- 12.1.2.2. Products
- 12.1.2.3. Company Financials
- 12.1.2.4. SWOT Analysis
- 12.1.3 Chongqing Changan Automobile Company Limited
- 12.1.3.1. Company Overview
- 12.1.3.2. Products
- 12.1.3.3. Company Financials
- 12.1.3.4. SWOT Analysis
- 12.1.4 Anhui Ankai Automobile Co Ltd
- 12.1.4.1. Company Overview
- 12.1.4.2. Products
- 12.1.4.3. Company Financials
- 12.1.4.4. SWOT Analysis
- 12.1.5 Proterra INC
- 12.1.5.1. Company Overview
- 12.1.5.2. Products
- 12.1.5.3. Company Financials
- 12.1.5.4. SWOT Analysis
- 12.1.6 Tata Motors Limited
- 12.1.6.1. Company Overview
- 12.1.6.2. Products
- 12.1.6.3. Company Financials
- 12.1.6.4. SWOT Analysis
- 12.1.7 Daimler Truck Holding AG
- 12.1.7.1. Company Overview
- 12.1.7.2. Products
- 12.1.7.3. Company Financials
- 12.1.7.4. SWOT Analysis
- 12.1.8 Volvo Group
- 12.1.8.1. Company Overview
- 12.1.8.2. Products
- 12.1.8.3. Company Financials
- 12.1.8.4. SWOT Analysis
- 12.1.9 Zhejiang Geely Holding Group Co Ltd
- 12.1.9.1. Company Overview
- 12.1.9.2. Products
- 12.1.9.3. Company Financials
- 12.1.9.4. SWOT Analysis
- 12.1.10 CRRC Electric Vehicle Co Ltd
- 12.1.10.1. Company Overview
- 12.1.10.2. Products
- 12.1.10.3. Company Financials
- 12.1.10.4. SWOT Analysis
- 12.1.11 NFI Group Inc
- 12.1.11.1. Company Overview
- 12.1.11.2. Products
- 12.1.11.3. Company Financials
- 12.1.11.4. SWOT Analysis
- 12.1.12 King Long United Automotive Industry Co Ltd
- 12.1.12.1. Company Overview
- 12.1.12.2. Products
- 12.1.12.3. Company Financials
- 12.1.12.4. SWOT Analysis
- 12.1.13 Byd Auto Industry Company Limited
- 12.1.13.1. Company Overview
- 12.1.13.2. Products
- 12.1.13.3. Company Financials
- 12.1.13.4. SWOT Analysis
- 12.1.14 Zhongtong Bus Holding Co Ltd
- 12.1.14.1. Company Overview
- 12.1.14.2. Products
- 12.1.14.3. Company Financials
- 12.1.14.4. SWOT Analysis
- 12.1.15 Chery Automobile Co Ltd
- 12.1.15.1. Company Overview
- 12.1.15.2. Products
- 12.1.15.3. Company Financials
- 12.1.15.4. SWOT Analysis
- 12.1.1 Ashok Leyland Limited
- 12.2. Market Entropy
- 12.2.1 Company's Key Areas Served
- 12.2.2 Recent Developments
- 12.3. Company Market Share Analysis 2025
- 12.3.1 Top 5 Companies Market Share Analysis
- 12.3.2 Top 3 Companies Market Share Analysis
- 12.4. List of Potential Customers
- 13. Research Methodology
List of Figures
- Figure 1: Global Electric Bus Industry Revenue Breakdown (billion, %) by Region 2025 & 2033
- Figure 2: North America Electric Bus Industry Revenue (billion), by Fuel Category 2025 & 2033
- Figure 3: North America Electric Bus Industry Revenue Share (%), by Fuel Category 2025 & 2033
- Figure 4: North America Electric Bus Industry Revenue (billion), by Country 2025 & 2033
- Figure 5: North America Electric Bus Industry Revenue Share (%), by Country 2025 & 2033
- Figure 6: South America Electric Bus Industry Revenue (billion), by Fuel Category 2025 & 2033
- Figure 7: South America Electric Bus Industry Revenue Share (%), by Fuel Category 2025 & 2033
- Figure 8: South America Electric Bus Industry Revenue (billion), by Country 2025 & 2033
- Figure 9: South America Electric Bus Industry Revenue Share (%), by Country 2025 & 2033
- Figure 10: Europe Electric Bus Industry Revenue (billion), by Fuel Category 2025 & 2033
- Figure 11: Europe Electric Bus Industry Revenue Share (%), by Fuel Category 2025 & 2033
- Figure 12: Europe Electric Bus Industry Revenue (billion), by Country 2025 & 2033
- Figure 13: Europe Electric Bus Industry Revenue Share (%), by Country 2025 & 2033
- Figure 14: Middle East & Africa Electric Bus Industry Revenue (billion), by Fuel Category 2025 & 2033
- Figure 15: Middle East & Africa Electric Bus Industry Revenue Share (%), by Fuel Category 2025 & 2033
- Figure 16: Middle East & Africa Electric Bus Industry Revenue (billion), by Country 2025 & 2033
- Figure 17: Middle East & Africa Electric Bus Industry Revenue Share (%), by Country 2025 & 2033
- Figure 18: Asia Pacific Electric Bus Industry Revenue (billion), by Fuel Category 2025 & 2033
- Figure 19: Asia Pacific Electric Bus Industry Revenue Share (%), by Fuel Category 2025 & 2033
- Figure 20: Asia Pacific Electric Bus Industry Revenue (billion), by Country 2025 & 2033
- Figure 21: Asia Pacific Electric Bus Industry Revenue Share (%), by Country 2025 & 2033
List of Tables
- Table 1: Global Electric Bus Industry Revenue billion Forecast, by Fuel Category 2020 & 2033
- Table 2: Global Electric Bus Industry Revenue billion Forecast, by Region 2020 & 2033
- Table 3: Global Electric Bus Industry Revenue billion Forecast, by Fuel Category 2020 & 2033
- Table 4: Global Electric Bus Industry Revenue billion Forecast, by Country 2020 & 2033
- Table 5: United States Electric Bus Industry Revenue (billion) Forecast, by Application 2020 & 2033
- Table 6: Canada Electric Bus Industry Revenue (billion) Forecast, by Application 2020 & 2033
- Table 7: Mexico Electric Bus Industry Revenue (billion) Forecast, by Application 2020 & 2033
- Table 8: Global Electric Bus Industry Revenue billion Forecast, by Fuel Category 2020 & 2033
- Table 9: Global Electric Bus Industry Revenue billion Forecast, by Country 2020 & 2033
- Table 10: Brazil Electric Bus Industry Revenue (billion) Forecast, by Application 2020 & 2033
- Table 11: Argentina Electric Bus Industry Revenue (billion) Forecast, by Application 2020 & 2033
- Table 12: Rest of South America Electric Bus Industry Revenue (billion) Forecast, by Application 2020 & 2033
- Table 13: Global Electric Bus Industry Revenue billion Forecast, by Fuel Category 2020 & 2033
- Table 14: Global Electric Bus Industry Revenue billion Forecast, by Country 2020 & 2033
- Table 15: United Kingdom Electric Bus Industry Revenue (billion) Forecast, by Application 2020 & 2033
- Table 16: Germany Electric Bus Industry Revenue (billion) Forecast, by Application 2020 & 2033
- Table 17: France Electric Bus Industry Revenue (billion) Forecast, by Application 2020 & 2033
- Table 18: Italy Electric Bus Industry Revenue (billion) Forecast, by Application 2020 & 2033
- Table 19: Spain Electric Bus Industry Revenue (billion) Forecast, by Application 2020 & 2033
- Table 20: Russia Electric Bus Industry Revenue (billion) Forecast, by Application 2020 & 2033
- Table 21: Benelux Electric Bus Industry Revenue (billion) Forecast, by Application 2020 & 2033
- Table 22: Nordics Electric Bus Industry Revenue (billion) Forecast, by Application 2020 & 2033
- Table 23: Rest of Europe Electric Bus Industry Revenue (billion) Forecast, by Application 2020 & 2033
- Table 24: Global Electric Bus Industry Revenue billion Forecast, by Fuel Category 2020 & 2033
- Table 25: Global Electric Bus Industry Revenue billion Forecast, by Country 2020 & 2033
- Table 26: Turkey Electric Bus Industry Revenue (billion) Forecast, by Application 2020 & 2033
- Table 27: Israel Electric Bus Industry Revenue (billion) Forecast, by Application 2020 & 2033
- Table 28: GCC Electric Bus Industry Revenue (billion) Forecast, by Application 2020 & 2033
- Table 29: North Africa Electric Bus Industry Revenue (billion) Forecast, by Application 2020 & 2033
- Table 30: South Africa Electric Bus Industry Revenue (billion) Forecast, by Application 2020 & 2033
- Table 31: Rest of Middle East & Africa Electric Bus Industry Revenue (billion) Forecast, by Application 2020 & 2033
- Table 32: Global Electric Bus Industry Revenue billion Forecast, by Fuel Category 2020 & 2033
- Table 33: Global Electric Bus Industry Revenue billion Forecast, by Country 2020 & 2033
- Table 34: China Electric Bus Industry Revenue (billion) Forecast, by Application 2020 & 2033
- Table 35: India Electric Bus Industry Revenue (billion) Forecast, by Application 2020 & 2033
- Table 36: Japan Electric Bus Industry Revenue (billion) Forecast, by Application 2020 & 2033
- Table 37: South Korea Electric Bus Industry Revenue (billion) Forecast, by Application 2020 & 2033
- Table 38: ASEAN Electric Bus Industry Revenue (billion) Forecast, by Application 2020 & 2033
- Table 39: Oceania Electric Bus Industry Revenue (billion) Forecast, by Application 2020 & 2033
- Table 40: Rest of Asia Pacific Electric Bus Industry Revenue (billion) Forecast, by Application 2020 & 2033
Frequently Asked Questions
1. What is the projected Compound Annual Growth Rate (CAGR) of the Electric Bus Industry?
The projected CAGR is approximately 15.3%.
2. Which companies are prominent players in the Electric Bus Industry?
Key companies in the market include Ashok Leyland Limited, Zhengzhou Yutong Bus Co Ltd, Chongqing Changan Automobile Company Limited, Anhui Ankai Automobile Co Ltd, Proterra INC, Tata Motors Limited, Daimler Truck Holding AG, Volvo Group, Zhejiang Geely Holding Group Co Ltd, CRRC Electric Vehicle Co Ltd, NFI Group Inc, King Long United Automotive Industry Co Ltd, Byd Auto Industry Company Limited, Zhongtong Bus Holding Co Ltd, Chery Automobile Co Ltd.
3. What are the main segments of the Electric Bus Industry?
The market segments include Fuel Category.
4. Can you provide details about the market size?
The market size is estimated to be USD 44.81 billion as of 2022.
5. What are some drivers contributing to market growth?
Growing Travel and Tourism Industry is Driving the Car Rental Market.
6. What are the notable trends driving market growth?
OTHER KEY INDUSTRY TRENDS COVERED IN THE REPORT.
7. Are there any restraints impacting market growth?
Increasing Popularity of Ride-Sharing Services Pose Challenges for the Conventional Car Rental Market.
8. Can you provide examples of recent developments in the market?
December 2023: Proterra announced its new EV battery factory in South Carolina as demand for commercial electric vehicles increased.November 2023: Switch Mobilty partners with JSW for electric buses for employee transportation in India.September 2023: Daimler Buses launched the next generation Setra TopClass and ComfortClass touring coaches that meet the highest standards of safety, economy, and flexibility.
9. What pricing options are available for accessing the report?
Pricing options include single-user, multi-user, and enterprise licenses priced at USD 3800, USD 4500, and USD 5800 respectively.
10. Is the market size provided in terms of value or volume?
The market size is provided in terms of value, measured in billion.
11. Are there any specific market keywords associated with the report?
Yes, the market keyword associated with the report is "Electric Bus Industry," which aids in identifying and referencing the specific market segment covered.
12. How do I determine which pricing option suits my needs best?
The pricing options vary based on user requirements and access needs. Individual users may opt for single-user licenses, while businesses requiring broader access may choose multi-user or enterprise licenses for cost-effective access to the report.
13. Are there any additional resources or data provided in the Electric Bus Industry report?
While the report offers comprehensive insights, it's advisable to review the specific contents or supplementary materials provided to ascertain if additional resources or data are available.
14. How can I stay updated on further developments or reports in the Electric Bus Industry?
To stay informed about further developments, trends, and reports in the Electric Bus Industry, consider subscribing to industry newsletters, following relevant companies and organizations, or regularly checking reputable industry news sources and publications.
Methodology
Step 1 - Identification of Relevant Samples Size from Population Database


Step 2 - Approaches for Defining Global Market Size (Value, Volume* & Price*)

Note*: In applicable scenarios
Step 3 - Data Sources
Primary Research
- Web Analytics
- Survey Reports
- Research Institute
- Latest Research Reports
- Opinion Leaders
Secondary Research
- Annual Reports
- White Paper
- Latest Press Release
- Industry Association
- Paid Database
- Investor Presentations

Step 4 - Data Triangulation
Involves using different sources of information in order to increase the validity of a study
These sources are likely to be stakeholders in a program - participants, other researchers, program staff, other community members, and so on.
Then we put all data in single framework & apply various statistical tools to find out the dynamic on the market.
During the analysis stage, feedback from the stakeholder groups would be compared to determine areas of agreement as well as areas of divergence