

Key Insights
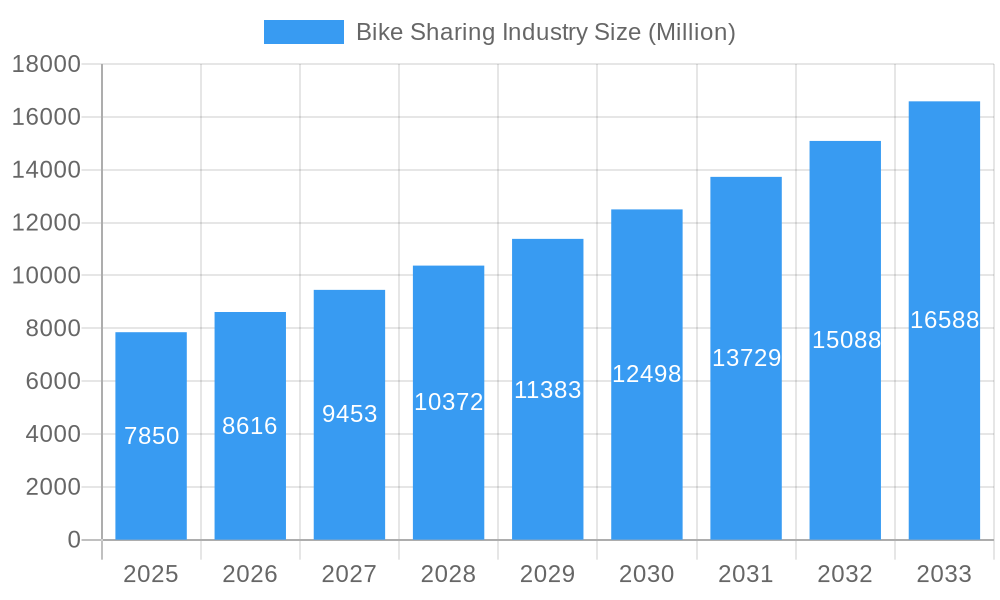
The global bike-sharing market, valued at $7.85 billion in 2025, is poised for robust growth, exhibiting a Compound Annual Growth Rate (CAGR) of 9.65% from 2025 to 2033. This expansion is driven by several key factors. Increasing urbanization and traffic congestion in major cities worldwide are prompting consumers to seek eco-friendly and efficient transportation alternatives. Government initiatives promoting sustainable transportation, coupled with the rising awareness of environmental concerns, further fuel market growth. Technological advancements, such as the introduction of e-bikes and improved dockless sharing systems, enhance user experience and convenience, attracting a wider user base. The integration of smart technology, enabling features like real-time tracking and mobile payment options, also contributes significantly to market expansion. Furthermore, the increasing affordability of e-bikes and the expanding network of bike-sharing stations are further propelling market growth. Competition among major players like JCDecaux Group, Didi Chuxing, and Uber is driving innovation and service improvements, benefiting consumers and fostering market expansion.
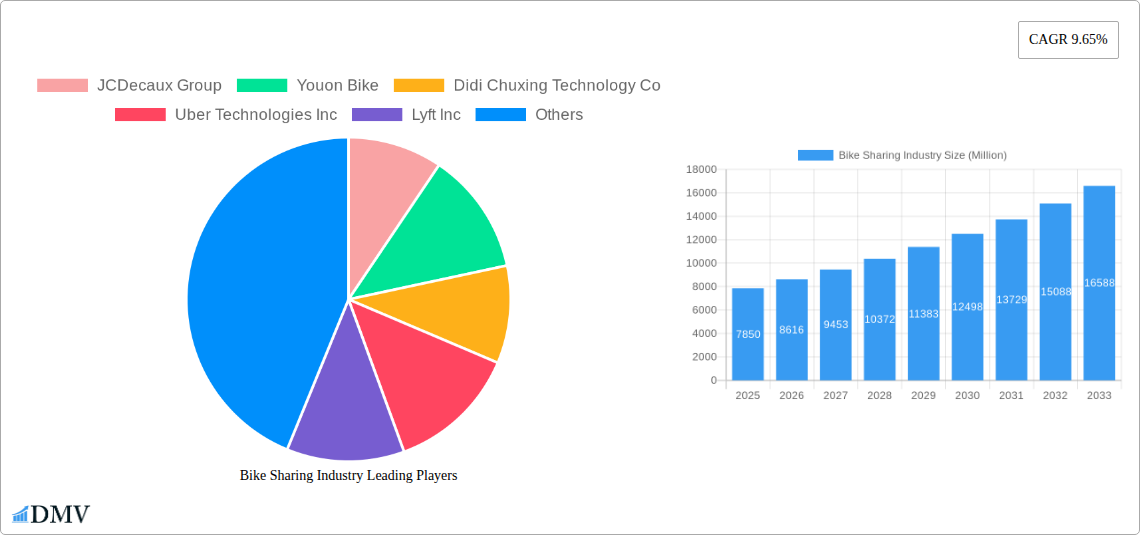
Bike Sharing Industry Market Size (In Billion)
The market segmentation reveals a dynamic landscape. While traditional bikes maintain a substantial market share, the rapid adoption of e-bikes is significantly impacting growth, driven by their increased convenience and range. Dockless systems, offering greater flexibility and accessibility, are gaining popularity over docked systems. Regional variations exist, with Asia Pacific anticipated to dominate the market due to high population density and rising disposable incomes in key regions. North America and Europe are expected to showcase steady growth, driven by increasing environmental consciousness and government support for sustainable transportation solutions. However, challenges remain, including operational costs, vandalism, and the need for robust infrastructure development to support the expanding bike-sharing networks. Effective regulation and sustainable business models will be crucial for long-term market success.
Bike Sharing Industry Company Market Share
Bike Sharing Industry Market Report: 2019-2033
This comprehensive report provides a detailed analysis of the global bike-sharing industry, encompassing market trends, competitive dynamics, technological advancements, and future growth prospects from 2019 to 2033. The study period covers the historical period (2019-2024), the base year (2025), and the forecast period (2025-2033), offering a complete picture of the industry's evolution and future trajectory. The report is invaluable for stakeholders including investors, industry professionals, and policymakers seeking to understand the landscape of this rapidly evolving sector, and projects a market value exceeding xx Million by 2033.
Bike Sharing Industry Market Composition & Trends
This section delves into the market's competitive structure, analyzing market share distribution among key players like JCDecaux Group, Youon Bike, Didi Chuxing Technology Co, Uber Technologies Inc, Lyft Inc, Bluegogo, Hellobike, Meituan Bik, Bird Rides Inc, and Neutron Holdings Inc. The report evaluates market concentration, identifying the dominant players and assessing their strategic moves. Innovation catalysts, such as technological advancements in e-bikes and dockless systems, are examined alongside their impact on market dynamics. Regulatory landscapes across different regions, influencing factors like permit requirements and safety standards, are thoroughly explored. The influence of substitute products, such as ride-hailing services, and end-user profiles, including commuters, tourists, and last-mile delivery services, are also detailed. Furthermore, the report analyzes M&A activities within the industry, including deal values and their implications for market consolidation.
- Market Share Distribution (2024): JCDecaux Group (xx%), Didi Chuxing Technology Co (xx%), Uber Technologies Inc (xx%), Others (xx%). (Note: Exact figures require further research and are unavailable at this time. xx represents predicted percentage.)
- M&A Deal Values (2019-2024): Total value exceeding xx Million USD. (Note: Exact figures require further research and are unavailable at this time.)
- Key Innovation Catalysts: Development of e-bikes, introduction of dockless systems, integration of smart city technologies.
Bike Sharing Industry Industry Evolution
This section provides a detailed analysis of the bike-sharing industry's evolution from 2019 to 2033. The report charts the market's growth trajectory, highlighting periods of rapid expansion and any potential slowdowns. Technological advancements, such as the shift towards e-bikes and improved GPS tracking, and their impact on user adoption and market expansion are explored. Changing consumer demands, including preferences for convenient, sustainable, and affordable transportation options, are meticulously examined. This section provides quantitative data, such as year-on-year growth rates and adoption metrics for different bike types (traditional and e-bikes) and sharing systems (docked and dockless), across various geographical regions. For instance, the report analyzes how the rise of e-bikes has fueled market growth, particularly in urban areas. The influence of technological developments on operational efficiency and cost reduction is also critically evaluated. The section projects continued growth for the bike-sharing industry, driven by evolving consumer preferences for environmentally friendly transport.
Leading Regions, Countries, or Segments in Bike Sharing Industry
This section identifies the dominant regions, countries, and segments within the bike-sharing market. The analysis focuses on the factors driving the dominance of specific regions or segments, like the penetration rate of e-bikes, the regulatory environment, or the level of government investment in bike-sharing infrastructure. The report contrasts the performance of traditional bikes versus e-bikes, and docked versus dockless systems, offering insights into their market share and growth potential.
- Key Drivers for Dominant Regions/Segments:
- High population density: Urban areas with significant populations present a large potential market.
- Government incentives and subsidies: Government support through financial incentives boosts adoption.
- Favorable regulatory environment: Supportive policies encourage the development of bike-sharing programs.
- Technological advancements: The availability of high-quality, affordable e-bikes drives market growth.
- In-depth analysis: The report provides an in-depth assessment of the leading regions and segments, including a qualitative and quantitative analysis of their market share, growth trajectory, and future potential. For example, the report may highlight that China and certain European cities are leading in the e-bike segment due to strong government support and high consumer demand.
Bike Sharing Industry Product Innovations
Recent years have witnessed significant product innovations within the bike-sharing industry. The introduction of e-bikes has broadened the appeal of bike-sharing to a wider demographic, enhancing travel distances and speeds. Improvements in GPS tracking and anti-theft technologies have increased operational efficiency and user safety. The development of more durable and user-friendly bikes along with innovative dockless systems are critical factors impacting user experience. These innovations, coupled with features like integrated payment systems and user-friendly mobile applications, are reshaping the competitive landscape and driving market expansion.
Propelling Factors for Bike Sharing Industry Growth
Several key factors are driving the growth of the bike-sharing industry. Technological advancements, such as the development of e-bikes with longer battery ranges and enhanced safety features, are boosting adoption rates. Favorable economic conditions, including increased disposable income in many regions, are making bike-sharing a more accessible transportation option. Furthermore, supportive government policies and initiatives, aimed at promoting sustainable transportation and reducing traffic congestion, are fueling industry expansion. Examples include financial incentives for bike-sharing companies and the development of dedicated bike lanes.
Obstacles in the Bike Sharing Industry Market
Despite the positive growth trajectory, the bike-sharing industry faces several challenges. Regulatory hurdles, including obtaining permits and complying with safety standards, can create significant barriers to entry and operational expansion. Supply chain disruptions and the volatility of raw material prices, can impact the profitability of bike-sharing operations. Furthermore, intense competition among existing players, coupled with the emergence of new entrants, puts pressure on profit margins. The impact of these challenges is quantified in the report through data on market share changes and operational costs.
Future Opportunities in Bike Sharing Industry
The bike-sharing industry presents numerous opportunities for future growth. Expansion into new markets, particularly in developing countries with growing urban populations and limited public transport infrastructure, offers significant potential. Technological advancements, such as the integration of artificial intelligence (AI) for optimized fleet management and the development of autonomous bike-sharing systems, are likely to disrupt the market. Growing consumer demand for sustainable and environmentally friendly transportation options will further drive industry growth.
Major Players in the Bike Sharing Industry Ecosystem
- JCDecaux Group
- Youon Bike
- Didi Chuxing Technology Co
- Uber Technologies Inc
- Lyft Inc
- Bluegogo
- Hellobike
- Meituan Bik
- Bird Rides Inc
- Neutron Holdings Inc
Key Developments in Bike Sharing Industry Industry
- March 2023: MYBYK launched two electric bicycle variants, the MYBYK Electric and MYBYK Electric Cargo, impacting the e-bike segment and last-mile delivery services.
- March 2023: Brighton and Hove launched a bike-sharing scheme with Beryl, demonstrating the expansion into new geographical markets.
- December 2023: The US International Development Finance Corporation (DFC) and IDB Invest co-invested USD 23 Million in Tembici, signaling significant investment and expansion in Latin America.
Strategic Bike Sharing Industry Market Forecast
The bike-sharing industry is poised for continued growth, driven by technological advancements, favorable regulatory environments, and increasing consumer demand for sustainable transportation solutions. The expansion of e-bike adoption, coupled with the development of innovative business models and technological enhancements, will further fuel market expansion. The global market is projected to reach significant size, exceeding xx Million by 2033, presenting substantial opportunities for investors and industry participants.
Bike Sharing Industry Segmentation
-
1. Bike
- 1.1. Traditional/Regular Bike
- 1.2. E-bike
-
2. Sharing System
- 2.1. Docked
- 2.2. Dockless
Bike Sharing Industry Segmentation By Geography
- 1. North America
- 2. Europe
- 3. Asia Pacific
- 4. Rest of the World
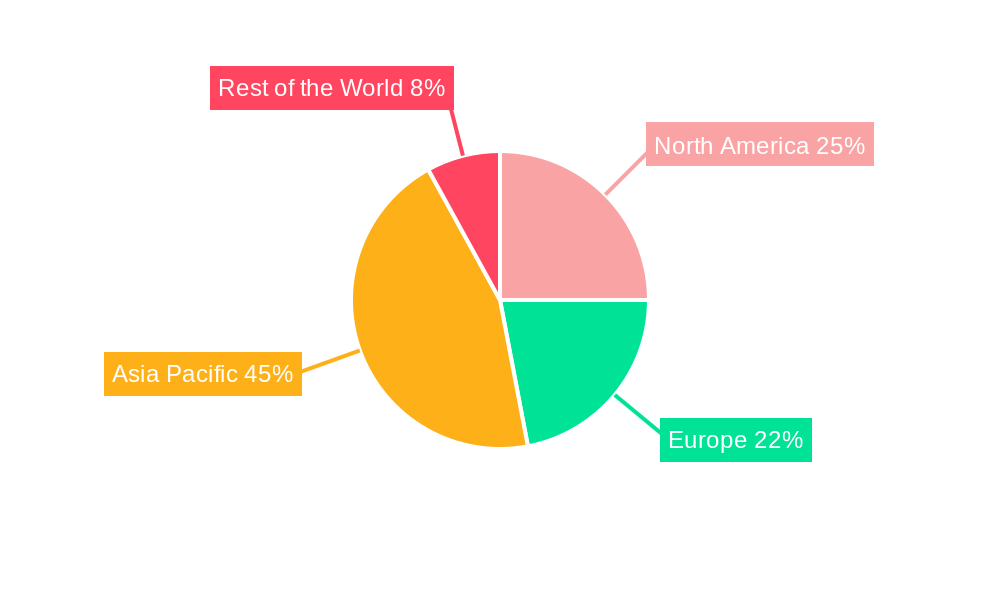
Bike Sharing Industry Regional Market Share
Geographic Coverage of Bike Sharing Industry
Bike Sharing Industry REPORT HIGHLIGHTS
| Aspects | Details |
|---|---|
| Study Period | 2020-2034 |
| Base Year | 2025 |
| Estimated Year | 2026 |
| Forecast Period | 2026-2034 |
| Historical Period | 2020-2025 |
| Growth Rate | CAGR of 9.65% from 2020-2034 |
| Segmentation |
|
Table of Contents
- 1. Introduction
- 1.1. Research Scope
- 1.2. Market Segmentation
- 1.3. Research Objective
- 1.4. Definitions and Assumptions
- 2. Executive Summary
- 2.1. Market Snapshot
- 3. Market Dynamics
- 3.1. Market Drivers
- 3.2. Market Restrains
- 3.3. Market Trends
- 3.4. Market Opportunities
- 4. Market Factor Analysis
- 4.1. Porters Five Forces
- 4.1.1. Bargaining Power of Suppliers
- 4.1.2. Bargaining Power of Buyers
- 4.1.3. Threat of New Entrants
- 4.1.4. Threat of Substitutes
- 4.1.5. Competitive Rivalry
- 4.2. PESTEL analysis
- 4.3. BCG Analysis
- 4.3.1. Stars (High Growth, High Market Share)
- 4.3.2. Cash Cows (Low Growth, High Market Share)
- 4.3.3. Question Mark (High Growth, Low Market Share)
- 4.3.4. Dogs (Low Growth, Low Market Share)
- 4.4. Ansoff Matrix Analysis
- 4.5. Supply Chain Analysis
- 4.6. Regulatory Landscape
- 4.7. Current Market Potential and Opportunity Assessment (TAM–SAM–SOM Framework)
- 4.8. DMV Analyst Note
- 4.1. Porters Five Forces
- 5. Market Analysis, Insights and Forecast 2021-2033
- 5.1. Market Analysis, Insights and Forecast - by Bike
- 5.1.1. Traditional/Regular Bike
- 5.1.2. E-bike
- 5.2. Market Analysis, Insights and Forecast - by Sharing System
- 5.2.1. Docked
- 5.2.2. Dockless
- 5.3. Market Analysis, Insights and Forecast - by Region
- 5.3.1. North America
- 5.3.2. Europe
- 5.3.3. Asia Pacific
- 5.3.4. Rest of the World
- 5.1. Market Analysis, Insights and Forecast - by Bike
- 6. Global Bike Sharing Industry Analysis, Insights and Forecast, 2021-2033
- 6.1. Market Analysis, Insights and Forecast - by Bike
- 6.1.1. Traditional/Regular Bike
- 6.1.2. E-bike
- 6.2. Market Analysis, Insights and Forecast - by Sharing System
- 6.2.1. Docked
- 6.2.2. Dockless
- 6.1. Market Analysis, Insights and Forecast - by Bike
- 7. North America Bike Sharing Industry Analysis, Insights and Forecast, 2020-2032
- 7.1. Market Analysis, Insights and Forecast - by Bike
- 7.1.1. Traditional/Regular Bike
- 7.1.2. E-bike
- 7.2. Market Analysis, Insights and Forecast - by Sharing System
- 7.2.1. Docked
- 7.2.2. Dockless
- 7.1. Market Analysis, Insights and Forecast - by Bike
- 8. Europe Bike Sharing Industry Analysis, Insights and Forecast, 2020-2032
- 8.1. Market Analysis, Insights and Forecast - by Bike
- 8.1.1. Traditional/Regular Bike
- 8.1.2. E-bike
- 8.2. Market Analysis, Insights and Forecast - by Sharing System
- 8.2.1. Docked
- 8.2.2. Dockless
- 8.1. Market Analysis, Insights and Forecast - by Bike
- 9. Asia Pacific Bike Sharing Industry Analysis, Insights and Forecast, 2020-2032
- 9.1. Market Analysis, Insights and Forecast - by Bike
- 9.1.1. Traditional/Regular Bike
- 9.1.2. E-bike
- 9.2. Market Analysis, Insights and Forecast - by Sharing System
- 9.2.1. Docked
- 9.2.2. Dockless
- 9.1. Market Analysis, Insights and Forecast - by Bike
- 10. Rest of the World Bike Sharing Industry Analysis, Insights and Forecast, 2020-2032
- 10.1. Market Analysis, Insights and Forecast - by Bike
- 10.1.1. Traditional/Regular Bike
- 10.1.2. E-bike
- 10.2. Market Analysis, Insights and Forecast - by Sharing System
- 10.2.1. Docked
- 10.2.2. Dockless
- 10.1. Market Analysis, Insights and Forecast - by Bike
- 11. Competitive Analysis
- 11.1. Company Profiles
- 11.1.1 JCDecaux Group
- 11.1.1.1. Company Overview
- 11.1.1.2. Products
- 11.1.1.3. Company Financials
- 11.1.1.4. SWOT Analysis
- 11.1.2 Youon Bike
- 11.1.2.1. Company Overview
- 11.1.2.2. Products
- 11.1.2.3. Company Financials
- 11.1.2.4. SWOT Analysis
- 11.1.3 Didi Chuxing Technology Co
- 11.1.3.1. Company Overview
- 11.1.3.2. Products
- 11.1.3.3. Company Financials
- 11.1.3.4. SWOT Analysis
- 11.1.4 Uber Technologies Inc
- 11.1.4.1. Company Overview
- 11.1.4.2. Products
- 11.1.4.3. Company Financials
- 11.1.4.4. SWOT Analysis
- 11.1.5 Lyft Inc
- 11.1.5.1. Company Overview
- 11.1.5.2. Products
- 11.1.5.3. Company Financials
- 11.1.5.4. SWOT Analysis
- 11.1.6 Bluegogo
- 11.1.6.1. Company Overview
- 11.1.6.2. Products
- 11.1.6.3. Company Financials
- 11.1.6.4. SWOT Analysis
- 11.1.7 Hellobike
- 11.1.7.1. Company Overview
- 11.1.7.2. Products
- 11.1.7.3. Company Financials
- 11.1.7.4. SWOT Analysis
- 11.1.8 Meituan Bik
- 11.1.8.1. Company Overview
- 11.1.8.2. Products
- 11.1.8.3. Company Financials
- 11.1.8.4. SWOT Analysis
- 11.1.9 Bird Rides Inc
- 11.1.9.1. Company Overview
- 11.1.9.2. Products
- 11.1.9.3. Company Financials
- 11.1.9.4. SWOT Analysis
- 11.1.10 Neutron Holdings Inc
- 11.1.10.1. Company Overview
- 11.1.10.2. Products
- 11.1.10.3. Company Financials
- 11.1.10.4. SWOT Analysis
- 11.1.1 JCDecaux Group
- 11.2. Market Entropy
- 11.2.1 Company's Key Areas Served
- 11.2.2 Recent Developments
- 11.3. Company Market Share Analysis 2025
- 11.3.1 Top 5 Companies Market Share Analysis
- 11.3.2 Top 3 Companies Market Share Analysis
- 11.4. List of Potential Customers
- 12. Research Methodology
List of Figures
- Figure 1: Global Bike Sharing Industry Revenue Breakdown (Million, %) by Region 2025 & 2033
- Figure 2: North America Bike Sharing Industry Revenue (Million), by Bike 2025 & 2033
- Figure 3: North America Bike Sharing Industry Revenue Share (%), by Bike 2025 & 2033
- Figure 4: North America Bike Sharing Industry Revenue (Million), by Sharing System 2025 & 2033
- Figure 5: North America Bike Sharing Industry Revenue Share (%), by Sharing System 2025 & 2033
- Figure 6: North America Bike Sharing Industry Revenue (Million), by Country 2025 & 2033
- Figure 7: North America Bike Sharing Industry Revenue Share (%), by Country 2025 & 2033
- Figure 8: Europe Bike Sharing Industry Revenue (Million), by Bike 2025 & 2033
- Figure 9: Europe Bike Sharing Industry Revenue Share (%), by Bike 2025 & 2033
- Figure 10: Europe Bike Sharing Industry Revenue (Million), by Sharing System 2025 & 2033
- Figure 11: Europe Bike Sharing Industry Revenue Share (%), by Sharing System 2025 & 2033
- Figure 12: Europe Bike Sharing Industry Revenue (Million), by Country 2025 & 2033
- Figure 13: Europe Bike Sharing Industry Revenue Share (%), by Country 2025 & 2033
- Figure 14: Asia Pacific Bike Sharing Industry Revenue (Million), by Bike 2025 & 2033
- Figure 15: Asia Pacific Bike Sharing Industry Revenue Share (%), by Bike 2025 & 2033
- Figure 16: Asia Pacific Bike Sharing Industry Revenue (Million), by Sharing System 2025 & 2033
- Figure 17: Asia Pacific Bike Sharing Industry Revenue Share (%), by Sharing System 2025 & 2033
- Figure 18: Asia Pacific Bike Sharing Industry Revenue (Million), by Country 2025 & 2033
- Figure 19: Asia Pacific Bike Sharing Industry Revenue Share (%), by Country 2025 & 2033
- Figure 20: Rest of the World Bike Sharing Industry Revenue (Million), by Bike 2025 & 2033
- Figure 21: Rest of the World Bike Sharing Industry Revenue Share (%), by Bike 2025 & 2033
- Figure 22: Rest of the World Bike Sharing Industry Revenue (Million), by Sharing System 2025 & 2033
- Figure 23: Rest of the World Bike Sharing Industry Revenue Share (%), by Sharing System 2025 & 2033
- Figure 24: Rest of the World Bike Sharing Industry Revenue (Million), by Country 2025 & 2033
- Figure 25: Rest of the World Bike Sharing Industry Revenue Share (%), by Country 2025 & 2033
List of Tables
- Table 1: Global Bike Sharing Industry Revenue Million Forecast, by Bike 2020 & 2033
- Table 2: Global Bike Sharing Industry Revenue Million Forecast, by Sharing System 2020 & 2033
- Table 3: Global Bike Sharing Industry Revenue Million Forecast, by Region 2020 & 2033
- Table 4: Global Bike Sharing Industry Revenue Million Forecast, by Bike 2020 & 2033
- Table 5: Global Bike Sharing Industry Revenue Million Forecast, by Sharing System 2020 & 2033
- Table 6: Global Bike Sharing Industry Revenue Million Forecast, by Country 2020 & 2033
- Table 7: Global Bike Sharing Industry Revenue Million Forecast, by Bike 2020 & 2033
- Table 8: Global Bike Sharing Industry Revenue Million Forecast, by Sharing System 2020 & 2033
- Table 9: Global Bike Sharing Industry Revenue Million Forecast, by Country 2020 & 2033
- Table 10: Global Bike Sharing Industry Revenue Million Forecast, by Bike 2020 & 2033
- Table 11: Global Bike Sharing Industry Revenue Million Forecast, by Sharing System 2020 & 2033
- Table 12: Global Bike Sharing Industry Revenue Million Forecast, by Country 2020 & 2033
- Table 13: Global Bike Sharing Industry Revenue Million Forecast, by Bike 2020 & 2033
- Table 14: Global Bike Sharing Industry Revenue Million Forecast, by Sharing System 2020 & 2033
- Table 15: Global Bike Sharing Industry Revenue Million Forecast, by Country 2020 & 2033
Frequently Asked Questions
1. What is the projected Compound Annual Growth Rate (CAGR) of the Bike Sharing Industry?
The projected CAGR is approximately 9.65%.
2. Which companies are prominent players in the Bike Sharing Industry?
Key companies in the market include JCDecaux Group, Youon Bike, Didi Chuxing Technology Co, Uber Technologies Inc, Lyft Inc, Bluegogo, Hellobike, Meituan Bik, Bird Rides Inc, Neutron Holdings Inc.
3. What are the main segments of the Bike Sharing Industry?
The market segments include Bike, Sharing System.
4. Can you provide details about the market size?
The market size is estimated to be USD 7.85 Million as of 2022.
5. What are some drivers contributing to market growth?
Increasing Inclusion of E-bikes in the Sharing Fleet.
6. What are the notable trends driving market growth?
E-bike Segment Expected to be the Fastest-growing Segment Over the Forecast Period.
7. Are there any restraints impacting market growth?
Limited Infrastructure May Hinder Market Growth.
8. Can you provide examples of recent developments in the market?
December 2023: The US International Development Finance Corporation (DFC) and IDB Invest announced that they were co-investing a combined USD 23 million in equity in micro-mobility platform Tembici to support the expansion of bicycle-sharing services in Latin America.
9. What pricing options are available for accessing the report?
Pricing options include single-user, multi-user, and enterprise licenses priced at USD 4750, USD 5250, and USD 8750 respectively.
10. Is the market size provided in terms of value or volume?
The market size is provided in terms of value, measured in Million.
11. Are there any specific market keywords associated with the report?
Yes, the market keyword associated with the report is "Bike Sharing Industry," which aids in identifying and referencing the specific market segment covered.
12. How do I determine which pricing option suits my needs best?
The pricing options vary based on user requirements and access needs. Individual users may opt for single-user licenses, while businesses requiring broader access may choose multi-user or enterprise licenses for cost-effective access to the report.
13. Are there any additional resources or data provided in the Bike Sharing Industry report?
While the report offers comprehensive insights, it's advisable to review the specific contents or supplementary materials provided to ascertain if additional resources or data are available.
14. How can I stay updated on further developments or reports in the Bike Sharing Industry?
To stay informed about further developments, trends, and reports in the Bike Sharing Industry, consider subscribing to industry newsletters, following relevant companies and organizations, or regularly checking reputable industry news sources and publications.
Methodology
Step 1 - Identification of Relevant Samples Size from Population Database


Step 2 - Approaches for Defining Global Market Size (Value, Volume* & Price*)

Note*: In applicable scenarios
Step 3 - Data Sources
Primary Research
- Web Analytics
- Survey Reports
- Research Institute
- Latest Research Reports
- Opinion Leaders
Secondary Research
- Annual Reports
- White Paper
- Latest Press Release
- Industry Association
- Paid Database
- Investor Presentations

Step 4 - Data Triangulation
Involves using different sources of information in order to increase the validity of a study
These sources are likely to be stakeholders in a program - participants, other researchers, program staff, other community members, and so on.
Then we put all data in single framework & apply various statistical tools to find out the dynamic on the market.
During the analysis stage, feedback from the stakeholder groups would be compared to determine areas of agreement as well as areas of divergence