

Key Insights
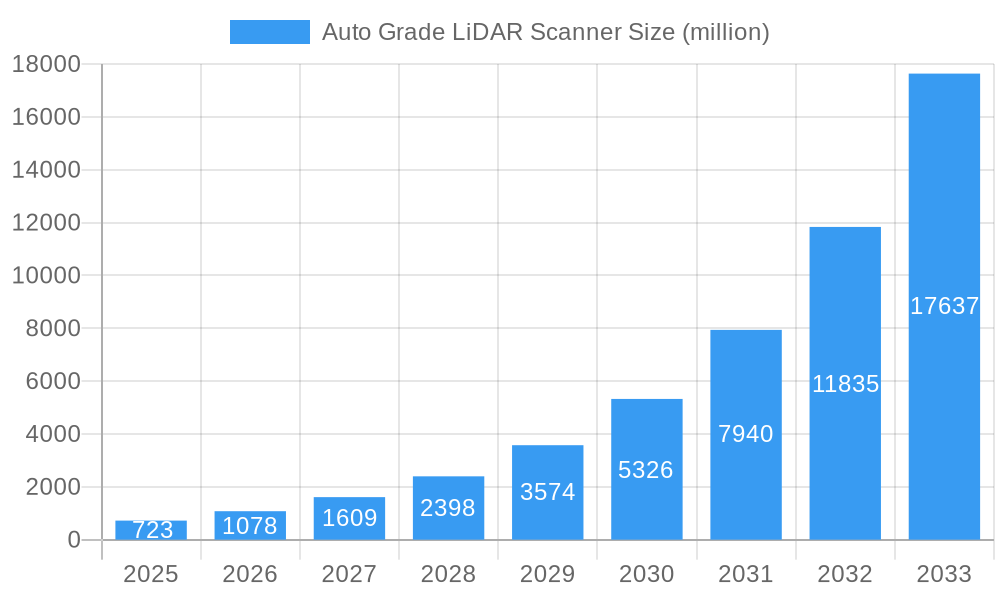
The Auto Grade LiDAR Scanner market is experiencing an unprecedented surge, projected to reach an estimated USD 723 million by 2025. This explosive growth is fueled by a staggering Compound Annual Growth Rate (CAGR) of 49.5%, indicating a rapid and sustained expansion. The primary drivers behind this market acceleration are the escalating demand for advanced driver-assistance systems (ADAS) and the imminent widespread adoption of fully autonomous driving technologies. As regulatory bodies worldwide push for enhanced vehicle safety and manufacturers race to integrate sophisticated perception systems, LiDAR's ability to provide precise, real-time 3D environmental mapping becomes indispensable. This technological imperative is pushing innovation in LiDAR solutions, particularly towards solid-state designs that offer greater durability, reduced cost, and improved performance compared to their mechanical counterparts. The evolution of these sensor technologies is directly enabling a new era of intelligent mobility.
Auto Grade LiDAR Scanner Market Size (In Million)
The market landscape is characterized by significant trends, including the miniaturization and cost reduction of LiDAR units, making them more accessible for integration across a wider range of vehicle segments. Furthermore, the increasing sophistication of sensor fusion, where LiDAR data is combined with information from cameras, radar, and ultrasonic sensors, is enhancing the robustness and reliability of autonomous driving systems. Key players like Hesai Tech, Valeo, RoboSense, and Luminar are heavily investing in research and development to stay ahead of the curve, introducing next-generation LiDAR solutions with enhanced range, resolution, and environmental resilience. While the market is poised for remarkable growth, certain restraints, such as the high initial cost of certain high-performance LiDAR systems and the ongoing challenges in achieving full functional safety for Level 5 autonomy in all weather conditions, remain areas of focus for further technological advancements and industry collaboration. However, the overwhelming market momentum, driven by safety mandates and the pursuit of autonomous mobility, is expected to overcome these hurdles.
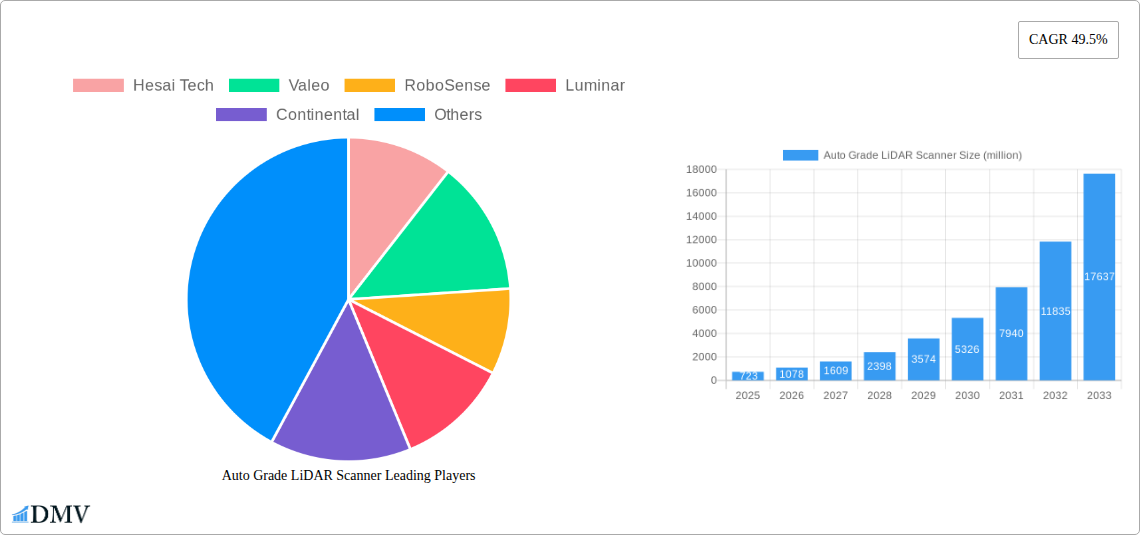
Auto Grade LiDAR Scanner Company Market Share
Auto Grade LiDAR Scanner Market Composition & Trends
The Auto Grade LiDAR Scanner market is characterized by a dynamic and rapidly evolving landscape, driven by significant technological advancements and increasing adoption in automotive applications. Market concentration is influenced by the presence of established automotive suppliers and innovative LiDAR technology specialists, with key players like Hesai Tech, Valeo, RoboSense, Luminar, Continental, Velodyne, Ouster, Livox, Innoviz, Cepton, and Aeva vying for substantial market share. The study period from 2019 to 2033 encompasses a critical phase of this market's maturation. Innovation catalysts are primarily stemming from the pursuit of higher resolution, longer range, wider field of view, and lower cost LiDAR solutions. Regulatory landscapes are progressively becoming more conducive to autonomous driving technologies, which inherently boosts demand for reliable auto-grade LiDAR. Substitute products, while present, often fall short in performance for advanced driver-assistance systems (ADAS) and fully autonomous driving. End-user profiles are predominantly automotive OEMs and Tier-1 suppliers focused on safety and advanced functionalities. Mergers and acquisitions (M&A) activities are on the rise as companies seek to consolidate their market positions, acquire critical technologies, and expand their geographical reach. For instance, M&A deal values are estimated to reach several hundred million, reflecting strategic consolidation efforts. The market share distribution is expected to see shifts, with leading companies potentially capturing over 10% each in the coming years.
- Market Share Distribution: Leading companies are projected to hold significant portions of the market, with top players aiming for over 10% market share by 2033.
- M&A Deal Values: Strategic acquisitions and partnerships are valued in the hundreds of millions, reflecting aggressive consolidation.
- Innovation Catalysts: Focus on improved resolution, range, FOV, and cost reduction for widespread adoption.
- End-User Focus: Automotive OEMs and Tier-1 suppliers are the primary consumers, prioritizing safety and autonomy.
Auto Grade LiDAR Scanner Industry Evolution
The auto-grade LiDAR scanner industry has witnessed a remarkable evolution from 2019 to the present, propelled by relentless technological innovation and a burgeoning demand for enhanced automotive safety and autonomous driving capabilities. During the historical period (2019-2024), the market primarily saw the maturation of mechanical LiDAR, a foundational technology that paved the way for widespread awareness and early adoption in research and development. However, the significant shift in recent years has been the rapid advancement and increasing prominence of solid-state LiDAR technologies. This evolution is characterized by a consistent upward trajectory in market growth, with Compound Annual Growth Rates (CAGRs) projected to be in the high double digits, potentially exceeding 30% during the forecast period. Technological advancements have focused on miniaturization, increased durability, enhanced environmental robustness (resilience to vibration, shock, and extreme temperatures), and crucially, a substantial reduction in manufacturing costs, bringing LiDAR closer to mass-market affordability.
Consumer demand, initially driven by the desire for advanced safety features in ADAS, is increasingly transitioning towards full self-driving ambitions. This shift necessitates higher-performing, more reliable, and cost-effective LiDAR solutions. Early adoption metrics for LiDAR in premium vehicle segments have been encouraging, serving as a precursor to broader integration. The estimated year of 2025 marks a critical inflection point, with widespread adoption in Level 2+ ADAS systems and significant breakthroughs in Level 3 and Level 4 autonomous vehicle deployments becoming more tangible. The base year of 2025 is pivotal for evaluating current market penetration and setting realistic growth projections. The transition from bulky, expensive mechanical units to sleek, integrated solid-state solutions is a testament to this rapid evolution. Performance metrics such as range (increasing from a few tens of meters to over 300 meters for perception LiDAR), resolution (from sparse point clouds to dense, high-definition data), and field of view (achieving near 360-degree coverage) have seen exponential improvements. This continuous innovation cycle, coupled with strong investment from both established automotive players and venture capital firms, has solidified LiDAR's position as an indispensable sensor for the future of mobility. The journey from niche technology to a mainstream automotive component is well underway, driven by a convergence of technological prowess, economic viability, and regulatory support.
Leading Regions, Countries, or Segments in Auto Grade LiDAR Scanner
The auto-grade LiDAR scanner market's dominance is currently concentrated in regions and countries at the forefront of automotive innovation and autonomous driving development. North America, particularly the United States, and Asia-Pacific, led by China and Japan, are emerging as the leading geographical segments due to substantial investments in R&D, supportive government initiatives, and the presence of major automotive manufacturers and technology giants actively pursuing ADAS and self-driving technologies.
Within the application segments, ADAS (Advanced Driver-Assistance Systems) currently holds the largest market share. This is driven by the increasing integration of sophisticated safety features like adaptive cruise control, automatic emergency braking, and lane-keeping assist in a wide range of vehicles, from premium to mass-market segments. The demand for enhanced safety, reduced accident rates, and improved driving comfort fuels the adoption of LiDAR in ADAS.
Regarding the types of LiDAR, Solid State Lidar is rapidly gaining prominence and is projected to become the dominant technology in the forecast period. While Mechanical Lidar played a crucial role in the historical development and initial deployments, its limitations in terms of cost, durability, and integration complexity are being addressed by solid-state alternatives. Solid-state LiDAR, including MEMS (Micro-Electro-Mechanical Systems) and flash LiDAR, offers advantages such as higher reliability, smaller form factors, lower power consumption, and significantly reduced manufacturing costs, making them more suitable for mass production.
Key Drivers for Dominance in North America and Asia-Pacific:
- High Investment in R&D: Significant funding from both private and public sectors for autonomous vehicle research and development.
- Government Initiatives and Regulations: Proactive regulatory frameworks and pilot programs supporting the testing and deployment of autonomous vehicles.
- Presence of Major Automotive OEMs: Concentration of leading car manufacturers and Tier-1 suppliers actively integrating LiDAR into their vehicle platforms.
- Technological Ecosystem: Robust development of AI, sensor fusion, and mapping technologies that complement LiDAR.
Dominance Factors for ADAS Application:
- Safety Mandates: Increasing global safety regulations pushing for advanced driver-assistance features.
- Consumer Demand for Safety: Growing consumer awareness and preference for vehicles equipped with enhanced safety systems.
- Cost-Effectiveness for Current Deployments: ADAS applications offer a more immediate return on investment for LiDAR manufacturers compared to full autonomy.
Ascendancy of Solid State Lidar:
- Cost Reduction: Path to mass-market affordability through scalable manufacturing processes.
- Improved Reliability and Durability: Absence of moving parts leads to greater robustness in harsh automotive environments.
- Compact Form Factors: Enables seamless integration into vehicle design, maintaining aesthetic appeal.
- Enhanced Performance Potential: Continuous advancements in resolution, range, and field of view.
Auto Grade LiDAR Scanner Product Innovations
Recent product innovations in auto-grade LiDAR scanners are revolutionizing their capabilities and market applicability. Companies are focusing on developing LiDAR systems with extended detection ranges exceeding 300 meters for high-speed driving scenarios, alongside ultra-high resolutions that generate incredibly detailed point clouds, crucial for object classification and precise localization. Innovations also include wider fields of view, enabling near 360-degree environmental perception with fewer sensors, and advancements in FMCW (Frequency Modulated Continuous Wave) LiDAR, which offers superior interference immunity and velocity measurement. The unique selling proposition lies in achieving this enhanced performance at significantly reduced cost points, making widespread automotive adoption economically feasible. Technological advancements are pushing towards solid-state architectures for enhanced durability and miniaturization, ensuring seamless integration into vehicle designs.
Propelling Factors for Auto Grade LiDAR Scanner Growth
The auto-grade LiDAR scanner market is experiencing robust growth driven by several interconnected factors.
- Technological Advancements: Continuous improvements in resolution, range, field of view, and cost-effectiveness of LiDAR sensors are making them increasingly viable for mass-market automotive applications.
- Increasing Demand for ADAS and Autonomous Driving: Growing consumer desire for enhanced vehicle safety, comfort, and the eventual realization of fully autonomous driving capabilities are primary market drivers.
- Supportive Regulatory Environment: Evolving government regulations and initiatives promoting the development and deployment of autonomous vehicle technologies are creating a favorable ecosystem.
- Investments and Partnerships: Significant investments from automotive OEMs, Tier-1 suppliers, and venture capitalists, coupled with strategic partnerships, are accelerating innovation and market penetration.
Obstacles in the Auto Grade LiDAR Scanner Market
Despite its promising growth, the auto-grade LiDAR scanner market faces several significant obstacles.
- High Cost of Production: While decreasing, the cost of high-performance LiDAR units remains a barrier to entry for some mass-market vehicle segments.
- Regulatory Hurdles and Standardization: The absence of universally agreed-upon standards for autonomous driving safety and LiDAR performance can slow down widespread adoption and interoperability.
- Supply Chain Complexities: Ensuring a stable and scalable supply chain for critical components, especially in the face of global demand fluctuations and geopolitical uncertainties, poses a challenge.
- Perception of Reliability and Durability: Continuous efforts are needed to fully convince all stakeholders of the long-term reliability and durability of LiDAR systems in diverse environmental conditions.
Future Opportunities in Auto Grade LiDAR Scanner
The auto-grade LiDAR scanner market is ripe with emerging opportunities. The increasing adoption of LiDAR in advanced ADAS features beyond Level 2, such as Level 3 and Level 4 autonomous driving, presents a significant growth avenue. Emerging markets in developing economies are poised to become key regions as automotive manufacturers introduce more affordable autonomous features. Advancements in solid-state LiDAR, particularly MEMS and flash LiDAR, offer further opportunities for cost reduction and performance enhancement. The development of integrated sensor suites that combine LiDAR with cameras and radar for superior sensor fusion is another promising area. Furthermore, the expansion of LiDAR applications into adjacent sectors like intelligent transportation systems and commercial vehicle autonomy offers diversified growth potential.
Major Players in the Auto Grade LiDAR Scanner Ecosystem
- Hesai Tech
- Valeo
- RoboSense
- Luminar
- Continental
- Velodyne
- Ouster
- Livox
- Innoviz
- Cepton
- Aeva
Key Developments in Auto Grade LiDAR Scanner Industry
- 2023/2024: Significant breakthroughs in solid-state LiDAR technology, leading to improved resolution and reduced manufacturing costs, making them more competitive with mechanical LiDAR.
- 2023/2024: Increased number of automotive OEMs announcing partnerships and integration plans for LiDAR in upcoming vehicle models, particularly for L2+ and L3 autonomous driving capabilities.
- 2023/2024: Growing trend of LiDAR manufacturers acquiring or merging with companies specializing in complementary technologies like sensor fusion and AI, to offer more comprehensive solutions.
- 2023/2024: Launch of new FMCW LiDAR systems offering enhanced performance in terms of velocity measurement and interference rejection, addressing key limitations of traditional TOF LiDAR.
- 2022/2023: Intensified focus on cost reduction strategies and scaling up production to meet the anticipated surge in demand as autonomous features become more mainstream.
Strategic Auto Grade LiDAR Scanner Market Forecast
The strategic auto-grade LiDAR scanner market forecast is exceptionally positive, driven by an accelerating demand for enhanced automotive safety and the relentless pursuit of autonomous driving. Projections indicate a substantial market expansion, with LiDAR becoming an indispensable component in future vehicles. Key growth catalysts include the maturation and widespread adoption of solid-state LiDAR technologies, which promise significant cost reductions and performance improvements. Government mandates for advanced safety features and the increasing consumer acceptance of ADAS technologies will continue to fuel market penetration. Strategic investments, technological collaborations, and the development of scalable manufacturing processes are poised to unlock new market segments and accelerate the transition towards fully autonomous mobility solutions. The market is expected to witness significant growth from 2025 to 2033, driven by innovation and increasing integration across the automotive spectrum.
Auto Grade LiDAR Scanner Segmentation
-
1. Application
- 1.1. ADAS
- 1.2. Self-driving
-
2. Types
- 2.1. Solid State Lidar
- 2.2. Mechanical Lidar
Auto Grade LiDAR Scanner Segmentation By Geography
-
1. North America
- 1.1. United States
- 1.2. Canada
- 1.3. Mexico
-
2. South America
- 2.1. Brazil
- 2.2. Argentina
- 2.3. Rest of South America
-
3. Europe
- 3.1. United Kingdom
- 3.2. Germany
- 3.3. France
- 3.4. Italy
- 3.5. Spain
- 3.6. Russia
- 3.7. Benelux
- 3.8. Nordics
- 3.9. Rest of Europe
-
4. Middle East & Africa
- 4.1. Turkey
- 4.2. Israel
- 4.3. GCC
- 4.4. North Africa
- 4.5. South Africa
- 4.6. Rest of Middle East & Africa
-
5. Asia Pacific
- 5.1. China
- 5.2. India
- 5.3. Japan
- 5.4. South Korea
- 5.5. ASEAN
- 5.6. Oceania
- 5.7. Rest of Asia Pacific
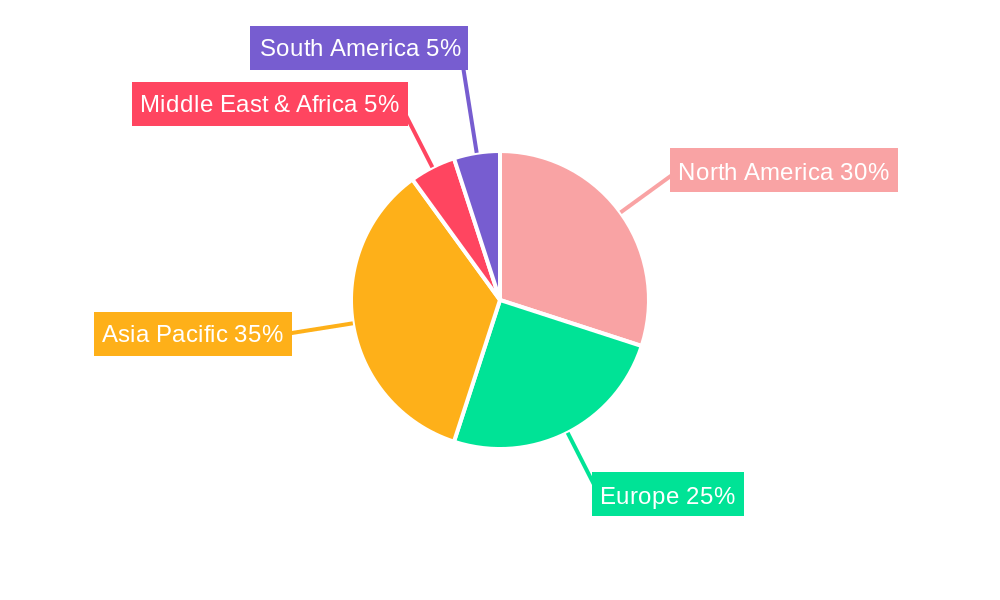
Auto Grade LiDAR Scanner Regional Market Share
Geographic Coverage of Auto Grade LiDAR Scanner
Auto Grade LiDAR Scanner REPORT HIGHLIGHTS
| Aspects | Details |
|---|---|
| Study Period | 2020-2034 |
| Base Year | 2025 |
| Estimated Year | 2026 |
| Forecast Period | 2026-2034 |
| Historical Period | 2020-2025 |
| Growth Rate | CAGR of 17.58% from 2020-2034 |
| Segmentation |
|
Table of Contents
- 1. Introduction
- 1.1. Research Scope
- 1.2. Market Segmentation
- 1.3. Research Methodology
- 1.4. Definitions and Assumptions
- 2. Executive Summary
- 2.1. Introduction
- 3. Market Dynamics
- 3.1. Introduction
- 3.2. Market Drivers
- 3.3. Market Restrains
- 3.4. Market Trends
- 4. Market Factor Analysis
- 4.1. Porters Five Forces
- 4.2. Supply/Value Chain
- 4.3. PESTEL analysis
- 4.4. Market Entropy
- 4.5. Patent/Trademark Analysis
- 5. Global Auto Grade LiDAR Scanner Analysis, Insights and Forecast, 2020-2032
- 5.1. Market Analysis, Insights and Forecast - by Application
- 5.1.1. ADAS
- 5.1.2. Self-driving
- 5.2. Market Analysis, Insights and Forecast - by Types
- 5.2.1. Solid State Lidar
- 5.2.2. Mechanical Lidar
- 5.3. Market Analysis, Insights and Forecast - by Region
- 5.3.1. North America
- 5.3.2. South America
- 5.3.3. Europe
- 5.3.4. Middle East & Africa
- 5.3.5. Asia Pacific
- 5.1. Market Analysis, Insights and Forecast - by Application
- 6. North America Auto Grade LiDAR Scanner Analysis, Insights and Forecast, 2020-2032
- 6.1. Market Analysis, Insights and Forecast - by Application
- 6.1.1. ADAS
- 6.1.2. Self-driving
- 6.2. Market Analysis, Insights and Forecast - by Types
- 6.2.1. Solid State Lidar
- 6.2.2. Mechanical Lidar
- 6.1. Market Analysis, Insights and Forecast - by Application
- 7. South America Auto Grade LiDAR Scanner Analysis, Insights and Forecast, 2020-2032
- 7.1. Market Analysis, Insights and Forecast - by Application
- 7.1.1. ADAS
- 7.1.2. Self-driving
- 7.2. Market Analysis, Insights and Forecast - by Types
- 7.2.1. Solid State Lidar
- 7.2.2. Mechanical Lidar
- 7.1. Market Analysis, Insights and Forecast - by Application
- 8. Europe Auto Grade LiDAR Scanner Analysis, Insights and Forecast, 2020-2032
- 8.1. Market Analysis, Insights and Forecast - by Application
- 8.1.1. ADAS
- 8.1.2. Self-driving
- 8.2. Market Analysis, Insights and Forecast - by Types
- 8.2.1. Solid State Lidar
- 8.2.2. Mechanical Lidar
- 8.1. Market Analysis, Insights and Forecast - by Application
- 9. Middle East & Africa Auto Grade LiDAR Scanner Analysis, Insights and Forecast, 2020-2032
- 9.1. Market Analysis, Insights and Forecast - by Application
- 9.1.1. ADAS
- 9.1.2. Self-driving
- 9.2. Market Analysis, Insights and Forecast - by Types
- 9.2.1. Solid State Lidar
- 9.2.2. Mechanical Lidar
- 9.1. Market Analysis, Insights and Forecast - by Application
- 10. Asia Pacific Auto Grade LiDAR Scanner Analysis, Insights and Forecast, 2020-2032
- 10.1. Market Analysis, Insights and Forecast - by Application
- 10.1.1. ADAS
- 10.1.2. Self-driving
- 10.2. Market Analysis, Insights and Forecast - by Types
- 10.2.1. Solid State Lidar
- 10.2.2. Mechanical Lidar
- 10.1. Market Analysis, Insights and Forecast - by Application
- 11. Competitive Analysis
- 11.1. Global Market Share Analysis 2025
- 11.2. Company Profiles
- 11.2.1 Hesai Tech
- 11.2.1.1. Overview
- 11.2.1.2. Products
- 11.2.1.3. SWOT Analysis
- 11.2.1.4. Recent Developments
- 11.2.1.5. Financials (Based on Availability)
- 11.2.2 Valeo
- 11.2.2.1. Overview
- 11.2.2.2. Products
- 11.2.2.3. SWOT Analysis
- 11.2.2.4. Recent Developments
- 11.2.2.5. Financials (Based on Availability)
- 11.2.3 RoboSense
- 11.2.3.1. Overview
- 11.2.3.2. Products
- 11.2.3.3. SWOT Analysis
- 11.2.3.4. Recent Developments
- 11.2.3.5. Financials (Based on Availability)
- 11.2.4 Luminar
- 11.2.4.1. Overview
- 11.2.4.2. Products
- 11.2.4.3. SWOT Analysis
- 11.2.4.4. Recent Developments
- 11.2.4.5. Financials (Based on Availability)
- 11.2.5 Continental
- 11.2.5.1. Overview
- 11.2.5.2. Products
- 11.2.5.3. SWOT Analysis
- 11.2.5.4. Recent Developments
- 11.2.5.5. Financials (Based on Availability)
- 11.2.6 Velodyne
- 11.2.6.1. Overview
- 11.2.6.2. Products
- 11.2.6.3. SWOT Analysis
- 11.2.6.4. Recent Developments
- 11.2.6.5. Financials (Based on Availability)
- 11.2.7 Ouster
- 11.2.7.1. Overview
- 11.2.7.2. Products
- 11.2.7.3. SWOT Analysis
- 11.2.7.4. Recent Developments
- 11.2.7.5. Financials (Based on Availability)
- 11.2.8 Livox
- 11.2.8.1. Overview
- 11.2.8.2. Products
- 11.2.8.3. SWOT Analysis
- 11.2.8.4. Recent Developments
- 11.2.8.5. Financials (Based on Availability)
- 11.2.9 Innoviz
- 11.2.9.1. Overview
- 11.2.9.2. Products
- 11.2.9.3. SWOT Analysis
- 11.2.9.4. Recent Developments
- 11.2.9.5. Financials (Based on Availability)
- 11.2.10 Cepton
- 11.2.10.1. Overview
- 11.2.10.2. Products
- 11.2.10.3. SWOT Analysis
- 11.2.10.4. Recent Developments
- 11.2.10.5. Financials (Based on Availability)
- 11.2.11 Aeva
- 11.2.11.1. Overview
- 11.2.11.2. Products
- 11.2.11.3. SWOT Analysis
- 11.2.11.4. Recent Developments
- 11.2.11.5. Financials (Based on Availability)
- 11.2.1 Hesai Tech
List of Figures
- Figure 1: Global Auto Grade LiDAR Scanner Revenue Breakdown (undefined, %) by Region 2025 & 2033
- Figure 2: North America Auto Grade LiDAR Scanner Revenue (undefined), by Application 2025 & 2033
- Figure 3: North America Auto Grade LiDAR Scanner Revenue Share (%), by Application 2025 & 2033
- Figure 4: North America Auto Grade LiDAR Scanner Revenue (undefined), by Types 2025 & 2033
- Figure 5: North America Auto Grade LiDAR Scanner Revenue Share (%), by Types 2025 & 2033
- Figure 6: North America Auto Grade LiDAR Scanner Revenue (undefined), by Country 2025 & 2033
- Figure 7: North America Auto Grade LiDAR Scanner Revenue Share (%), by Country 2025 & 2033
- Figure 8: South America Auto Grade LiDAR Scanner Revenue (undefined), by Application 2025 & 2033
- Figure 9: South America Auto Grade LiDAR Scanner Revenue Share (%), by Application 2025 & 2033
- Figure 10: South America Auto Grade LiDAR Scanner Revenue (undefined), by Types 2025 & 2033
- Figure 11: South America Auto Grade LiDAR Scanner Revenue Share (%), by Types 2025 & 2033
- Figure 12: South America Auto Grade LiDAR Scanner Revenue (undefined), by Country 2025 & 2033
- Figure 13: South America Auto Grade LiDAR Scanner Revenue Share (%), by Country 2025 & 2033
- Figure 14: Europe Auto Grade LiDAR Scanner Revenue (undefined), by Application 2025 & 2033
- Figure 15: Europe Auto Grade LiDAR Scanner Revenue Share (%), by Application 2025 & 2033
- Figure 16: Europe Auto Grade LiDAR Scanner Revenue (undefined), by Types 2025 & 2033
- Figure 17: Europe Auto Grade LiDAR Scanner Revenue Share (%), by Types 2025 & 2033
- Figure 18: Europe Auto Grade LiDAR Scanner Revenue (undefined), by Country 2025 & 2033
- Figure 19: Europe Auto Grade LiDAR Scanner Revenue Share (%), by Country 2025 & 2033
- Figure 20: Middle East & Africa Auto Grade LiDAR Scanner Revenue (undefined), by Application 2025 & 2033
- Figure 21: Middle East & Africa Auto Grade LiDAR Scanner Revenue Share (%), by Application 2025 & 2033
- Figure 22: Middle East & Africa Auto Grade LiDAR Scanner Revenue (undefined), by Types 2025 & 2033
- Figure 23: Middle East & Africa Auto Grade LiDAR Scanner Revenue Share (%), by Types 2025 & 2033
- Figure 24: Middle East & Africa Auto Grade LiDAR Scanner Revenue (undefined), by Country 2025 & 2033
- Figure 25: Middle East & Africa Auto Grade LiDAR Scanner Revenue Share (%), by Country 2025 & 2033
- Figure 26: Asia Pacific Auto Grade LiDAR Scanner Revenue (undefined), by Application 2025 & 2033
- Figure 27: Asia Pacific Auto Grade LiDAR Scanner Revenue Share (%), by Application 2025 & 2033
- Figure 28: Asia Pacific Auto Grade LiDAR Scanner Revenue (undefined), by Types 2025 & 2033
- Figure 29: Asia Pacific Auto Grade LiDAR Scanner Revenue Share (%), by Types 2025 & 2033
- Figure 30: Asia Pacific Auto Grade LiDAR Scanner Revenue (undefined), by Country 2025 & 2033
- Figure 31: Asia Pacific Auto Grade LiDAR Scanner Revenue Share (%), by Country 2025 & 2033
List of Tables
- Table 1: Global Auto Grade LiDAR Scanner Revenue undefined Forecast, by Application 2020 & 2033
- Table 2: Global Auto Grade LiDAR Scanner Revenue undefined Forecast, by Types 2020 & 2033
- Table 3: Global Auto Grade LiDAR Scanner Revenue undefined Forecast, by Region 2020 & 2033
- Table 4: Global Auto Grade LiDAR Scanner Revenue undefined Forecast, by Application 2020 & 2033
- Table 5: Global Auto Grade LiDAR Scanner Revenue undefined Forecast, by Types 2020 & 2033
- Table 6: Global Auto Grade LiDAR Scanner Revenue undefined Forecast, by Country 2020 & 2033
- Table 7: United States Auto Grade LiDAR Scanner Revenue (undefined) Forecast, by Application 2020 & 2033
- Table 8: Canada Auto Grade LiDAR Scanner Revenue (undefined) Forecast, by Application 2020 & 2033
- Table 9: Mexico Auto Grade LiDAR Scanner Revenue (undefined) Forecast, by Application 2020 & 2033
- Table 10: Global Auto Grade LiDAR Scanner Revenue undefined Forecast, by Application 2020 & 2033
- Table 11: Global Auto Grade LiDAR Scanner Revenue undefined Forecast, by Types 2020 & 2033
- Table 12: Global Auto Grade LiDAR Scanner Revenue undefined Forecast, by Country 2020 & 2033
- Table 13: Brazil Auto Grade LiDAR Scanner Revenue (undefined) Forecast, by Application 2020 & 2033
- Table 14: Argentina Auto Grade LiDAR Scanner Revenue (undefined) Forecast, by Application 2020 & 2033
- Table 15: Rest of South America Auto Grade LiDAR Scanner Revenue (undefined) Forecast, by Application 2020 & 2033
- Table 16: Global Auto Grade LiDAR Scanner Revenue undefined Forecast, by Application 2020 & 2033
- Table 17: Global Auto Grade LiDAR Scanner Revenue undefined Forecast, by Types 2020 & 2033
- Table 18: Global Auto Grade LiDAR Scanner Revenue undefined Forecast, by Country 2020 & 2033
- Table 19: United Kingdom Auto Grade LiDAR Scanner Revenue (undefined) Forecast, by Application 2020 & 2033
- Table 20: Germany Auto Grade LiDAR Scanner Revenue (undefined) Forecast, by Application 2020 & 2033
- Table 21: France Auto Grade LiDAR Scanner Revenue (undefined) Forecast, by Application 2020 & 2033
- Table 22: Italy Auto Grade LiDAR Scanner Revenue (undefined) Forecast, by Application 2020 & 2033
- Table 23: Spain Auto Grade LiDAR Scanner Revenue (undefined) Forecast, by Application 2020 & 2033
- Table 24: Russia Auto Grade LiDAR Scanner Revenue (undefined) Forecast, by Application 2020 & 2033
- Table 25: Benelux Auto Grade LiDAR Scanner Revenue (undefined) Forecast, by Application 2020 & 2033
- Table 26: Nordics Auto Grade LiDAR Scanner Revenue (undefined) Forecast, by Application 2020 & 2033
- Table 27: Rest of Europe Auto Grade LiDAR Scanner Revenue (undefined) Forecast, by Application 2020 & 2033
- Table 28: Global Auto Grade LiDAR Scanner Revenue undefined Forecast, by Application 2020 & 2033
- Table 29: Global Auto Grade LiDAR Scanner Revenue undefined Forecast, by Types 2020 & 2033
- Table 30: Global Auto Grade LiDAR Scanner Revenue undefined Forecast, by Country 2020 & 2033
- Table 31: Turkey Auto Grade LiDAR Scanner Revenue (undefined) Forecast, by Application 2020 & 2033
- Table 32: Israel Auto Grade LiDAR Scanner Revenue (undefined) Forecast, by Application 2020 & 2033
- Table 33: GCC Auto Grade LiDAR Scanner Revenue (undefined) Forecast, by Application 2020 & 2033
- Table 34: North Africa Auto Grade LiDAR Scanner Revenue (undefined) Forecast, by Application 2020 & 2033
- Table 35: South Africa Auto Grade LiDAR Scanner Revenue (undefined) Forecast, by Application 2020 & 2033
- Table 36: Rest of Middle East & Africa Auto Grade LiDAR Scanner Revenue (undefined) Forecast, by Application 2020 & 2033
- Table 37: Global Auto Grade LiDAR Scanner Revenue undefined Forecast, by Application 2020 & 2033
- Table 38: Global Auto Grade LiDAR Scanner Revenue undefined Forecast, by Types 2020 & 2033
- Table 39: Global Auto Grade LiDAR Scanner Revenue undefined Forecast, by Country 2020 & 2033
- Table 40: China Auto Grade LiDAR Scanner Revenue (undefined) Forecast, by Application 2020 & 2033
- Table 41: India Auto Grade LiDAR Scanner Revenue (undefined) Forecast, by Application 2020 & 2033
- Table 42: Japan Auto Grade LiDAR Scanner Revenue (undefined) Forecast, by Application 2020 & 2033
- Table 43: South Korea Auto Grade LiDAR Scanner Revenue (undefined) Forecast, by Application 2020 & 2033
- Table 44: ASEAN Auto Grade LiDAR Scanner Revenue (undefined) Forecast, by Application 2020 & 2033
- Table 45: Oceania Auto Grade LiDAR Scanner Revenue (undefined) Forecast, by Application 2020 & 2033
- Table 46: Rest of Asia Pacific Auto Grade LiDAR Scanner Revenue (undefined) Forecast, by Application 2020 & 2033
Frequently Asked Questions
1. What is the projected Compound Annual Growth Rate (CAGR) of the Auto Grade LiDAR Scanner?
The projected CAGR is approximately 17.58%.
2. Which companies are prominent players in the Auto Grade LiDAR Scanner?
Key companies in the market include Hesai Tech, Valeo, RoboSense, Luminar, Continental, Velodyne, Ouster, Livox, Innoviz, Cepton, Aeva.
3. What are the main segments of the Auto Grade LiDAR Scanner?
The market segments include Application, Types.
4. Can you provide details about the market size?
The market size is estimated to be USD XXX N/A as of 2022.
5. What are some drivers contributing to market growth?
N/A
6. What are the notable trends driving market growth?
N/A
7. Are there any restraints impacting market growth?
N/A
8. Can you provide examples of recent developments in the market?
N/A
9. What pricing options are available for accessing the report?
Pricing options include single-user, multi-user, and enterprise licenses priced at USD 4900.00, USD 7350.00, and USD 9800.00 respectively.
10. Is the market size provided in terms of value or volume?
The market size is provided in terms of value, measured in N/A.
11. Are there any specific market keywords associated with the report?
Yes, the market keyword associated with the report is "Auto Grade LiDAR Scanner," which aids in identifying and referencing the specific market segment covered.
12. How do I determine which pricing option suits my needs best?
The pricing options vary based on user requirements and access needs. Individual users may opt for single-user licenses, while businesses requiring broader access may choose multi-user or enterprise licenses for cost-effective access to the report.
13. Are there any additional resources or data provided in the Auto Grade LiDAR Scanner report?
While the report offers comprehensive insights, it's advisable to review the specific contents or supplementary materials provided to ascertain if additional resources or data are available.
14. How can I stay updated on further developments or reports in the Auto Grade LiDAR Scanner?
To stay informed about further developments, trends, and reports in the Auto Grade LiDAR Scanner, consider subscribing to industry newsletters, following relevant companies and organizations, or regularly checking reputable industry news sources and publications.
Methodology
Step 1 - Identification of Relevant Samples Size from Population Database


Step 2 - Approaches for Defining Global Market Size (Value, Volume* & Price*)

Note*: In applicable scenarios
Step 3 - Data Sources
Primary Research
- Web Analytics
- Survey Reports
- Research Institute
- Latest Research Reports
- Opinion Leaders
Secondary Research
- Annual Reports
- White Paper
- Latest Press Release
- Industry Association
- Paid Database
- Investor Presentations

Step 4 - Data Triangulation
Involves using different sources of information in order to increase the validity of a study
These sources are likely to be stakeholders in a program - participants, other researchers, program staff, other community members, and so on.
Then we put all data in single framework & apply various statistical tools to find out the dynamic on the market.
During the analysis stage, feedback from the stakeholder groups would be compared to determine areas of agreement as well as areas of divergence