

Key Insights
The Asia-Pacific (APAC) wireless charging market is experiencing robust expansion, driven by the escalating adoption of electric vehicles (EVs) and a growing consumer preference for convenient charging solutions. The market is projected to reach a size of 24.4 billion by 2025, with a Compound Annual Growth Rate (CAGR) of 36.2% from the base year of 2025. Key growth catalysts include increased EV penetration in key markets such as China, Japan, and India; technological advancements enhancing charging efficiency and power delivery; and supportive government policies promoting EV infrastructure development. Significant investments from leading automotive manufacturers like Tesla, Toyota, and BMW, alongside technology innovators such as Qualcomm and WiTricity, are further propelling market momentum. While challenges like standardization complexities and initial cost premiums persist, the inherent advantages of wireless charging, including enhanced user experience and simplified infrastructure, are expected to drive sustained market growth.
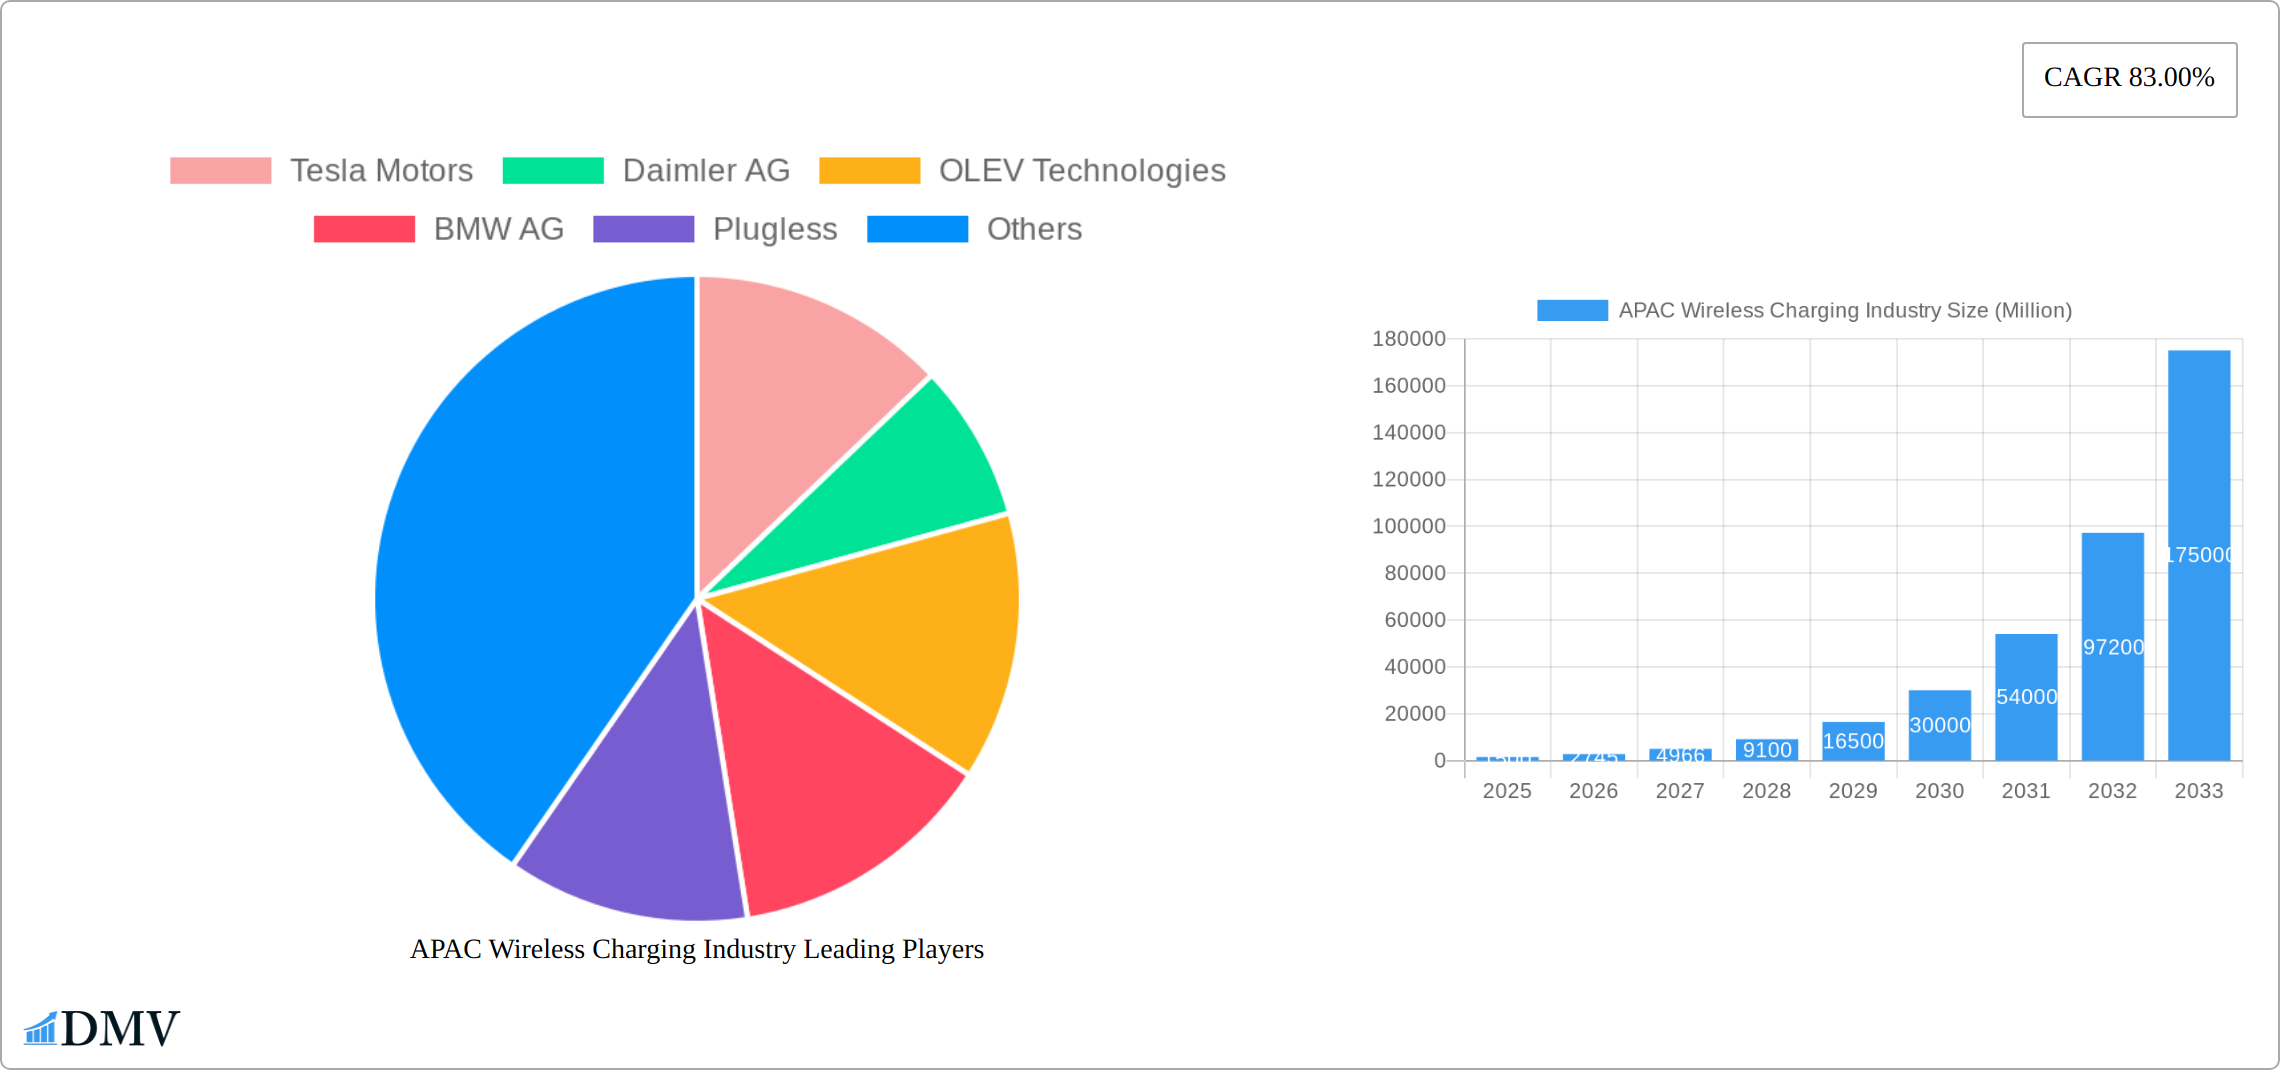
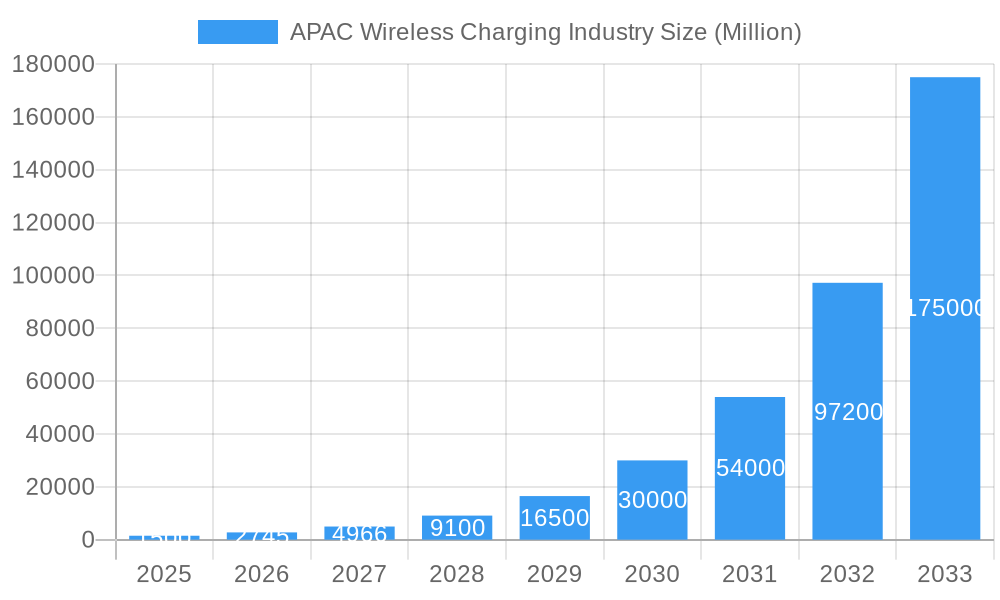
APAC Wireless Charging Industry Market Size (In Billion)
The market's significant growth trajectory is anticipated to continue beyond 2025. This expansion will be fueled by ongoing technological refinements, heightened consumer awareness, and continued governmental backing for EV adoption and charging infrastructure. The presence of a diverse array of industry players underscores a dynamic and competitive environment, fostering continuous innovation and market penetration. Regional growth dynamics will be shaped by localized government incentives, the pace of charging infrastructure deployment, and consumer adoption patterns. Strategic focus on improving charging efficiency, reducing costs, and achieving industry-wide technological standardization will be paramount to sustaining this impressive growth trend.
APAC Wireless Charging Industry Company Market Share
APAC Wireless Charging Industry Market Composition & Trends
This comprehensive report provides a detailed analysis of the dynamic APAC wireless charging market from 2019 to 2033, encompassing the historical period (2019-2024), the base year (2025), and the forecast period (2025-2033). The report offers a granular examination of market composition, evolving trends, and key factors influencing its growth trajectory. We dissect market concentration, identifying major players and their respective market share distribution, highlighting the competitive landscape and its evolution. Furthermore, the report explores the innovation drivers propelling market expansion, including advancements in wireless power transfer (WPT) technologies, the surging demand for electric vehicles (EVs), and evolving consumer preferences. A thorough analysis of the regulatory landscape across key APAC nations – including China, Japan, India, and Australia – reveals its significant impact on market dynamics and adoption rates. The study also investigates substitute products, profiles end-users (Battery Electric Vehicles (BEVs) and Plug-in Hybrid Vehicles (PHEVs)), and analyzes significant mergers and acquisitions (M&A) activities, including estimated deal values, providing invaluable insights into strategic investments and market consolidation. The competitive dynamics are deeply examined, focusing on the influence of key players like Tesla Motors, Daimler AG, and Qualcomm, and offering projections for future market evolution. Specific data points, such as precise market share percentages and M&A deal values, will be provided in the full report.
- Market Concentration: A precise analysis of market share distribution among key players, revealing dominant entities and competitive intensity. [Insert precise percentage here]% of the market is controlled by the top 5 players in 2025. The report will detail the competitive strategies employed by these key players.
- Innovation Catalysts: A detailed exploration of technological advancements, such as increased charging efficiency, higher power output, improved range, and enhanced integration with vehicle systems, fueling market growth. The report will feature case studies of successful innovations.
- Regulatory Landscape: A comprehensive assessment of government policies and regulations impacting the adoption of wireless charging across various APAC nations, including an analysis of supportive policies and potential regulatory hurdles.
- Substitute Products: An examination of alternative charging technologies and their potential impact on the market share of wireless charging, comparing their respective advantages and disadvantages.
- End-User Profiles: Detailed segmentation based on vehicle type (BEVs and PHEVs), revealing the preferred application of wireless charging technology and its penetration rate within each segment.
- M&A Activities: Analysis of significant mergers and acquisitions, including deal values and their implications for market consolidation. [Insert precise value here] Million USD in M&A deals were recorded during 2019-2024. The strategic rationale behind key acquisitions will be discussed.
APAC Wireless Charging Industry Industry Evolution
The APAC wireless charging industry is experiencing a period of rapid evolution, driven by several interconnected factors. From 2019 to 2024, the market witnessed a Compound Annual Growth Rate (CAGR) of xx%, indicating robust growth. This growth trajectory is projected to continue during the forecast period (2025-2033), with an anticipated CAGR of xx%. Technological advancements, such as improvements in efficiency and range, are critical drivers of market expansion. The increasing adoption of electric vehicles (EVs) across the region further fuels demand for convenient and efficient charging solutions. Shifting consumer preferences towards seamless and user-friendly charging experiences are also contributing to the market's upward trend. The report analyzes these trends in detail, providing data points such as growth rates for different vehicle segments and adoption metrics across key countries. The rising popularity of wireless charging in both public and private spaces is discussed, along with the role of government initiatives promoting EV adoption. The evolution of wireless charging standards and their impact on interoperability are also examined. The influence of key players, such as Tesla Motors, BMW AG, and others in driving innovation and market penetration, is assessed. Furthermore, the report looks at the impact of technological breakthroughs such as improvements in charging efficiency and power transfer capabilities, as well as the increasing integration of wireless charging with advanced driver-assistance systems (ADAS) features in modern vehicles.
Leading Regions, Countries, or Segments in APAC Wireless Charging Industry
China dominates the APAC wireless charging market, driven by substantial government investments in EV infrastructure and a large and rapidly growing EV market. Japan follows closely, benefiting from technological advancements and a strong automotive industry. India and Australia show promising growth potential, although their market share remains smaller compared to China and Japan. The Rest of Asia-Pacific also contributes significantly.
- Key Drivers for China's Dominance:
- Massive investments in EV infrastructure development.
- Stringent government regulations promoting EV adoption.
- Large and expanding domestic EV market.
- Robust technological advancements in wireless charging solutions.
- Key Drivers for Japan's Strong Performance:
- Technological advancements and innovation in wireless power transfer technology.
- Strong domestic automotive industry with leading players adopting wireless charging.
- Government support for renewable energy and electric vehicle infrastructure.
The Battery Electric Vehicle (BEV) segment holds the largest market share, reflecting the increasing popularity of fully electric vehicles. However, Plug-in Hybrid Vehicles (PHEVs) are also experiencing substantial growth, indicating a broader adoption of wireless charging technology across various vehicle types. The report provides a detailed analysis of each segment's market dynamics, highlighting the factors contributing to their growth and identifying potential future trends.
APAP Wireless Charging Industry Product Innovations
Recent innovations in APAC wireless charging include higher-power solutions (e.g., ST Microelectronics' 100W Wireless Charging Solution), improved efficiency, and the integration of advanced features such as smart charging management and contactless payment capabilities. These advancements are enhancing the user experience and expanding the applications of wireless charging, from personal devices to electric vehicles and beyond. Furthermore, miniaturization efforts are leading to more compact and integrated charging systems, enabling seamless integration into various devices and vehicles. The unique selling propositions of different wireless charging technologies are also highlighted, focusing on factors such as range, efficiency, and power output.
Propelling Factors for APAC Wireless Charging Industry Growth
Several factors are driving the growth of the APAC wireless charging industry. Technological advancements, including increased efficiency and charging speeds, are making wireless charging a more viable alternative to traditional wired methods. The rising adoption of electric vehicles (EVs) across the region significantly boosts demand for convenient and efficient charging solutions. Government incentives and regulations promoting the adoption of EVs are also creating favorable market conditions. For example, the Malaysian government's support for certification and verification processes related to wireless charging systems (as seen in the May 2023 MITI announcement) exemplifies this trend. Further growth is driven by the continuous decrease in the cost of wireless charging technology, making it more accessible to a wider range of consumers.
Obstacles in the APAC Wireless Charging Industry Market
Despite the significant growth potential, the APAC wireless charging market faces several challenges. Regulatory inconsistencies across different countries can create barriers to standardization and widespread adoption. Supply chain disruptions, particularly those impacting the availability of key components, can impact production and lead to higher costs. Furthermore, intense competition among established players and new entrants can limit profit margins and hinder market penetration for some companies. The need for robust infrastructure to support widespread adoption also poses a significant obstacle.
Future Opportunities in APAC Wireless Charging Industry
Future opportunities in the APAC wireless charging industry lie in expanding into new markets, particularly those with rapidly growing EV adoption rates. The development of new technologies, such as high-power and long-range wireless charging solutions, will further fuel market expansion. Emerging consumer trends towards more convenient and seamless charging experiences will continue to drive demand. The integration of wireless charging with smart homes and other IoT devices presents additional opportunities for growth.
Major Players in the APAC Wireless Charging Industry Ecosystem
- Tesla Motors Tesla Motors
- Daimler AG Daimler AG
- OLEV Technologies
- BMW AG BMW AG
- Plugless
- Bombardier
- Toyota Motor Corporation Toyota Motor Corporation
- Nissan Nissan
- Hella Aglaia
- HEVO Powe
- WiTricity WiTricity
- Qualcomm Qualcomm
Key Developments in APAC Wireless Charging Industry Industry
- June 2023: ST Microelectronics NV unveiled its 100W Wireless Charging Solution, showcasing significant advancements in wireless power transfer technology.
- June 2023: SAIC-GM launched the Buick Electra E5, featuring industry-first wireless connectivity and battery management system, driving the adoption of wireless charging in vehicles.
- May 2023: EVE Energy's USD 422.3 Million investment in Malaysia signals increasing commitment to wireless charging infrastructure development in the region. Malaysian government support for wireless charging system certification further facilitates market growth.
Strategic APAC Wireless Charging Industry Market Forecast
The APAC wireless charging market is poised for significant growth in the coming years, fueled by continuous technological innovation, increasing EV adoption, and supportive government policies. The market's expansion will be driven by the increasing demand for convenient and efficient charging solutions in both consumer and commercial applications. New product launches, strategic partnerships, and ongoing investments in research and development will contribute to the market's long-term growth and expansion into new segments and applications. The forecast period will see a sustained rise in market value, driven primarily by the growth in both the BEV and PHEV sectors across various key countries within the APAC region.
APAC Wireless Charging Industry Segmentation
-
1. Vehicle Type
- 1.1. Battery Electric Vehicle
- 1.2. Plug-in Hybrid Vehicle
APAC Wireless Charging Industry Segmentation By Geography
-
1. North America
- 1.1. United States
- 1.2. Canada
- 1.3. Mexico
-
2. South America
- 2.1. Brazil
- 2.2. Argentina
- 2.3. Rest of South America
-
3. Europe
- 3.1. United Kingdom
- 3.2. Germany
- 3.3. France
- 3.4. Italy
- 3.5. Spain
- 3.6. Russia
- 3.7. Benelux
- 3.8. Nordics
- 3.9. Rest of Europe
-
4. Middle East & Africa
- 4.1. Turkey
- 4.2. Israel
- 4.3. GCC
- 4.4. North Africa
- 4.5. South Africa
- 4.6. Rest of Middle East & Africa
-
5. Asia Pacific
- 5.1. China
- 5.2. India
- 5.3. Japan
- 5.4. South Korea
- 5.5. ASEAN
- 5.6. Oceania
- 5.7. Rest of Asia Pacific
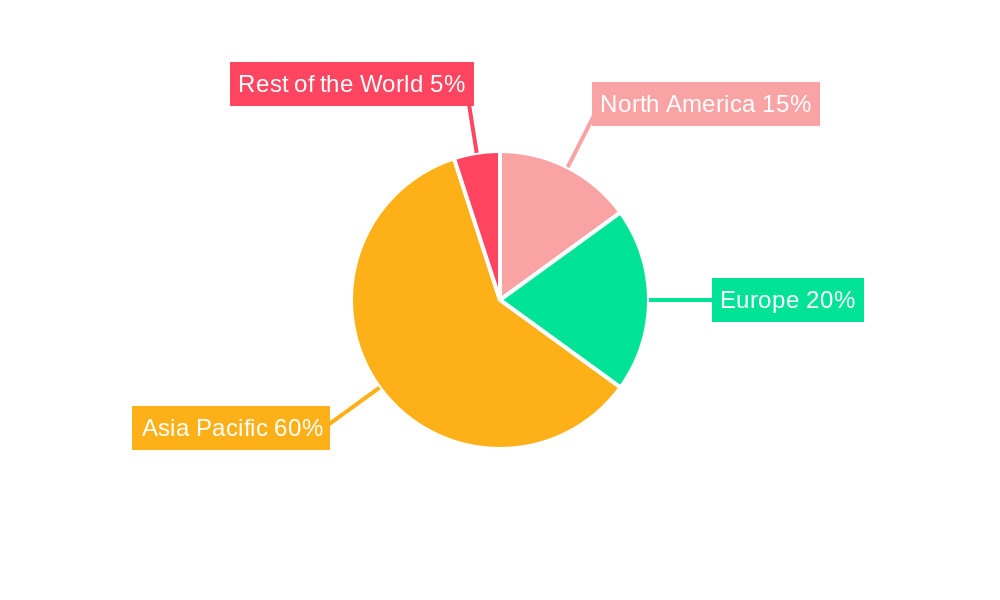
APAC Wireless Charging Industry Regional Market Share
Geographic Coverage of APAC Wireless Charging Industry
APAC Wireless Charging Industry REPORT HIGHLIGHTS
| Aspects | Details |
|---|---|
| Study Period | 2020-2034 |
| Base Year | 2025 |
| Estimated Year | 2026 |
| Forecast Period | 2026-2034 |
| Historical Period | 2020-2025 |
| Growth Rate | CAGR of 36.2% from 2020-2034 |
| Segmentation |
|
Table of Contents
- 1. Introduction
- 1.1. Research Scope
- 1.2. Market Segmentation
- 1.3. Research Objective
- 1.4. Definitions and Assumptions
- 2. Executive Summary
- 2.1. Market Snapshot
- 3. Market Dynamics
- 3.1. Market Drivers
- 3.2. Market Restrains
- 3.3. Market Trends
- 3.4. Market Opportunities
- 4. Market Factor Analysis
- 4.1. Porters Five Forces
- 4.1.1. Bargaining Power of Suppliers
- 4.1.2. Bargaining Power of Buyers
- 4.1.3. Threat of New Entrants
- 4.1.4. Threat of Substitutes
- 4.1.5. Competitive Rivalry
- 4.2. PESTEL analysis
- 4.3. BCG Analysis
- 4.3.1. Stars (High Growth, High Market Share)
- 4.3.2. Cash Cows (Low Growth, High Market Share)
- 4.3.3. Question Mark (High Growth, Low Market Share)
- 4.3.4. Dogs (Low Growth, Low Market Share)
- 4.4. Ansoff Matrix Analysis
- 4.5. Supply Chain Analysis
- 4.6. Regulatory Landscape
- 4.7. Current Market Potential and Opportunity Assessment (TAM–SAM–SOM Framework)
- 4.8. DMV Analyst Note
- 4.1. Porters Five Forces
- 5. Market Analysis, Insights and Forecast 2021-2033
- 5.1. Market Analysis, Insights and Forecast - by Vehicle Type
- 5.1.1. Battery Electric Vehicle
- 5.1.2. Plug-in Hybrid Vehicle
- 5.2. Market Analysis, Insights and Forecast - by Region
- 5.2.1. North America
- 5.2.2. South America
- 5.2.3. Europe
- 5.2.4. Middle East & Africa
- 5.2.5. Asia Pacific
- 5.1. Market Analysis, Insights and Forecast - by Vehicle Type
- 6. Global APAC Wireless Charging Industry Analysis, Insights and Forecast, 2021-2033
- 6.1. Market Analysis, Insights and Forecast - by Vehicle Type
- 6.1.1. Battery Electric Vehicle
- 6.1.2. Plug-in Hybrid Vehicle
- 6.1. Market Analysis, Insights and Forecast - by Vehicle Type
- 7. North America APAC Wireless Charging Industry Analysis, Insights and Forecast, 2020-2032
- 7.1. Market Analysis, Insights and Forecast - by Vehicle Type
- 7.1.1. Battery Electric Vehicle
- 7.1.2. Plug-in Hybrid Vehicle
- 7.1. Market Analysis, Insights and Forecast - by Vehicle Type
- 8. South America APAC Wireless Charging Industry Analysis, Insights and Forecast, 2020-2032
- 8.1. Market Analysis, Insights and Forecast - by Vehicle Type
- 8.1.1. Battery Electric Vehicle
- 8.1.2. Plug-in Hybrid Vehicle
- 8.1. Market Analysis, Insights and Forecast - by Vehicle Type
- 9. Europe APAC Wireless Charging Industry Analysis, Insights and Forecast, 2020-2032
- 9.1. Market Analysis, Insights and Forecast - by Vehicle Type
- 9.1.1. Battery Electric Vehicle
- 9.1.2. Plug-in Hybrid Vehicle
- 9.1. Market Analysis, Insights and Forecast - by Vehicle Type
- 10. Middle East & Africa APAC Wireless Charging Industry Analysis, Insights and Forecast, 2020-2032
- 10.1. Market Analysis, Insights and Forecast - by Vehicle Type
- 10.1.1. Battery Electric Vehicle
- 10.1.2. Plug-in Hybrid Vehicle
- 10.1. Market Analysis, Insights and Forecast - by Vehicle Type
- 11. Asia Pacific APAC Wireless Charging Industry Analysis, Insights and Forecast, 2020-2032
- 11.1. Market Analysis, Insights and Forecast - by Vehicle Type
- 11.1.1. Battery Electric Vehicle
- 11.1.2. Plug-in Hybrid Vehicle
- 11.1. Market Analysis, Insights and Forecast - by Vehicle Type
- 12. Competitive Analysis
- 12.1. Company Profiles
- 12.1.1 Tesla Motors
- 12.1.1.1. Company Overview
- 12.1.1.2. Products
- 12.1.1.3. Company Financials
- 12.1.1.4. SWOT Analysis
- 12.1.2 Daimler AG
- 12.1.2.1. Company Overview
- 12.1.2.2. Products
- 12.1.2.3. Company Financials
- 12.1.2.4. SWOT Analysis
- 12.1.3 OLEV Technologies
- 12.1.3.1. Company Overview
- 12.1.3.2. Products
- 12.1.3.3. Company Financials
- 12.1.3.4. SWOT Analysis
- 12.1.4 BMW AG
- 12.1.4.1. Company Overview
- 12.1.4.2. Products
- 12.1.4.3. Company Financials
- 12.1.4.4. SWOT Analysis
- 12.1.5 Plugless
- 12.1.5.1. Company Overview
- 12.1.5.2. Products
- 12.1.5.3. Company Financials
- 12.1.5.4. SWOT Analysis
- 12.1.6 Bombardier
- 12.1.6.1. Company Overview
- 12.1.6.2. Products
- 12.1.6.3. Company Financials
- 12.1.6.4. SWOT Analysis
- 12.1.7 Toyota Motor Corporation
- 12.1.7.1. Company Overview
- 12.1.7.2. Products
- 12.1.7.3. Company Financials
- 12.1.7.4. SWOT Analysis
- 12.1.8 Nissan
- 12.1.8.1. Company Overview
- 12.1.8.2. Products
- 12.1.8.3. Company Financials
- 12.1.8.4. SWOT Analysis
- 12.1.9 Hella Aglaia
- 12.1.9.1. Company Overview
- 12.1.9.2. Products
- 12.1.9.3. Company Financials
- 12.1.9.4. SWOT Analysis
- 12.1.10 HEVO Powe
- 12.1.10.1. Company Overview
- 12.1.10.2. Products
- 12.1.10.3. Company Financials
- 12.1.10.4. SWOT Analysis
- 12.1.11 WiTricity
- 12.1.11.1. Company Overview
- 12.1.11.2. Products
- 12.1.11.3. Company Financials
- 12.1.11.4. SWOT Analysis
- 12.1.12 Qualcomm
- 12.1.12.1. Company Overview
- 12.1.12.2. Products
- 12.1.12.3. Company Financials
- 12.1.12.4. SWOT Analysis
- 12.1.1 Tesla Motors
- 12.2. Market Entropy
- 12.2.1 Company's Key Areas Served
- 12.2.2 Recent Developments
- 12.3. Company Market Share Analysis 2025
- 12.3.1 Top 5 Companies Market Share Analysis
- 12.3.2 Top 3 Companies Market Share Analysis
- 12.4. List of Potential Customers
- 13. Research Methodology
List of Figures
- Figure 1: Global APAC Wireless Charging Industry Revenue Breakdown (billion, %) by Region 2025 & 2033
- Figure 2: North America APAC Wireless Charging Industry Revenue (billion), by Vehicle Type 2025 & 2033
- Figure 3: North America APAC Wireless Charging Industry Revenue Share (%), by Vehicle Type 2025 & 2033
- Figure 4: North America APAC Wireless Charging Industry Revenue (billion), by Country 2025 & 2033
- Figure 5: North America APAC Wireless Charging Industry Revenue Share (%), by Country 2025 & 2033
- Figure 6: South America APAC Wireless Charging Industry Revenue (billion), by Vehicle Type 2025 & 2033
- Figure 7: South America APAC Wireless Charging Industry Revenue Share (%), by Vehicle Type 2025 & 2033
- Figure 8: South America APAC Wireless Charging Industry Revenue (billion), by Country 2025 & 2033
- Figure 9: South America APAC Wireless Charging Industry Revenue Share (%), by Country 2025 & 2033
- Figure 10: Europe APAC Wireless Charging Industry Revenue (billion), by Vehicle Type 2025 & 2033
- Figure 11: Europe APAC Wireless Charging Industry Revenue Share (%), by Vehicle Type 2025 & 2033
- Figure 12: Europe APAC Wireless Charging Industry Revenue (billion), by Country 2025 & 2033
- Figure 13: Europe APAC Wireless Charging Industry Revenue Share (%), by Country 2025 & 2033
- Figure 14: Middle East & Africa APAC Wireless Charging Industry Revenue (billion), by Vehicle Type 2025 & 2033
- Figure 15: Middle East & Africa APAC Wireless Charging Industry Revenue Share (%), by Vehicle Type 2025 & 2033
- Figure 16: Middle East & Africa APAC Wireless Charging Industry Revenue (billion), by Country 2025 & 2033
- Figure 17: Middle East & Africa APAC Wireless Charging Industry Revenue Share (%), by Country 2025 & 2033
- Figure 18: Asia Pacific APAC Wireless Charging Industry Revenue (billion), by Vehicle Type 2025 & 2033
- Figure 19: Asia Pacific APAC Wireless Charging Industry Revenue Share (%), by Vehicle Type 2025 & 2033
- Figure 20: Asia Pacific APAC Wireless Charging Industry Revenue (billion), by Country 2025 & 2033
- Figure 21: Asia Pacific APAC Wireless Charging Industry Revenue Share (%), by Country 2025 & 2033
List of Tables
- Table 1: Global APAC Wireless Charging Industry Revenue billion Forecast, by Vehicle Type 2020 & 2033
- Table 2: Global APAC Wireless Charging Industry Revenue billion Forecast, by Region 2020 & 2033
- Table 3: Global APAC Wireless Charging Industry Revenue billion Forecast, by Vehicle Type 2020 & 2033
- Table 4: Global APAC Wireless Charging Industry Revenue billion Forecast, by Country 2020 & 2033
- Table 5: United States APAC Wireless Charging Industry Revenue (billion) Forecast, by Application 2020 & 2033
- Table 6: Canada APAC Wireless Charging Industry Revenue (billion) Forecast, by Application 2020 & 2033
- Table 7: Mexico APAC Wireless Charging Industry Revenue (billion) Forecast, by Application 2020 & 2033
- Table 8: Global APAC Wireless Charging Industry Revenue billion Forecast, by Vehicle Type 2020 & 2033
- Table 9: Global APAC Wireless Charging Industry Revenue billion Forecast, by Country 2020 & 2033
- Table 10: Brazil APAC Wireless Charging Industry Revenue (billion) Forecast, by Application 2020 & 2033
- Table 11: Argentina APAC Wireless Charging Industry Revenue (billion) Forecast, by Application 2020 & 2033
- Table 12: Rest of South America APAC Wireless Charging Industry Revenue (billion) Forecast, by Application 2020 & 2033
- Table 13: Global APAC Wireless Charging Industry Revenue billion Forecast, by Vehicle Type 2020 & 2033
- Table 14: Global APAC Wireless Charging Industry Revenue billion Forecast, by Country 2020 & 2033
- Table 15: United Kingdom APAC Wireless Charging Industry Revenue (billion) Forecast, by Application 2020 & 2033
- Table 16: Germany APAC Wireless Charging Industry Revenue (billion) Forecast, by Application 2020 & 2033
- Table 17: France APAC Wireless Charging Industry Revenue (billion) Forecast, by Application 2020 & 2033
- Table 18: Italy APAC Wireless Charging Industry Revenue (billion) Forecast, by Application 2020 & 2033
- Table 19: Spain APAC Wireless Charging Industry Revenue (billion) Forecast, by Application 2020 & 2033
- Table 20: Russia APAC Wireless Charging Industry Revenue (billion) Forecast, by Application 2020 & 2033
- Table 21: Benelux APAC Wireless Charging Industry Revenue (billion) Forecast, by Application 2020 & 2033
- Table 22: Nordics APAC Wireless Charging Industry Revenue (billion) Forecast, by Application 2020 & 2033
- Table 23: Rest of Europe APAC Wireless Charging Industry Revenue (billion) Forecast, by Application 2020 & 2033
- Table 24: Global APAC Wireless Charging Industry Revenue billion Forecast, by Vehicle Type 2020 & 2033
- Table 25: Global APAC Wireless Charging Industry Revenue billion Forecast, by Country 2020 & 2033
- Table 26: Turkey APAC Wireless Charging Industry Revenue (billion) Forecast, by Application 2020 & 2033
- Table 27: Israel APAC Wireless Charging Industry Revenue (billion) Forecast, by Application 2020 & 2033
- Table 28: GCC APAC Wireless Charging Industry Revenue (billion) Forecast, by Application 2020 & 2033
- Table 29: North Africa APAC Wireless Charging Industry Revenue (billion) Forecast, by Application 2020 & 2033
- Table 30: South Africa APAC Wireless Charging Industry Revenue (billion) Forecast, by Application 2020 & 2033
- Table 31: Rest of Middle East & Africa APAC Wireless Charging Industry Revenue (billion) Forecast, by Application 2020 & 2033
- Table 32: Global APAC Wireless Charging Industry Revenue billion Forecast, by Vehicle Type 2020 & 2033
- Table 33: Global APAC Wireless Charging Industry Revenue billion Forecast, by Country 2020 & 2033
- Table 34: China APAC Wireless Charging Industry Revenue (billion) Forecast, by Application 2020 & 2033
- Table 35: India APAC Wireless Charging Industry Revenue (billion) Forecast, by Application 2020 & 2033
- Table 36: Japan APAC Wireless Charging Industry Revenue (billion) Forecast, by Application 2020 & 2033
- Table 37: South Korea APAC Wireless Charging Industry Revenue (billion) Forecast, by Application 2020 & 2033
- Table 38: ASEAN APAC Wireless Charging Industry Revenue (billion) Forecast, by Application 2020 & 2033
- Table 39: Oceania APAC Wireless Charging Industry Revenue (billion) Forecast, by Application 2020 & 2033
- Table 40: Rest of Asia Pacific APAC Wireless Charging Industry Revenue (billion) Forecast, by Application 2020 & 2033
Frequently Asked Questions
1. What is the projected Compound Annual Growth Rate (CAGR) of the APAC Wireless Charging Industry?
The projected CAGR is approximately 36.2%.
2. Which companies are prominent players in the APAC Wireless Charging Industry?
Key companies in the market include Tesla Motors, Daimler AG, OLEV Technologies, BMW AG, Plugless, Bombardier, Toyota Motor Corporation, Nissan, Hella Aglaia, HEVO Powe, WiTricity, Qualcomm.
3. What are the main segments of the APAC Wireless Charging Industry?
The market segments include Vehicle Type.
4. Can you provide details about the market size?
The market size is estimated to be USD 24.4 billion as of 2022.
5. What are some drivers contributing to market growth?
Growing Sales of Electric Vehicles Aiding Market Growth.
6. What are the notable trends driving market growth?
Increasing Sales of Electric Vehicles Driving the Wireless Charging Demand.
7. Are there any restraints impacting market growth?
High Cost of Installing Wireless Chargers.
8. Can you provide examples of recent developments in the market?
June 2023: ST Microelectronics NV unveiled an array of cutting-edge products and solutions for the smart mobility sector during the MWC Shanghai event. Among the highlights was the debut of the ST P-BOX Solution, a groundbreaking technology set to revolutionize autonomous driving. Additionally, the company showcased its 100W Wireless Charging Solution, built upon the STWBC2-HP and STWLC99 platforms.
9. What pricing options are available for accessing the report?
Pricing options include single-user, multi-user, and enterprise licenses priced at USD 4750, USD 4950, and USD 6800 respectively.
10. Is the market size provided in terms of value or volume?
The market size is provided in terms of value, measured in billion.
11. Are there any specific market keywords associated with the report?
Yes, the market keyword associated with the report is "APAC Wireless Charging Industry," which aids in identifying and referencing the specific market segment covered.
12. How do I determine which pricing option suits my needs best?
The pricing options vary based on user requirements and access needs. Individual users may opt for single-user licenses, while businesses requiring broader access may choose multi-user or enterprise licenses for cost-effective access to the report.
13. Are there any additional resources or data provided in the APAC Wireless Charging Industry report?
While the report offers comprehensive insights, it's advisable to review the specific contents or supplementary materials provided to ascertain if additional resources or data are available.
14. How can I stay updated on further developments or reports in the APAC Wireless Charging Industry?
To stay informed about further developments, trends, and reports in the APAC Wireless Charging Industry, consider subscribing to industry newsletters, following relevant companies and organizations, or regularly checking reputable industry news sources and publications.
Methodology
Step 1 - Identification of Relevant Samples Size from Population Database


Step 2 - Approaches for Defining Global Market Size (Value, Volume* & Price*)

Note*: In applicable scenarios
Step 3 - Data Sources
Primary Research
- Web Analytics
- Survey Reports
- Research Institute
- Latest Research Reports
- Opinion Leaders
Secondary Research
- Annual Reports
- White Paper
- Latest Press Release
- Industry Association
- Paid Database
- Investor Presentations

Step 4 - Data Triangulation
Involves using different sources of information in order to increase the validity of a study
These sources are likely to be stakeholders in a program - participants, other researchers, program staff, other community members, and so on.
Then we put all data in single framework & apply various statistical tools to find out the dynamic on the market.
During the analysis stage, feedback from the stakeholder groups would be compared to determine areas of agreement as well as areas of divergence