

Key Insights
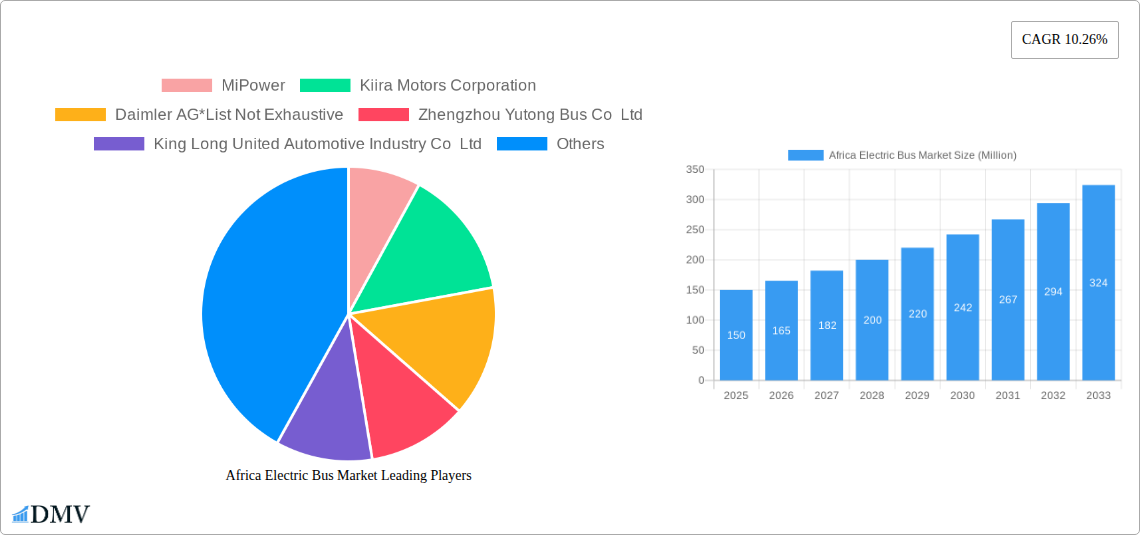
The African electric bus market is poised for significant growth, driven by increasing urbanization, government initiatives promoting sustainable transportation, and a rising awareness of environmental concerns. With a Compound Annual Growth Rate (CAGR) of 10.26% from 2019 to 2024, the market demonstrates a strong upward trajectory. This growth is fueled by substantial investments in public transportation infrastructure across major African nations, particularly in South Africa, Morocco, and Egypt. These countries are witnessing a shift towards cleaner energy solutions, leading to increased adoption of electric buses by both government entities and fleet operators. The market segmentation reveals a dominance of battery electric buses over plug-in hybrid electric vehicles, reflecting a preference for fully electric solutions for environmental and operational efficiency. While the initial market size in 2019 was relatively small, the projected growth indicates a substantial increase in market value by 2033. Key players, including international manufacturers like BYD Auto and local companies like Kiira Motors Corporation, are actively shaping market dynamics through technological advancements and strategic partnerships, contributing to the overall market expansion. Challenges remain, however, including high upfront costs of electric buses and the need for substantial investment in charging infrastructure across the continent. Overcoming these obstacles will be crucial for realizing the full potential of the African electric bus market.
The expansion of the African electric bus market will be further accelerated by favorable government policies aimed at reducing carbon emissions and improving air quality in urban areas. These policies often include subsidies, tax breaks, and preferential procurement policies for electric vehicles. Furthermore, technological advancements in battery technology, leading to increased range and reduced charging times, will enhance the attractiveness of electric buses. The rising popularity of electric buses is also influenced by factors such as lower operating costs compared to diesel buses (reduced fuel and maintenance expenses) and their quieter operation, improving the overall urban environment. While the Rest of Africa segment currently lags behind major markets, increasing awareness and supportive government initiatives in several countries indicate promising future growth potential. The market's trajectory will be highly influenced by the success of large-scale electric bus deployments in major cities, demonstrating the feasibility and cost-effectiveness of adopting this technology across various African contexts.
Africa Electric Bus Market: A Comprehensive Report (2019-2033)
This insightful report provides a detailed analysis of the burgeoning Africa electric bus market, offering invaluable insights for stakeholders seeking to navigate this rapidly evolving landscape. With a study period spanning 2019-2033, a base year of 2025, and an estimated year of 2025, this report projects market trends through 2033, covering historical data (2019-2024) and future forecasts (2025-2033). The report quantifies market size in Millions, providing crucial data for informed decision-making.
Africa Electric Bus Market Composition & Trends
This section delves into the competitive dynamics of the African electric bus market, examining market concentration, innovation drivers, regulatory frameworks, substitute products, and end-user profiles. We analyze M&A activity, including deal values and market share distribution amongst key players. The market is currently experiencing a shift towards sustainable transportation, driven by government initiatives and increasing environmental concerns.
- Market Concentration: The market is characterized by a mix of established international players and emerging local manufacturers, resulting in a moderately concentrated market structure. Market share data for 2025 indicates that xx Million is held by the top 5 players, with the remaining xx Million distributed amongst smaller companies.
- Innovation Catalysts: Government subsidies, technological advancements in battery technology and charging infrastructure, and the growing demand for sustainable transportation solutions are key catalysts driving market innovation.
- Regulatory Landscape: Varying regulations across African nations present both opportunities and challenges. Some countries offer substantial incentives for electric bus adoption, while others lack supportive policies.
- Substitute Products: Traditional diesel and CNG buses remain the primary competitors. However, the increasing cost-effectiveness and environmental benefits of electric buses are gradually shifting market preferences.
- End-User Profiles: Government agencies and fleet operators constitute the primary end-users, with significant growth anticipated from private sector investments in the coming years.
- M&A Activities: The past five years witnessed xx M&A deals in the African electric bus market, with a total value of approximately $xx Million. These deals reflect strategic expansions and consolidations within the industry.
Africa Electric Bus Market Industry Evolution
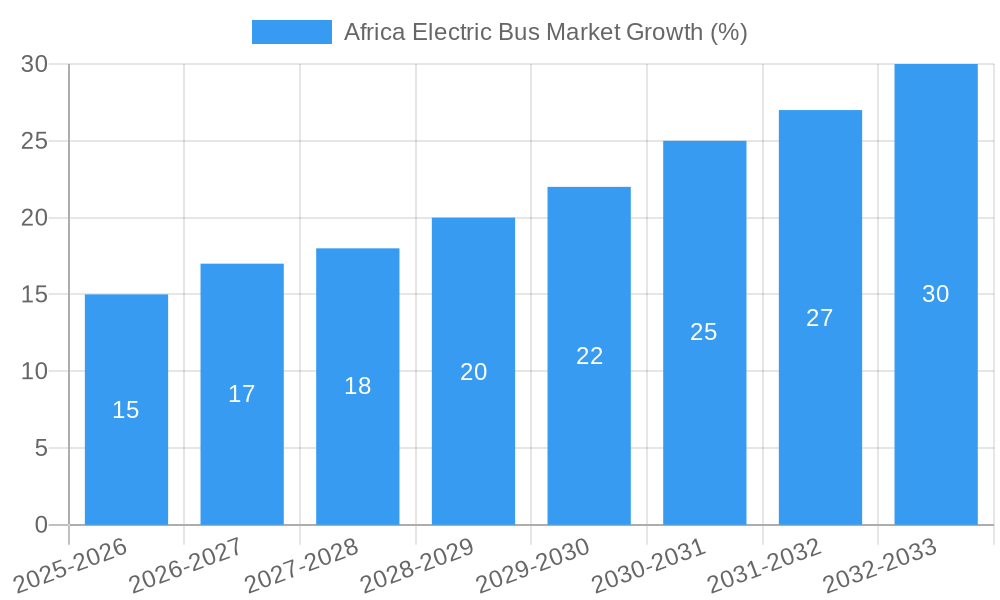
This section analyzes the growth trajectory of the Africa electric bus market, examining technological advancements, evolving consumer preferences, and the overall market size. The market has witnessed significant growth in recent years, fueled by increasing urbanization, rising environmental concerns, and supportive government policies. The adoption rate of electric buses is projected to accelerate during the forecast period.
The market is expected to exhibit a Compound Annual Growth Rate (CAGR) of xx% during the forecast period (2025-2033), reaching a market size of xx Million by 2033. This growth is driven primarily by the increasing affordability of electric buses, coupled with advancements in battery technology that extend operational range and reduce charging times. Government initiatives aimed at reducing carbon emissions and improving public transportation infrastructure are also significant growth drivers. By 2033, xx% of the market will likely be dominated by Battery Electric buses, highlighting a significant transition away from traditional fuel sources. The shift in consumer preference towards cleaner and more efficient public transportation will further boost this growth trajectory.
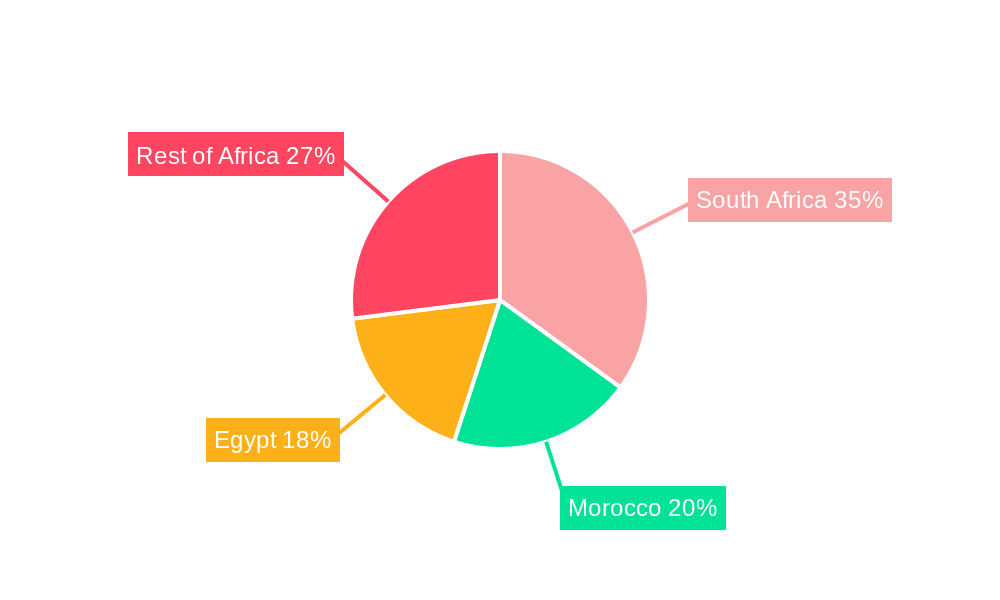
Leading Regions, Countries, or Segments in Africa Electric Bus Market
South Africa currently holds the largest market share within the region due to its relatively advanced infrastructure and supportive government policies. However, Morocco and Egypt are showing strong growth potential, driven by significant investments in public transport modernization and commitment to reducing carbon emissions. The Battery Electric segment dominates the propulsion type market share.
- Key Drivers:
- South Africa: Strong government support through subsidies and tax incentives; established charging infrastructure in major cities.
- Morocco: Significant investments in renewable energy and public transportation infrastructure; government initiatives promoting sustainable transport.
- Egypt: Growing urbanization and increasing demand for efficient public transportation; government focus on reducing air pollution.
- Battery Electric (Propulsion Type): Lower operating costs, environmental benefits, and technological advancements make it the preferred choice.
- Government (Consumer Type): Significant public sector procurement drives adoption; large-scale fleet electrification projects.
The Rest of Africa segment is also showing promising growth, with several countries initiating pilot projects and exploring options for electric bus deployment. This segment presents a significant opportunity for future growth, particularly as charging infrastructure and supportive policies expand across the continent.
Africa Electric Bus Market Product Innovations
Recent innovations focus on enhancing battery life, optimizing charging infrastructure, and incorporating advanced safety features. Manufacturers are also developing customized bus designs tailored to the specific challenges and needs of the African market, such as ruggedness and adaptability to diverse terrain conditions. The integration of smart technologies, such as telematics and predictive maintenance systems, further enhances operational efficiency and reduces lifecycle costs.
Propelling Factors for Africa Electric Bus Market Growth
Several factors propel the growth of the Africa electric bus market. Technological advancements, particularly in battery technology and charging infrastructure, are making electric buses increasingly cost-competitive. Government initiatives, including subsidies, tax breaks, and emission reduction targets, provide significant incentives for adoption. Furthermore, the increasing awareness of environmental concerns and a growing demand for sustainable transportation solutions are fueling market expansion.
Obstacles in the Africa Electric Bus Market
The market faces several challenges. High upfront costs of electric buses compared to traditional buses remain a barrier. The availability and reliability of charging infrastructure in many African countries are still limited, hindering widespread adoption. Furthermore, supply chain disruptions and volatile commodity prices can impact the cost and availability of electric buses. Navigating diverse regulatory frameworks across the continent also presents a considerable challenge.
Future Opportunities in Africa Electric Bus Market
Emerging markets outside major urban centers present significant opportunities for growth. Advancements in battery technology, particularly solid-state batteries, promise to further enhance the competitiveness of electric buses. The integration of smart technologies and renewable energy sources will further optimize operational efficiency and sustainability. The growing private sector investment in public transport is likely to drive future demand.
Major Players in the Africa Electric Bus Market Ecosystem
- MiPower
- Kiira Motors Corporation
- Daimler AG
- Zhengzhou Yutong Bus Co Ltd
- King Long United Automotive Industry Co Ltd
- BYD Auto Co Ltd
- Zhongtong Bus Holding Co Ltd
Key Developments in Africa Electric Bus Market Industry
- August 2022: ROAM launches its first all-electric bus, the ROAM Rapid, in Kenya, targeting mass transit needs.
- January 2022: Opibus unveils Kenya's first African-designed and manufactured electric bus, aiming for pan-African commercialization.
Strategic Africa Electric Bus Market Forecast
The Africa electric bus market is poised for substantial growth, driven by technological advancements, supportive government policies, and a growing demand for sustainable transportation solutions. Continued investment in charging infrastructure and further advancements in battery technology will be crucial for unlocking the full market potential. The expanding private sector participation will further accelerate the transition towards electric bus adoption across the continent.
Africa Electric Bus Market Segmentation
-
1. Propulsion Type
- 1.1. Battery Electric
- 1.2. Plug-In Hybrid Electric
-
2. Consumer Type
- 2.1. Government
- 2.2. Fleet Operators
Africa Electric Bus Market Segmentation By Geography
-
1. Africa
- 1.1. Nigeria
- 1.2. South Africa
- 1.3. Egypt
- 1.4. Kenya
- 1.5. Ethiopia
- 1.6. Morocco
- 1.7. Ghana
- 1.8. Algeria
- 1.9. Tanzania
- 1.10. Ivory Coast
Africa Electric Bus Market REPORT HIGHLIGHTS
| Aspects | Details |
|---|---|
| Study Period | 2019-2033 |
| Base Year | 2024 |
| Estimated Year | 2025 |
| Forecast Period | 2025-2033 |
| Historical Period | 2019-2024 |
| Growth Rate | CAGR of 10.26% from 2019-2033 |
| Segmentation |
|
Table of Contents
- 1. Introduction
- 1.1. Research Scope
- 1.2. Market Segmentation
- 1.3. Research Methodology
- 1.4. Definitions and Assumptions
- 2. Executive Summary
- 2.1. Introduction
- 3. Market Dynamics
- 3.1. Introduction
- 3.2. Market Drivers
- 3.2.1. Expanding the Presence of Automobile Assembly Plants in Ghana to Drive Demand in Target Market
- 3.3. Market Restrains
- 3.3.1. High Import Tariffs and Taxes on Vehicles May Stymie Industry Expansion
- 3.4. Market Trends
- 3.4.1. Battery Electric Bus to Witness Growth
- 4. Market Factor Analysis
- 4.1. Porters Five Forces
- 4.2. Supply/Value Chain
- 4.3. PESTEL analysis
- 4.4. Market Entropy
- 4.5. Patent/Trademark Analysis
- 5. Africa Electric Bus Market Analysis, Insights and Forecast, 2019-2031
- 5.1. Market Analysis, Insights and Forecast - by Propulsion Type
- 5.1.1. Battery Electric
- 5.1.2. Plug-In Hybrid Electric
- 5.2. Market Analysis, Insights and Forecast - by Consumer Type
- 5.2.1. Government
- 5.2.2. Fleet Operators
- 5.3. Market Analysis, Insights and Forecast - by Region
- 5.3.1. Africa
- 5.1. Market Analysis, Insights and Forecast - by Propulsion Type
- 6. South Africa Africa Electric Bus Market Analysis, Insights and Forecast, 2019-2031
- 7. Sudan Africa Electric Bus Market Analysis, Insights and Forecast, 2019-2031
- 8. Uganda Africa Electric Bus Market Analysis, Insights and Forecast, 2019-2031
- 9. Tanzania Africa Electric Bus Market Analysis, Insights and Forecast, 2019-2031
- 10. Kenya Africa Electric Bus Market Analysis, Insights and Forecast, 2019-2031
- 11. Rest of Africa Africa Electric Bus Market Analysis, Insights and Forecast, 2019-2031
- 12. Competitive Analysis
- 12.1. Market Share Analysis 2024
- 12.2. Company Profiles
- 12.2.1 MiPower
- 12.2.1.1. Overview
- 12.2.1.2. Products
- 12.2.1.3. SWOT Analysis
- 12.2.1.4. Recent Developments
- 12.2.1.5. Financials (Based on Availability)
- 12.2.2 Kiira Motors Corporation
- 12.2.2.1. Overview
- 12.2.2.2. Products
- 12.2.2.3. SWOT Analysis
- 12.2.2.4. Recent Developments
- 12.2.2.5. Financials (Based on Availability)
- 12.2.3 Daimler AG*List Not Exhaustive
- 12.2.3.1. Overview
- 12.2.3.2. Products
- 12.2.3.3. SWOT Analysis
- 12.2.3.4. Recent Developments
- 12.2.3.5. Financials (Based on Availability)
- 12.2.4 Zhengzhou Yutong Bus Co Ltd
- 12.2.4.1. Overview
- 12.2.4.2. Products
- 12.2.4.3. SWOT Analysis
- 12.2.4.4. Recent Developments
- 12.2.4.5. Financials (Based on Availability)
- 12.2.5 King Long United Automotive Industry Co Ltd
- 12.2.5.1. Overview
- 12.2.5.2. Products
- 12.2.5.3. SWOT Analysis
- 12.2.5.4. Recent Developments
- 12.2.5.5. Financials (Based on Availability)
- 12.2.6 BYD Auto Co Ltd
- 12.2.6.1. Overview
- 12.2.6.2. Products
- 12.2.6.3. SWOT Analysis
- 12.2.6.4. Recent Developments
- 12.2.6.5. Financials (Based on Availability)
- 12.2.7 Zhongtong Bus Holding Co Ltd
- 12.2.7.1. Overview
- 12.2.7.2. Products
- 12.2.7.3. SWOT Analysis
- 12.2.7.4. Recent Developments
- 12.2.7.5. Financials (Based on Availability)
- 12.2.1 MiPower
List of Figures
- Figure 1: Africa Electric Bus Market Revenue Breakdown (Million, %) by Product 2024 & 2032
- Figure 2: Africa Electric Bus Market Share (%) by Company 2024
List of Tables
- Table 1: Africa Electric Bus Market Revenue Million Forecast, by Region 2019 & 2032
- Table 2: Africa Electric Bus Market Revenue Million Forecast, by Propulsion Type 2019 & 2032
- Table 3: Africa Electric Bus Market Revenue Million Forecast, by Consumer Type 2019 & 2032
- Table 4: Africa Electric Bus Market Revenue Million Forecast, by Region 2019 & 2032
- Table 5: Africa Electric Bus Market Revenue Million Forecast, by Country 2019 & 2032
- Table 6: South Africa Africa Electric Bus Market Revenue (Million) Forecast, by Application 2019 & 2032
- Table 7: Sudan Africa Electric Bus Market Revenue (Million) Forecast, by Application 2019 & 2032
- Table 8: Uganda Africa Electric Bus Market Revenue (Million) Forecast, by Application 2019 & 2032
- Table 9: Tanzania Africa Electric Bus Market Revenue (Million) Forecast, by Application 2019 & 2032
- Table 10: Kenya Africa Electric Bus Market Revenue (Million) Forecast, by Application 2019 & 2032
- Table 11: Rest of Africa Africa Electric Bus Market Revenue (Million) Forecast, by Application 2019 & 2032
- Table 12: Africa Electric Bus Market Revenue Million Forecast, by Propulsion Type 2019 & 2032
- Table 13: Africa Electric Bus Market Revenue Million Forecast, by Consumer Type 2019 & 2032
- Table 14: Africa Electric Bus Market Revenue Million Forecast, by Country 2019 & 2032
- Table 15: Nigeria Africa Electric Bus Market Revenue (Million) Forecast, by Application 2019 & 2032
- Table 16: South Africa Africa Electric Bus Market Revenue (Million) Forecast, by Application 2019 & 2032
- Table 17: Egypt Africa Electric Bus Market Revenue (Million) Forecast, by Application 2019 & 2032
- Table 18: Kenya Africa Electric Bus Market Revenue (Million) Forecast, by Application 2019 & 2032
- Table 19: Ethiopia Africa Electric Bus Market Revenue (Million) Forecast, by Application 2019 & 2032
- Table 20: Morocco Africa Electric Bus Market Revenue (Million) Forecast, by Application 2019 & 2032
- Table 21: Ghana Africa Electric Bus Market Revenue (Million) Forecast, by Application 2019 & 2032
- Table 22: Algeria Africa Electric Bus Market Revenue (Million) Forecast, by Application 2019 & 2032
- Table 23: Tanzania Africa Electric Bus Market Revenue (Million) Forecast, by Application 2019 & 2032
- Table 24: Ivory Coast Africa Electric Bus Market Revenue (Million) Forecast, by Application 2019 & 2032
Frequently Asked Questions
1. What is the projected Compound Annual Growth Rate (CAGR) of the Africa Electric Bus Market?
The projected CAGR is approximately 10.26%.
2. Which companies are prominent players in the Africa Electric Bus Market?
Key companies in the market include MiPower, Kiira Motors Corporation, Daimler AG*List Not Exhaustive, Zhengzhou Yutong Bus Co Ltd, King Long United Automotive Industry Co Ltd, BYD Auto Co Ltd, Zhongtong Bus Holding Co Ltd.
3. What are the main segments of the Africa Electric Bus Market?
The market segments include Propulsion Type, Consumer Type.
4. Can you provide details about the market size?
The market size is estimated to be USD XX Million as of 2022.
5. What are some drivers contributing to market growth?
Expanding the Presence of Automobile Assembly Plants in Ghana to Drive Demand in Target Market.
6. What are the notable trends driving market growth?
Battery Electric Bus to Witness Growth.
7. Are there any restraints impacting market growth?
High Import Tariffs and Taxes on Vehicles May Stymie Industry Expansion.
8. Can you provide examples of recent developments in the market?
In August 2022, ROAM, a Swedish-Kenyan mobility company, launched its first all-electric bus built for mass transit in Africa, following the launch of its first production-intent model of electric motorcycles. The ROAM Rapid is an electric bus that was created to address the unique challenges of public transportation in Nairobi and throughout Africa.
9. What pricing options are available for accessing the report?
Pricing options include single-user, multi-user, and enterprise licenses priced at USD 4750, USD 4950, and USD 6800 respectively.
10. Is the market size provided in terms of value or volume?
The market size is provided in terms of value, measured in Million.
11. Are there any specific market keywords associated with the report?
Yes, the market keyword associated with the report is "Africa Electric Bus Market," which aids in identifying and referencing the specific market segment covered.
12. How do I determine which pricing option suits my needs best?
The pricing options vary based on user requirements and access needs. Individual users may opt for single-user licenses, while businesses requiring broader access may choose multi-user or enterprise licenses for cost-effective access to the report.
13. Are there any additional resources or data provided in the Africa Electric Bus Market report?
While the report offers comprehensive insights, it's advisable to review the specific contents or supplementary materials provided to ascertain if additional resources or data are available.
14. How can I stay updated on further developments or reports in the Africa Electric Bus Market?
To stay informed about further developments, trends, and reports in the Africa Electric Bus Market, consider subscribing to industry newsletters, following relevant companies and organizations, or regularly checking reputable industry news sources and publications.
Methodology
Step 1 - Identification of Relevant Samples Size from Population Database


Step 2 - Approaches for Defining Global Market Size (Value, Volume* & Price*)

Note*: In applicable scenarios
Step 3 - Data Sources
Primary Research
- Web Analytics
- Survey Reports
- Research Institute
- Latest Research Reports
- Opinion Leaders
Secondary Research
- Annual Reports
- White Paper
- Latest Press Release
- Industry Association
- Paid Database
- Investor Presentations

Step 4 - Data Triangulation
Involves using different sources of information in order to increase the validity of a study
These sources are likely to be stakeholders in a program - participants, other researchers, program staff, other community members, and so on.
Then we put all data in single framework & apply various statistical tools to find out the dynamic on the market.
During the analysis stage, feedback from the stakeholder groups would be compared to determine areas of agreement as well as areas of divergence
