

Key Insights
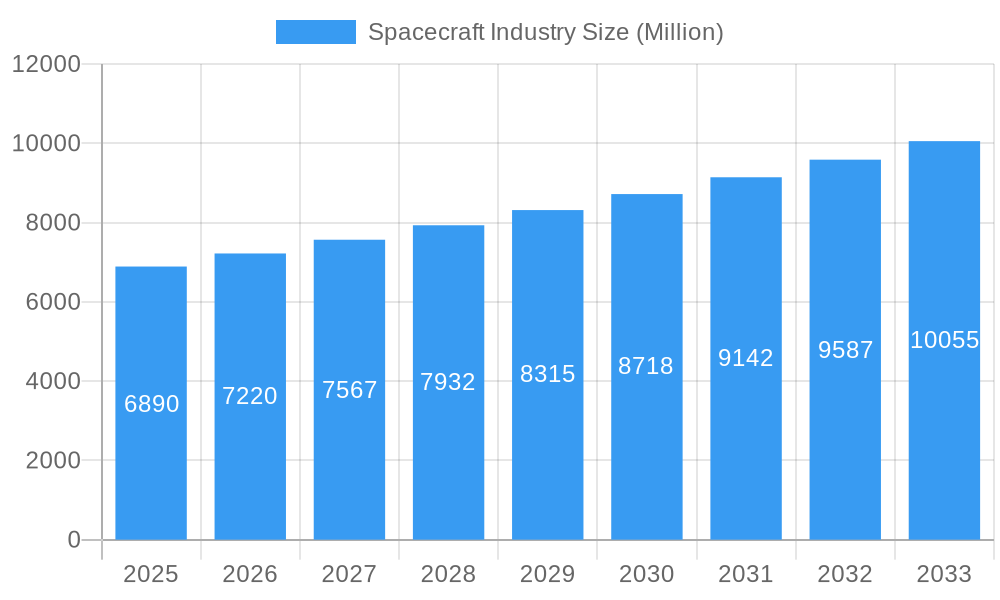
The global spacecraft industry, valued at $6.89 billion in 2025, is projected to experience robust growth, driven by increasing government spending on space exploration and defense, the burgeoning commercial space sector, and advancements in satellite technology. The market's Compound Annual Growth Rate (CAGR) of 4.74% from 2025 to 2033 indicates a significant expansion, with the market expected to surpass $10 billion by 2030. Key drivers include the rising demand for Earth observation satellites, communication satellites, and navigation systems, coupled with the escalating need for space-based infrastructure for various applications like telecommunications, weather forecasting, and scientific research. The unmanned spacecraft segment is anticipated to witness faster growth than the manned segment, fueled by cost-effectiveness and technological advancements in autonomous navigation and control systems. However, challenges like high launch costs, stringent regulatory frameworks, and the complexities associated with space operations act as restraints to the market's full potential. North America currently dominates the market, led by the significant investments from the United States in both government-funded and commercial space initiatives. However, the Asia-Pacific region, particularly China and India, is poised for substantial growth, owing to substantial government investments in space programs and the increasing participation of private companies.
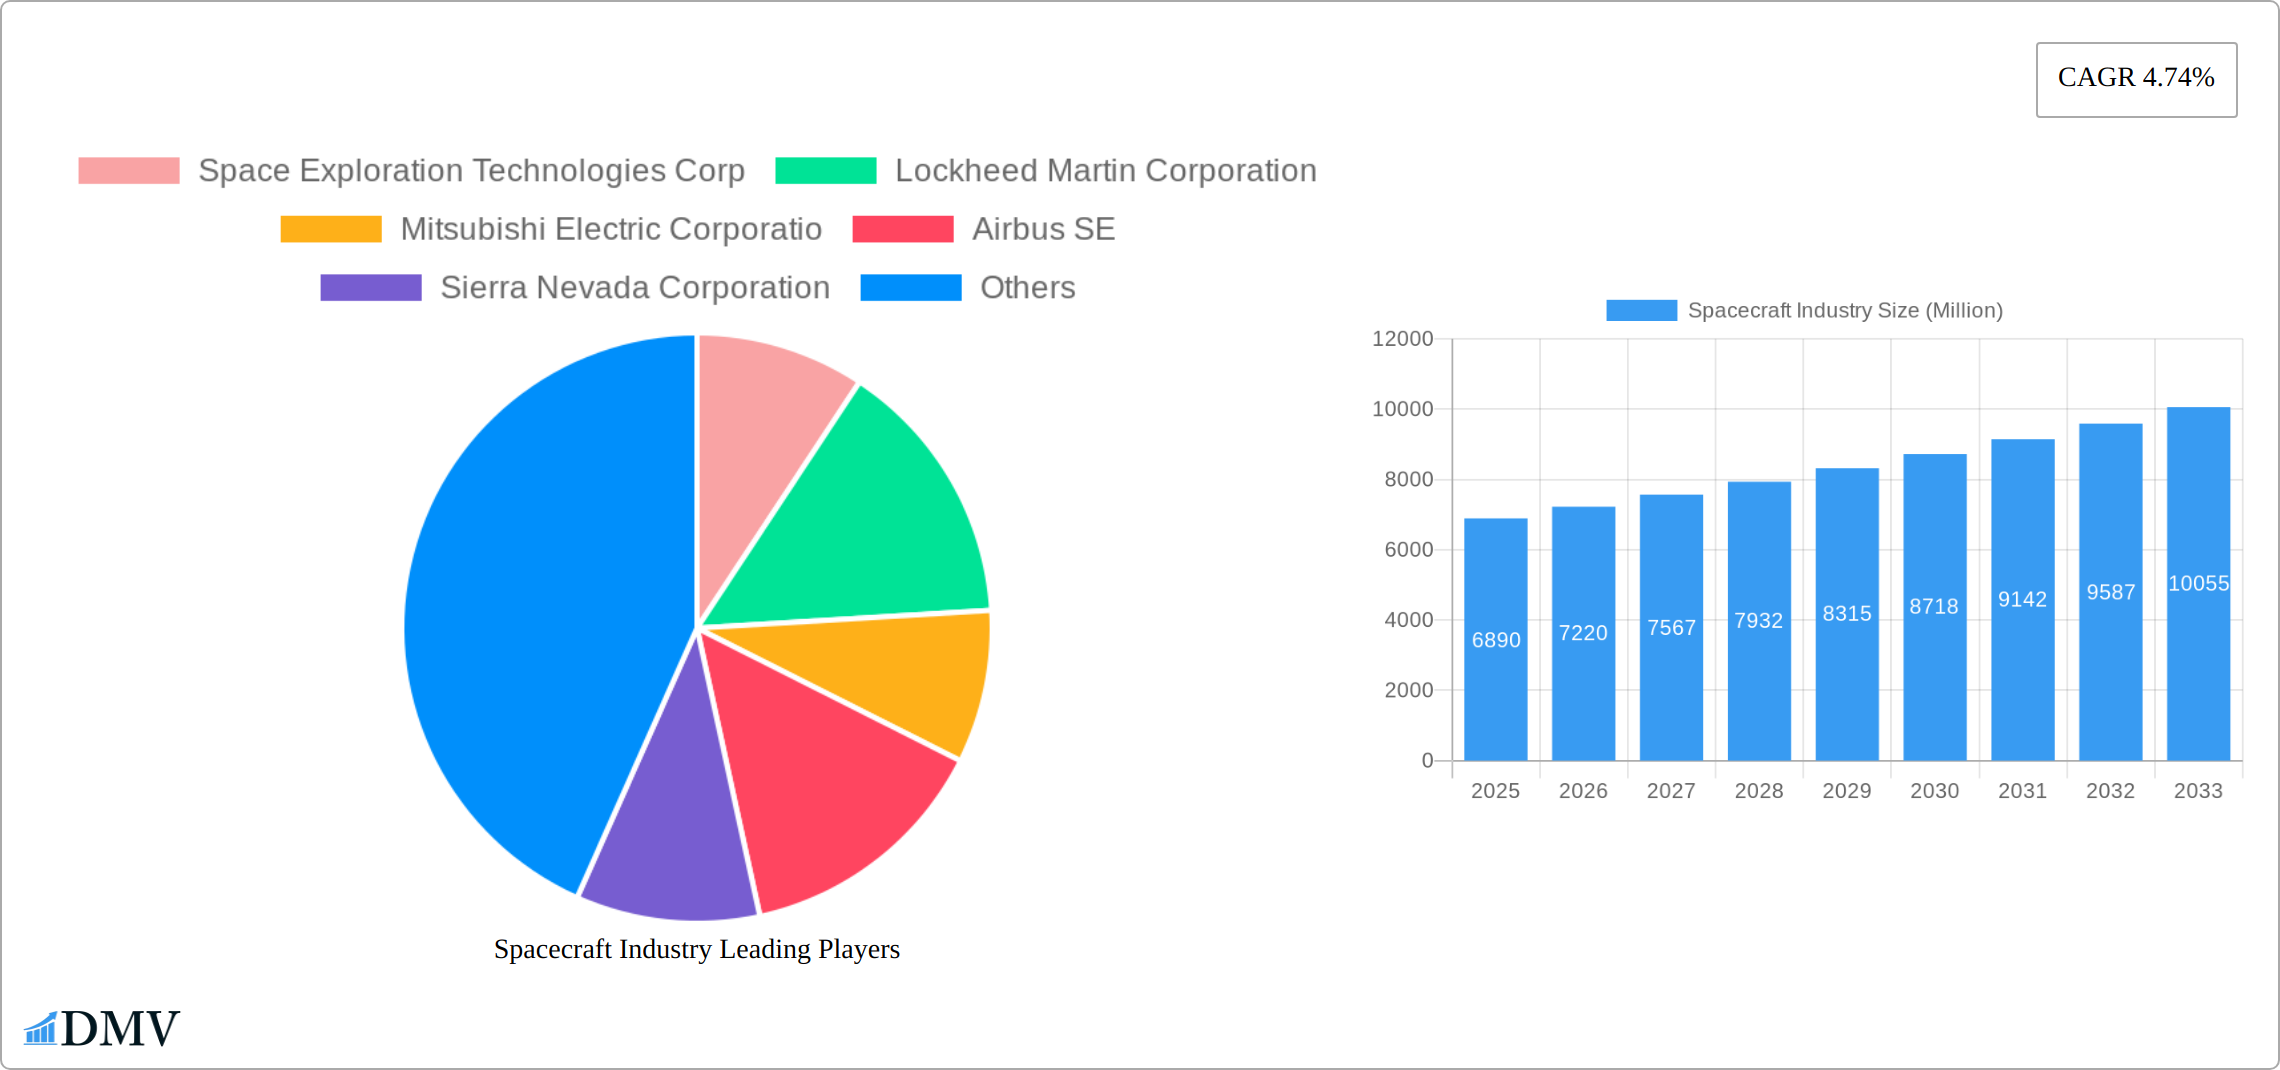
Spacecraft Industry Market Size (In Billion)
Competition within the spacecraft industry is fierce, with established players like Boeing, Lockheed Martin, and Airbus competing with emerging commercial space companies such as SpaceX and Blue Origin. These companies are engaged in a continuous race to develop advanced spacecraft technologies, reduce launch costs, and secure lucrative contracts for government and commercial clients. The industry's future trajectory will largely depend on technological breakthroughs in areas such as reusable launch vehicles, advanced propulsion systems, and in-space manufacturing. Further, the increasing focus on sustainable and environmentally friendly space technologies, combined with international collaborations for space exploration, will significantly influence the industry's growth and development in the coming years. The market segmentation by type (manned and unmanned spacecraft) provides valuable insights into market dynamics, revealing the specific areas experiencing the most rapid growth and potential for investment.
Spacecraft Industry Company Market Share
This comprehensive report provides an in-depth analysis of the global spacecraft industry, offering valuable insights for stakeholders seeking to navigate this dynamic and rapidly evolving market. With a focus on market trends, technological advancements, and key players, this report covers the period from 2019 to 2033, projecting a robust future for the sector. The report's data-driven analysis, encompassing both historical and forecast periods (2019-2024 and 2025-2033 respectively, with 2025 as the base year), provides a clear picture of the industry's trajectory. The total market value is estimated to reach xx Million by 2033.
Spacecraft Industry Market Composition & Trends
This section delves into the dynamic competitive landscape of the spacecraft industry, meticulously analyzing key market drivers, evolving regulatory frameworks, and overarching industry dynamics. The comprehensive study period, spanning from 2019 to 2033, reveals a sophisticated interplay of factors intricately shaping the industry's trajectory and future outlook.
Market Concentration & Share Distribution: The spacecraft industry exhibits a moderately concentrated market structure, with a select group of dominant players commanding substantial market shares. Companies like SpaceX, Lockheed Martin, and Boeing continue to hold a significant portion of the market. However, the landscape is increasingly enlivened by the innovative contributions of smaller, agile companies and ambitious new entrants. The precise market share distribution, along with a detailed analysis of their strategic approaches and competitive advantages, is comprehensively detailed within the full report.
- Market Leaders: Key players such as SpaceX, Lockheed Martin, Boeing, Airbus, and Northrop Grumman collectively account for an estimated xx% of the global market share.
- Emerging Players: The industry is witnessing robust growth and innovation from emerging entities like Sierra Nevada Corporation, Blue Origin, and a host of other specialized companies, all actively contributing to technological advancements and intensified competition.
- M&A Activity: Over the past five years, the spacecraft industry has experienced significant merger and acquisition (M&A) activity, with a cumulative value estimated at xx Million. This consolidation is a key driver for technological advancement and market expansion. Notable examples include [Specific M&A examples with deal values, if available; otherwise, mention the general trends such as consolidation for vertical integration or acquisition of specialized technologies].
Innovation Catalysts: The relentless pursuit of technological advancements, particularly in cutting-edge areas such as next-generation propulsion systems, advanced materials science, and sophisticated autonomous navigation capabilities, serves as a primary catalyst for market growth. Furthermore, substantial government funding allocated to ambitious space exploration programs continues to be a vital engine driving innovation across the sector.
Regulatory Landscape: A complex web of international and national space regulations, stringent licensing requirements, and rigorous safety standards profoundly influences the industry's operations and strategic decision-making. The comprehensive report provides an in-depth examination of this intricate regulatory environment and its pervasive impact on all industry stakeholders.
Substitute Products: While currently limited in scope, the report also considers the potential emergence of substitute technologies for certain spacecraft applications. This includes exploring the impact of advanced drone technologies and other innovative solutions, and their potential to disrupt specific market segments.
End-User Profiles: The study meticulously identifies and profiles key end-users, encompassing governmental space agencies (such as NASA, ESA, and JAXA), commercial satellite operators managing vast constellations, and prominent defense contractors. The report further analyzes the diverse and evolving needs, priorities, and procurement strategies of these critical end-user segments.
Spacecraft Industry Evolution
This section delves into the historical growth trajectories and future projections of the spacecraft market, examining the underlying technological advancements and evolving consumer demands that are reshaping the industry landscape. From 2019 to 2024, the industry experienced a compound annual growth rate (CAGR) of xx%, driven by increased investment in space exploration and commercial space activities. Looking ahead, the forecast period (2025-2033) predicts a CAGR of xx%, fueled by the expanding commercial space sector, advancements in reusable launch vehicles, and the rising demand for satellite-based services. The transition towards a more commercially driven space environment is significantly influencing market dynamics. Technological breakthroughs, such as the development of more efficient and cost-effective propulsion systems, are accelerating the adoption of new technologies. Consumer demand for satellite-based internet access, Earth observation data, and space tourism is further stimulating growth. The integration of artificial intelligence (AI) and machine learning (ML) in spacecraft design and operations is also transforming the industry. This evolution, marked by a convergence of technological advancement, commercial interests, and government support, is propelling the spacecraft industry toward a future of unprecedented growth and innovation.
Leading Regions, Countries, or Segments in Spacecraft Industry
This section pinpoints the dominant regions, countries, and segments within the spacecraft market, providing a detailed analysis of their leading position.
Dominant Region/Country: The United States currently holds a leading position in the spacecraft industry due to its strong government investment, advanced technological capabilities, and robust private space sector. Other regions, including Europe and Asia, are also witnessing significant growth.
Dominant Segment: Both manned and unmanned spacecraft segments contribute significantly to market revenue, with the unmanned spacecraft sector expected to experience higher growth due to increased demand for Earth observation, communication, and navigation satellites.
Key Drivers (Bullet Points):
- United States: Strong government funding (NASA), a well-established private space sector, and a robust technological infrastructure.
- Europe: Collaborative efforts among European Space Agency (ESA) member states, presence of major aerospace companies (Airbus, OHB SE).
- Asia (Japan, China): Increasing government investment in space exploration, ambitious national space programs, and growing commercial space activities.
Analysis of Dominance Factors (Paragraph Form):
The dominance of the United States stems from the substantial investment by NASA and the thriving private space industry, characterized by companies like SpaceX and Blue Origin, who are driving innovation and reducing launch costs. Europe benefits from its collaborative framework via ESA and the presence of established aerospace companies. Asia, particularly Japan and China, are rapidly emerging as key players due to increased government support and ambitious space exploration goals.
Spacecraft Industry Product Innovations
Recent years have ushered in an era of unprecedented advancements in spacecraft design and integrated technologies. The advent of reusable launch vehicles, exemplified by SpaceX's Falcon 9 and Sierra Nevada Corporation's Dream Chaser, is fundamentally reshaping the industry by drastically reducing launch costs and enabling more frequent and accessible space missions. The miniaturization of satellites has democratized access to space, making them more affordable and deployable for a wider range of applications. Concurrently, significant strides in propulsion systems are extending the operational range and duration of missions. The seamless integration of sophisticated sensors and advanced communication systems is further enhancing the versatility, precision, and overall effectiveness of spacecraft across diverse operational domains. These ongoing innovations are continuously pushing the boundaries of performance, leading to improvements in payload capacity, fuel efficiency, and mission longevity.
Propelling Factors for Spacecraft Industry Growth
Several key factors are propelling the growth of the spacecraft industry. Technological advancements, such as the development of reusable launch vehicles, are significantly lowering launch costs. Growing demand for satellite-based services, including communication, navigation, and Earth observation, is driving market expansion. Increased government investment in space exploration, both in established spacefaring nations and emerging players, is another significant factor. Favorable regulatory environments that encourage private sector participation are further enhancing market growth.
Obstacles in the Spacecraft Industry Market
Despite promising growth prospects, the spacecraft industry faces several challenges. Regulatory hurdles and licensing processes can cause delays and increase costs. Supply chain disruptions, especially in the procurement of specialized components, can impact production schedules. Intense competition among established players and new entrants is another significant challenge, creating pressure on pricing and profitability. The high cost of development and testing remains a substantial barrier to entry for smaller companies.
Future Opportunities in Spacecraft Industry
The spacecraft industry is on the cusp of remarkable expansion, presenting a plethora of exciting future opportunities. The escalating global demand for reliable satellite internet services, particularly in previously underserved regions, is a prime area for substantial growth and investment. The ambitious development of extensive space-based infrastructure, including vast mega-constellations of interconnected satellites, promises to revolutionize global communication networks and data transmission capabilities. The rapidly emerging space tourism sector is opening up novel avenues for significant revenue generation and new market segments. Furthermore, advancements in in-space manufacturing and the utilization of extraterrestrial resources hold immense potential for fostering future economic growth and establishing new industries beyond Earth.
Major Players in the Spacecraft Industry Ecosystem
Key Developments in Spacecraft Industry Industry
- November 2023: Sierra Space unveiled its "Dream Chaser" space shuttle, capable of carrying seven astronauts and contracted for seven cargo missions to the ISS. This signifies a significant step towards reusable spacecraft and strengthens the commercial space sector.
- January 2024: Japan's successful SLIM lunar landing demonstrated advanced precision landing technology, signifying a renewed focus and investment in space exploration by Japan. This development showcases technological advancements and potential for more frequent and cost-effective missions.
Strategic Spacecraft Industry Market Forecast
The spacecraft industry is strategically positioned for substantial and sustained growth over the coming decade. This projected expansion is primarily fueled by continuous technological innovation, an increasing trend towards commercialization across various space-related sectors, and ongoing robust investment from government entities worldwide. The burgeoning market for satellite constellations, coupled with the burgeoning growth of space tourism and the development of in-space manufacturing capabilities, is set to unlock significant new opportunities for established and emerging market players alike. Despite inherent challenges that the industry must navigate, the long-term outlook for the spacecraft sector remains exceptionally positive, indicating strong potential for considerable revenue growth and further groundbreaking technological advancements.
Spacecraft Industry Segmentation
- 1. Production Analysis
- 2. Consumption Analysis
- 3. Import Market Analysis (Value & Volume)
- 4. Export Market Analysis (Value & Volume)
- 5. Price Trend Analysis
Spacecraft Industry Segmentation By Geography
-
1. North America
- 1.1. United States
- 1.2. Canada
- 1.3. Mexico
-
2. South America
- 2.1. Brazil
- 2.2. Argentina
- 2.3. Rest of South America
-
3. Europe
- 3.1. United Kingdom
- 3.2. Germany
- 3.3. France
- 3.4. Italy
- 3.5. Spain
- 3.6. Russia
- 3.7. Benelux
- 3.8. Nordics
- 3.9. Rest of Europe
-
4. Middle East & Africa
- 4.1. Turkey
- 4.2. Israel
- 4.3. GCC
- 4.4. North Africa
- 4.5. South Africa
- 4.6. Rest of Middle East & Africa
-
5. Asia Pacific
- 5.1. China
- 5.2. India
- 5.3. Japan
- 5.4. South Korea
- 5.5. ASEAN
- 5.6. Oceania
- 5.7. Rest of Asia Pacific

Spacecraft Industry Regional Market Share
Geographic Coverage of Spacecraft Industry
Spacecraft Industry REPORT HIGHLIGHTS
| Aspects | Details |
|---|---|
| Study Period | 2020-2034 |
| Base Year | 2025 |
| Estimated Year | 2026 |
| Forecast Period | 2026-2034 |
| Historical Period | 2020-2025 |
| Growth Rate | CAGR of 4.74% from 2020-2034 |
| Segmentation |
|
Table of Contents
- 1. Introduction
- 1.1. Research Scope
- 1.2. Market Segmentation
- 1.3. Research Objective
- 1.4. Definitions and Assumptions
- 2. Executive Summary
- 2.1. Market Snapshot
- 3. Market Dynamics
- 3.1. Market Drivers
- 3.2. Market Restrains
- 3.3. Market Trends
- 3.4. Market Opportunities
- 4. Market Factor Analysis
- 4.1. Porters Five Forces
- 4.1.1. Bargaining Power of Suppliers
- 4.1.2. Bargaining Power of Buyers
- 4.1.3. Threat of New Entrants
- 4.1.4. Threat of Substitutes
- 4.1.5. Competitive Rivalry
- 4.2. PESTEL analysis
- 4.3. BCG Analysis
- 4.3.1. Stars (High Growth, High Market Share)
- 4.3.2. Cash Cows (Low Growth, High Market Share)
- 4.3.3. Question Mark (High Growth, Low Market Share)
- 4.3.4. Dogs (Low Growth, Low Market Share)
- 4.4. Ansoff Matrix Analysis
- 4.5. Supply Chain Analysis
- 4.6. Regulatory Landscape
- 4.7. Current Market Potential and Opportunity Assessment (TAM–SAM–SOM Framework)
- 4.8. DMV Analyst Note
- 4.1. Porters Five Forces
- 5. Market Analysis, Insights and Forecast 2021-2033
- 5.1. Market Analysis, Insights and Forecast - by Production Analysis
- 5.2. Market Analysis, Insights and Forecast - by Consumption Analysis
- 5.3. Market Analysis, Insights and Forecast - by Import Market Analysis (Value & Volume)
- 5.4. Market Analysis, Insights and Forecast - by Export Market Analysis (Value & Volume)
- 5.5. Market Analysis, Insights and Forecast - by Price Trend Analysis
- 5.6. Market Analysis, Insights and Forecast - by Region
- 5.6.1. North America
- 5.6.2. South America
- 5.6.3. Europe
- 5.6.4. Middle East & Africa
- 5.6.5. Asia Pacific
- 6. Global Spacecraft Industry Analysis, Insights and Forecast, 2021-2033
- 6.1. Market Analysis, Insights and Forecast - by Production Analysis
- 6.2. Market Analysis, Insights and Forecast - by Consumption Analysis
- 6.3. Market Analysis, Insights and Forecast - by Import Market Analysis (Value & Volume)
- 6.4. Market Analysis, Insights and Forecast - by Export Market Analysis (Value & Volume)
- 6.5. Market Analysis, Insights and Forecast - by Price Trend Analysis
- 7. North America Spacecraft Industry Analysis, Insights and Forecast, 2020-2032
- 7.1. Market Analysis, Insights and Forecast - by Production Analysis
- 7.2. Market Analysis, Insights and Forecast - by Consumption Analysis
- 7.3. Market Analysis, Insights and Forecast - by Import Market Analysis (Value & Volume)
- 7.4. Market Analysis, Insights and Forecast - by Export Market Analysis (Value & Volume)
- 7.5. Market Analysis, Insights and Forecast - by Price Trend Analysis
- 8. South America Spacecraft Industry Analysis, Insights and Forecast, 2020-2032
- 8.1. Market Analysis, Insights and Forecast - by Production Analysis
- 8.2. Market Analysis, Insights and Forecast - by Consumption Analysis
- 8.3. Market Analysis, Insights and Forecast - by Import Market Analysis (Value & Volume)
- 8.4. Market Analysis, Insights and Forecast - by Export Market Analysis (Value & Volume)
- 8.5. Market Analysis, Insights and Forecast - by Price Trend Analysis
- 9. Europe Spacecraft Industry Analysis, Insights and Forecast, 2020-2032
- 9.1. Market Analysis, Insights and Forecast - by Production Analysis
- 9.2. Market Analysis, Insights and Forecast - by Consumption Analysis
- 9.3. Market Analysis, Insights and Forecast - by Import Market Analysis (Value & Volume)
- 9.4. Market Analysis, Insights and Forecast - by Export Market Analysis (Value & Volume)
- 9.5. Market Analysis, Insights and Forecast - by Price Trend Analysis
- 10. Middle East & Africa Spacecraft Industry Analysis, Insights and Forecast, 2020-2032
- 10.1. Market Analysis, Insights and Forecast - by Production Analysis
- 10.2. Market Analysis, Insights and Forecast - by Consumption Analysis
- 10.3. Market Analysis, Insights and Forecast - by Import Market Analysis (Value & Volume)
- 10.4. Market Analysis, Insights and Forecast - by Export Market Analysis (Value & Volume)
- 10.5. Market Analysis, Insights and Forecast - by Price Trend Analysis
- 11. Asia Pacific Spacecraft Industry Analysis, Insights and Forecast, 2020-2032
- 11.1. Market Analysis, Insights and Forecast - by Production Analysis
- 11.2. Market Analysis, Insights and Forecast - by Consumption Analysis
- 11.3. Market Analysis, Insights and Forecast - by Import Market Analysis (Value & Volume)
- 11.4. Market Analysis, Insights and Forecast - by Export Market Analysis (Value & Volume)
- 11.5. Market Analysis, Insights and Forecast - by Price Trend Analysis
- 12. Competitive Analysis
- 12.1. Company Profiles
- 12.1.1 Space Exploration Technologies Corp
- 12.1.1.1. Company Overview
- 12.1.1.2. Products
- 12.1.1.3. Company Financials
- 12.1.1.4. SWOT Analysis
- 12.1.2 Lockheed Martin Corporation
- 12.1.2.1. Company Overview
- 12.1.2.2. Products
- 12.1.2.3. Company Financials
- 12.1.2.4. SWOT Analysis
- 12.1.3 Mitsubishi Electric Corporatio
- 12.1.3.1. Company Overview
- 12.1.3.2. Products
- 12.1.3.3. Company Financials
- 12.1.3.4. SWOT Analysis
- 12.1.4 Airbus SE
- 12.1.4.1. Company Overview
- 12.1.4.2. Products
- 12.1.4.3. Company Financials
- 12.1.4.4. SWOT Analysis
- 12.1.5 Sierra Nevada Corporation
- 12.1.5.1. Company Overview
- 12.1.5.2. Products
- 12.1.5.3. Company Financials
- 12.1.5.4. SWOT Analysis
- 12.1.6 QinetiQ Group
- 12.1.6.1. Company Overview
- 12.1.6.2. Products
- 12.1.6.3. Company Financials
- 12.1.6.4. SWOT Analysis
- 12.1.7 OHB SE
- 12.1.7.1. Company Overview
- 12.1.7.2. Products
- 12.1.7.3. Company Financials
- 12.1.7.4. SWOT Analysis
- 12.1.8 Maxar Technologies Inc
- 12.1.8.1. Company Overview
- 12.1.8.2. Products
- 12.1.8.3. Company Financials
- 12.1.8.4. SWOT Analysis
- 12.1.9 Blue Origin LLC
- 12.1.9.1. Company Overview
- 12.1.9.2. Products
- 12.1.9.3. Company Financials
- 12.1.9.4. SWOT Analysis
- 12.1.10 Berlin Space Technologies GmbH
- 12.1.10.1. Company Overview
- 12.1.10.2. Products
- 12.1.10.3. Company Financials
- 12.1.10.4. SWOT Analysis
- 12.1.11 Northrop Grumman Corporation
- 12.1.11.1. Company Overview
- 12.1.11.2. Products
- 12.1.11.3. Company Financials
- 12.1.11.4. SWOT Analysis
- 12.1.12 The Boeing Company
- 12.1.12.1. Company Overview
- 12.1.12.2. Products
- 12.1.12.3. Company Financials
- 12.1.12.4. SWOT Analysis
- 12.1.1 Space Exploration Technologies Corp
- 12.2. Market Entropy
- 12.2.1 Company's Key Areas Served
- 12.2.2 Recent Developments
- 12.3. Company Market Share Analysis 2025
- 12.3.1 Top 5 Companies Market Share Analysis
- 12.3.2 Top 3 Companies Market Share Analysis
- 12.4. List of Potential Customers
- 13. Research Methodology
List of Figures
- Figure 1: Global Spacecraft Industry Revenue Breakdown (Million, %) by Region 2025 & 2033
- Figure 2: North America Spacecraft Industry Revenue (Million), by Production Analysis 2025 & 2033
- Figure 3: North America Spacecraft Industry Revenue Share (%), by Production Analysis 2025 & 2033
- Figure 4: North America Spacecraft Industry Revenue (Million), by Consumption Analysis 2025 & 2033
- Figure 5: North America Spacecraft Industry Revenue Share (%), by Consumption Analysis 2025 & 2033
- Figure 6: North America Spacecraft Industry Revenue (Million), by Import Market Analysis (Value & Volume) 2025 & 2033
- Figure 7: North America Spacecraft Industry Revenue Share (%), by Import Market Analysis (Value & Volume) 2025 & 2033
- Figure 8: North America Spacecraft Industry Revenue (Million), by Export Market Analysis (Value & Volume) 2025 & 2033
- Figure 9: North America Spacecraft Industry Revenue Share (%), by Export Market Analysis (Value & Volume) 2025 & 2033
- Figure 10: North America Spacecraft Industry Revenue (Million), by Price Trend Analysis 2025 & 2033
- Figure 11: North America Spacecraft Industry Revenue Share (%), by Price Trend Analysis 2025 & 2033
- Figure 12: North America Spacecraft Industry Revenue (Million), by Country 2025 & 2033
- Figure 13: North America Spacecraft Industry Revenue Share (%), by Country 2025 & 2033
- Figure 14: South America Spacecraft Industry Revenue (Million), by Production Analysis 2025 & 2033
- Figure 15: South America Spacecraft Industry Revenue Share (%), by Production Analysis 2025 & 2033
- Figure 16: South America Spacecraft Industry Revenue (Million), by Consumption Analysis 2025 & 2033
- Figure 17: South America Spacecraft Industry Revenue Share (%), by Consumption Analysis 2025 & 2033
- Figure 18: South America Spacecraft Industry Revenue (Million), by Import Market Analysis (Value & Volume) 2025 & 2033
- Figure 19: South America Spacecraft Industry Revenue Share (%), by Import Market Analysis (Value & Volume) 2025 & 2033
- Figure 20: South America Spacecraft Industry Revenue (Million), by Export Market Analysis (Value & Volume) 2025 & 2033
- Figure 21: South America Spacecraft Industry Revenue Share (%), by Export Market Analysis (Value & Volume) 2025 & 2033
- Figure 22: South America Spacecraft Industry Revenue (Million), by Price Trend Analysis 2025 & 2033
- Figure 23: South America Spacecraft Industry Revenue Share (%), by Price Trend Analysis 2025 & 2033
- Figure 24: South America Spacecraft Industry Revenue (Million), by Country 2025 & 2033
- Figure 25: South America Spacecraft Industry Revenue Share (%), by Country 2025 & 2033
- Figure 26: Europe Spacecraft Industry Revenue (Million), by Production Analysis 2025 & 2033
- Figure 27: Europe Spacecraft Industry Revenue Share (%), by Production Analysis 2025 & 2033
- Figure 28: Europe Spacecraft Industry Revenue (Million), by Consumption Analysis 2025 & 2033
- Figure 29: Europe Spacecraft Industry Revenue Share (%), by Consumption Analysis 2025 & 2033
- Figure 30: Europe Spacecraft Industry Revenue (Million), by Import Market Analysis (Value & Volume) 2025 & 2033
- Figure 31: Europe Spacecraft Industry Revenue Share (%), by Import Market Analysis (Value & Volume) 2025 & 2033
- Figure 32: Europe Spacecraft Industry Revenue (Million), by Export Market Analysis (Value & Volume) 2025 & 2033
- Figure 33: Europe Spacecraft Industry Revenue Share (%), by Export Market Analysis (Value & Volume) 2025 & 2033
- Figure 34: Europe Spacecraft Industry Revenue (Million), by Price Trend Analysis 2025 & 2033
- Figure 35: Europe Spacecraft Industry Revenue Share (%), by Price Trend Analysis 2025 & 2033
- Figure 36: Europe Spacecraft Industry Revenue (Million), by Country 2025 & 2033
- Figure 37: Europe Spacecraft Industry Revenue Share (%), by Country 2025 & 2033
- Figure 38: Middle East & Africa Spacecraft Industry Revenue (Million), by Production Analysis 2025 & 2033
- Figure 39: Middle East & Africa Spacecraft Industry Revenue Share (%), by Production Analysis 2025 & 2033
- Figure 40: Middle East & Africa Spacecraft Industry Revenue (Million), by Consumption Analysis 2025 & 2033
- Figure 41: Middle East & Africa Spacecraft Industry Revenue Share (%), by Consumption Analysis 2025 & 2033
- Figure 42: Middle East & Africa Spacecraft Industry Revenue (Million), by Import Market Analysis (Value & Volume) 2025 & 2033
- Figure 43: Middle East & Africa Spacecraft Industry Revenue Share (%), by Import Market Analysis (Value & Volume) 2025 & 2033
- Figure 44: Middle East & Africa Spacecraft Industry Revenue (Million), by Export Market Analysis (Value & Volume) 2025 & 2033
- Figure 45: Middle East & Africa Spacecraft Industry Revenue Share (%), by Export Market Analysis (Value & Volume) 2025 & 2033
- Figure 46: Middle East & Africa Spacecraft Industry Revenue (Million), by Price Trend Analysis 2025 & 2033
- Figure 47: Middle East & Africa Spacecraft Industry Revenue Share (%), by Price Trend Analysis 2025 & 2033
- Figure 48: Middle East & Africa Spacecraft Industry Revenue (Million), by Country 2025 & 2033
- Figure 49: Middle East & Africa Spacecraft Industry Revenue Share (%), by Country 2025 & 2033
- Figure 50: Asia Pacific Spacecraft Industry Revenue (Million), by Production Analysis 2025 & 2033
- Figure 51: Asia Pacific Spacecraft Industry Revenue Share (%), by Production Analysis 2025 & 2033
- Figure 52: Asia Pacific Spacecraft Industry Revenue (Million), by Consumption Analysis 2025 & 2033
- Figure 53: Asia Pacific Spacecraft Industry Revenue Share (%), by Consumption Analysis 2025 & 2033
- Figure 54: Asia Pacific Spacecraft Industry Revenue (Million), by Import Market Analysis (Value & Volume) 2025 & 2033
- Figure 55: Asia Pacific Spacecraft Industry Revenue Share (%), by Import Market Analysis (Value & Volume) 2025 & 2033
- Figure 56: Asia Pacific Spacecraft Industry Revenue (Million), by Export Market Analysis (Value & Volume) 2025 & 2033
- Figure 57: Asia Pacific Spacecraft Industry Revenue Share (%), by Export Market Analysis (Value & Volume) 2025 & 2033
- Figure 58: Asia Pacific Spacecraft Industry Revenue (Million), by Price Trend Analysis 2025 & 2033
- Figure 59: Asia Pacific Spacecraft Industry Revenue Share (%), by Price Trend Analysis 2025 & 2033
- Figure 60: Asia Pacific Spacecraft Industry Revenue (Million), by Country 2025 & 2033
- Figure 61: Asia Pacific Spacecraft Industry Revenue Share (%), by Country 2025 & 2033
List of Tables
- Table 1: Global Spacecraft Industry Revenue Million Forecast, by Production Analysis 2020 & 2033
- Table 2: Global Spacecraft Industry Revenue Million Forecast, by Consumption Analysis 2020 & 2033
- Table 3: Global Spacecraft Industry Revenue Million Forecast, by Import Market Analysis (Value & Volume) 2020 & 2033
- Table 4: Global Spacecraft Industry Revenue Million Forecast, by Export Market Analysis (Value & Volume) 2020 & 2033
- Table 5: Global Spacecraft Industry Revenue Million Forecast, by Price Trend Analysis 2020 & 2033
- Table 6: Global Spacecraft Industry Revenue Million Forecast, by Region 2020 & 2033
- Table 7: Global Spacecraft Industry Revenue Million Forecast, by Production Analysis 2020 & 2033
- Table 8: Global Spacecraft Industry Revenue Million Forecast, by Consumption Analysis 2020 & 2033
- Table 9: Global Spacecraft Industry Revenue Million Forecast, by Import Market Analysis (Value & Volume) 2020 & 2033
- Table 10: Global Spacecraft Industry Revenue Million Forecast, by Export Market Analysis (Value & Volume) 2020 & 2033
- Table 11: Global Spacecraft Industry Revenue Million Forecast, by Price Trend Analysis 2020 & 2033
- Table 12: Global Spacecraft Industry Revenue Million Forecast, by Country 2020 & 2033
- Table 13: United States Spacecraft Industry Revenue (Million) Forecast, by Application 2020 & 2033
- Table 14: Canada Spacecraft Industry Revenue (Million) Forecast, by Application 2020 & 2033
- Table 15: Mexico Spacecraft Industry Revenue (Million) Forecast, by Application 2020 & 2033
- Table 16: Global Spacecraft Industry Revenue Million Forecast, by Production Analysis 2020 & 2033
- Table 17: Global Spacecraft Industry Revenue Million Forecast, by Consumption Analysis 2020 & 2033
- Table 18: Global Spacecraft Industry Revenue Million Forecast, by Import Market Analysis (Value & Volume) 2020 & 2033
- Table 19: Global Spacecraft Industry Revenue Million Forecast, by Export Market Analysis (Value & Volume) 2020 & 2033
- Table 20: Global Spacecraft Industry Revenue Million Forecast, by Price Trend Analysis 2020 & 2033
- Table 21: Global Spacecraft Industry Revenue Million Forecast, by Country 2020 & 2033
- Table 22: Brazil Spacecraft Industry Revenue (Million) Forecast, by Application 2020 & 2033
- Table 23: Argentina Spacecraft Industry Revenue (Million) Forecast, by Application 2020 & 2033
- Table 24: Rest of South America Spacecraft Industry Revenue (Million) Forecast, by Application 2020 & 2033
- Table 25: Global Spacecraft Industry Revenue Million Forecast, by Production Analysis 2020 & 2033
- Table 26: Global Spacecraft Industry Revenue Million Forecast, by Consumption Analysis 2020 & 2033
- Table 27: Global Spacecraft Industry Revenue Million Forecast, by Import Market Analysis (Value & Volume) 2020 & 2033
- Table 28: Global Spacecraft Industry Revenue Million Forecast, by Export Market Analysis (Value & Volume) 2020 & 2033
- Table 29: Global Spacecraft Industry Revenue Million Forecast, by Price Trend Analysis 2020 & 2033
- Table 30: Global Spacecraft Industry Revenue Million Forecast, by Country 2020 & 2033
- Table 31: United Kingdom Spacecraft Industry Revenue (Million) Forecast, by Application 2020 & 2033
- Table 32: Germany Spacecraft Industry Revenue (Million) Forecast, by Application 2020 & 2033
- Table 33: France Spacecraft Industry Revenue (Million) Forecast, by Application 2020 & 2033
- Table 34: Italy Spacecraft Industry Revenue (Million) Forecast, by Application 2020 & 2033
- Table 35: Spain Spacecraft Industry Revenue (Million) Forecast, by Application 2020 & 2033
- Table 36: Russia Spacecraft Industry Revenue (Million) Forecast, by Application 2020 & 2033
- Table 37: Benelux Spacecraft Industry Revenue (Million) Forecast, by Application 2020 & 2033
- Table 38: Nordics Spacecraft Industry Revenue (Million) Forecast, by Application 2020 & 2033
- Table 39: Rest of Europe Spacecraft Industry Revenue (Million) Forecast, by Application 2020 & 2033
- Table 40: Global Spacecraft Industry Revenue Million Forecast, by Production Analysis 2020 & 2033
- Table 41: Global Spacecraft Industry Revenue Million Forecast, by Consumption Analysis 2020 & 2033
- Table 42: Global Spacecraft Industry Revenue Million Forecast, by Import Market Analysis (Value & Volume) 2020 & 2033
- Table 43: Global Spacecraft Industry Revenue Million Forecast, by Export Market Analysis (Value & Volume) 2020 & 2033
- Table 44: Global Spacecraft Industry Revenue Million Forecast, by Price Trend Analysis 2020 & 2033
- Table 45: Global Spacecraft Industry Revenue Million Forecast, by Country 2020 & 2033
- Table 46: Turkey Spacecraft Industry Revenue (Million) Forecast, by Application 2020 & 2033
- Table 47: Israel Spacecraft Industry Revenue (Million) Forecast, by Application 2020 & 2033
- Table 48: GCC Spacecraft Industry Revenue (Million) Forecast, by Application 2020 & 2033
- Table 49: North Africa Spacecraft Industry Revenue (Million) Forecast, by Application 2020 & 2033
- Table 50: South Africa Spacecraft Industry Revenue (Million) Forecast, by Application 2020 & 2033
- Table 51: Rest of Middle East & Africa Spacecraft Industry Revenue (Million) Forecast, by Application 2020 & 2033
- Table 52: Global Spacecraft Industry Revenue Million Forecast, by Production Analysis 2020 & 2033
- Table 53: Global Spacecraft Industry Revenue Million Forecast, by Consumption Analysis 2020 & 2033
- Table 54: Global Spacecraft Industry Revenue Million Forecast, by Import Market Analysis (Value & Volume) 2020 & 2033
- Table 55: Global Spacecraft Industry Revenue Million Forecast, by Export Market Analysis (Value & Volume) 2020 & 2033
- Table 56: Global Spacecraft Industry Revenue Million Forecast, by Price Trend Analysis 2020 & 2033
- Table 57: Global Spacecraft Industry Revenue Million Forecast, by Country 2020 & 2033
- Table 58: China Spacecraft Industry Revenue (Million) Forecast, by Application 2020 & 2033
- Table 59: India Spacecraft Industry Revenue (Million) Forecast, by Application 2020 & 2033
- Table 60: Japan Spacecraft Industry Revenue (Million) Forecast, by Application 2020 & 2033
- Table 61: South Korea Spacecraft Industry Revenue (Million) Forecast, by Application 2020 & 2033
- Table 62: ASEAN Spacecraft Industry Revenue (Million) Forecast, by Application 2020 & 2033
- Table 63: Oceania Spacecraft Industry Revenue (Million) Forecast, by Application 2020 & 2033
- Table 64: Rest of Asia Pacific Spacecraft Industry Revenue (Million) Forecast, by Application 2020 & 2033
Frequently Asked Questions
1. What is the projected Compound Annual Growth Rate (CAGR) of the Spacecraft Industry?
The projected CAGR is approximately 4.74%.
2. Which companies are prominent players in the Spacecraft Industry?
Key companies in the market include Space Exploration Technologies Corp, Lockheed Martin Corporation, Mitsubishi Electric Corporatio, Airbus SE, Sierra Nevada Corporation, QinetiQ Group, OHB SE, Maxar Technologies Inc, Blue Origin LLC, Berlin Space Technologies GmbH, Northrop Grumman Corporation, The Boeing Company.
3. What are the main segments of the Spacecraft Industry?
The market segments include Production Analysis, Consumption Analysis, Import Market Analysis (Value & Volume), Export Market Analysis (Value & Volume), Price Trend Analysis.
4. Can you provide details about the market size?
The market size is estimated to be USD 6.89 Million as of 2022.
5. What are some drivers contributing to market growth?
Increase in Internet of Things (IoT) and Autonomous Systems; Rise in Demand for Military and Defense Satellite Communication Solutions.
6. What are the notable trends driving market growth?
Unmanned Spacecraft to Dominate Market Share During the Forecast Period.
7. Are there any restraints impacting market growth?
Cybersecurity Threats to Satellite Communication; Interference in Transmission of Data.
8. Can you provide examples of recent developments in the market?
January 2024: Japan launched a spacecraft on the Moon to demonstrate precision landing technology and reinvigorate its space program. The Japan Aerospace Exploration Agency's (JAXA) Smart Lander for Investigating Moon (SLIM) landed on the Moon's surface and re-established communication with Earth. By reducing the cost of launching, Japan aims to carry out more frequent missions in the future.
9. What pricing options are available for accessing the report?
Pricing options include single-user, multi-user, and enterprise licenses priced at USD 4750, USD 5250, and USD 8750 respectively.
10. Is the market size provided in terms of value or volume?
The market size is provided in terms of value, measured in Million.
11. Are there any specific market keywords associated with the report?
Yes, the market keyword associated with the report is "Spacecraft Industry," which aids in identifying and referencing the specific market segment covered.
12. How do I determine which pricing option suits my needs best?
The pricing options vary based on user requirements and access needs. Individual users may opt for single-user licenses, while businesses requiring broader access may choose multi-user or enterprise licenses for cost-effective access to the report.
13. Are there any additional resources or data provided in the Spacecraft Industry report?
While the report offers comprehensive insights, it's advisable to review the specific contents or supplementary materials provided to ascertain if additional resources or data are available.
14. How can I stay updated on further developments or reports in the Spacecraft Industry?
To stay informed about further developments, trends, and reports in the Spacecraft Industry, consider subscribing to industry newsletters, following relevant companies and organizations, or regularly checking reputable industry news sources and publications.
Methodology
Step 1 - Identification of Relevant Samples Size from Population Database


Step 2 - Approaches for Defining Global Market Size (Value, Volume* & Price*)

Note*: In applicable scenarios
Step 3 - Data Sources
Primary Research
- Web Analytics
- Survey Reports
- Research Institute
- Latest Research Reports
- Opinion Leaders
Secondary Research
- Annual Reports
- White Paper
- Latest Press Release
- Industry Association
- Paid Database
- Investor Presentations

Step 4 - Data Triangulation
Involves using different sources of information in order to increase the validity of a study
These sources are likely to be stakeholders in a program - participants, other researchers, program staff, other community members, and so on.
Then we put all data in single framework & apply various statistical tools to find out the dynamic on the market.
During the analysis stage, feedback from the stakeholder groups would be compared to determine areas of agreement as well as areas of divergence