

Key Insights
The smart polymers market is experiencing robust growth, driven by increasing demand across diverse sectors. The market's Compound Annual Growth Rate (CAGR) exceeding 15% from 2019 to 2024 indicates significant expansion, projected to continue through 2033. Key drivers include the rising adoption of smart polymers in biomedical applications (drug delivery systems, tissue engineering, biosensors), the burgeoning electronics industry requiring advanced materials for flexible displays and sensors, and the growing automotive sector seeking lightweight and high-performance components. Furthermore, advancements in materials science, leading to the development of novel stimuli-responsive polymers with enhanced properties like self-healing capabilities, are fueling market expansion. The segmentation by type (physical, chemical, biological stimuli-responsive) highlights the versatility of these materials, while the end-user industry breakdown showcases their widespread applications across healthcare, electronics, textiles, and automotive. Major players like Nouryon, Merck KGaA, and Evonik Industries are driving innovation and market penetration through R&D investments and strategic partnerships. Geographic analysis reveals strong growth in the Asia-Pacific region, driven by increasing industrialization and rising disposable incomes in countries like China and India. North America and Europe also represent significant markets, fueled by strong technological advancements and established industries. The market is expected to witness considerable expansion in the coming years, presenting substantial opportunities for both established players and emerging companies in the smart polymers space.
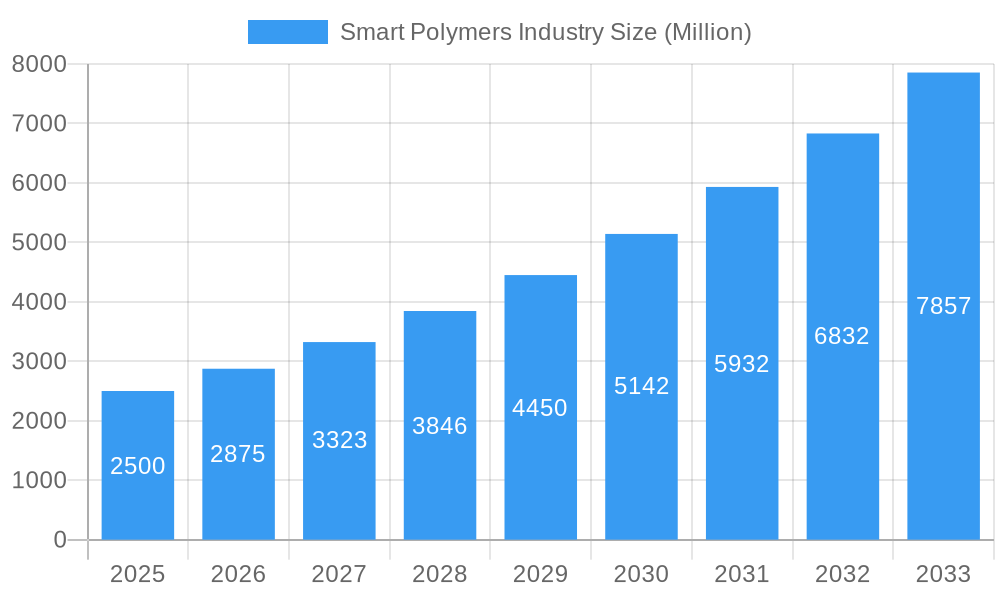
Smart Polymers Industry Market Size (In Billion)
The market's future trajectory is positive, particularly influenced by ongoing research into biocompatible and biodegradable smart polymers. This focus is expected to further propel growth within the biomedical and healthcare sectors. The increasing focus on sustainability and the development of eco-friendly smart polymers will also contribute to the market's expansion. While challenges remain, such as the high cost of production for some advanced smart polymers and potential regulatory hurdles, the overall market outlook remains bullish. The versatility and adaptability of smart polymers across multiple industries ensure its continued importance in materials science and technological advancements, promising substantial revenue growth over the forecast period. Competitive dynamics will likely involve ongoing innovation, strategic acquisitions, and the introduction of new, specialized smart polymer solutions catering to specific industry needs.
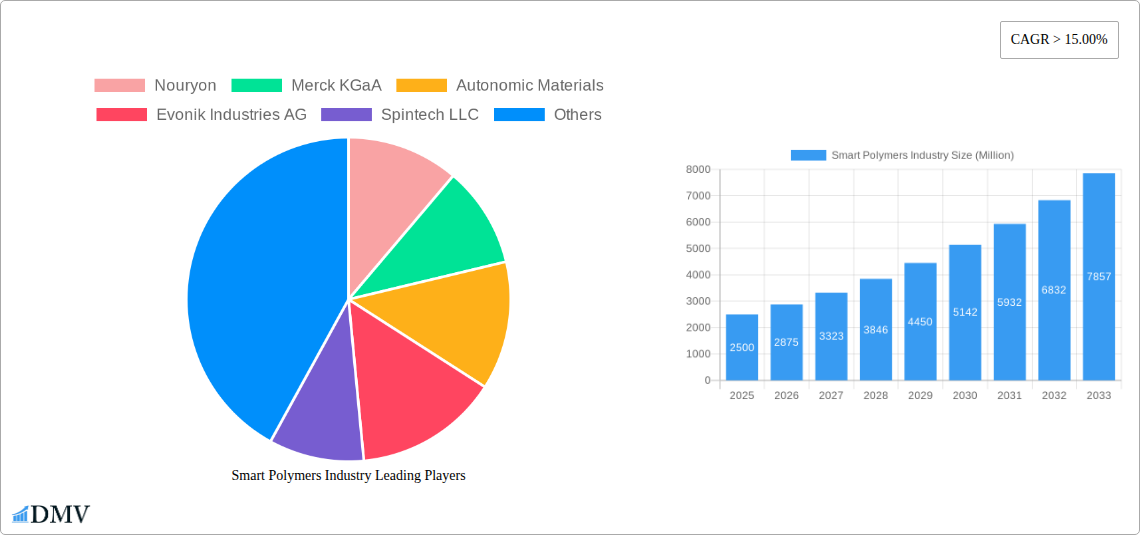
Smart Polymers Industry Company Market Share
Smart Polymers Industry Market Report: 2019-2033
This comprehensive report provides a detailed analysis of the Smart Polymers industry, offering invaluable insights for stakeholders seeking to navigate this dynamic market. From market sizing and segmentation to future trends and key players, this report equips you with the knowledge needed to make informed strategic decisions. The study period covers 2019-2033, with a base year of 2025 and a forecast period of 2025-2033. The market is expected to reach xx Million by 2033, exhibiting a CAGR of xx% during the forecast period.
Smart Polymers Industry Market Composition & Trends
The global Smart Polymers market, valued at xx Million in 2025, is characterized by a moderately concentrated landscape with key players like Nouryon, Merck KGaA, Evonik Industries AG, and DuPont holding significant market share. However, the emergence of innovative smaller companies like Autonomic Materials and SMP Technologies Inc. is fostering competition and driving innovation. The market is segmented by polymer type (Physical Stimuli-responsive, Chemical Stimuli-responsive, pH-responsive, Biological Stimuli-responsive, Enzymes-responsive, Self-healing Polymers, and Other Types), end-user industry (Biomedical and Healthcare, Electrical and Electronics, Textile, Automotive, and Other End-user Industries), and specific applications.
- Market Share Distribution: The top five players collectively hold approximately xx% of the market share in 2025.
- Innovation Catalysts: Significant R&D investments, particularly in self-healing and bio-responsive polymers, are driving market innovation.
- Regulatory Landscape: Stringent environmental regulations are influencing the development and adoption of sustainable smart polymer solutions.
- Substitute Products: Traditional polymers and alternative materials pose competitive pressure, although the unique functionalities of smart polymers offer a distinct advantage in specific applications.
- End-User Profiles: The biomedical and healthcare sector is currently the largest end-user segment, driven by increasing demand for advanced medical devices and drug delivery systems.
- M&A Activities: The acquisition of JeNaCell by Evonik in 2021 exemplifies the strategic consolidation within the industry, indicating a potential increase in M&A activity with deal values expected to reach xx Million annually by 2030.
Smart Polymers Industry Industry Evolution
The Smart Polymers market has witnessed significant growth over the historical period (2019-2024), fueled by technological advancements and increasing demand across diverse end-user industries. The introduction of novel materials with enhanced properties, such as improved responsiveness, durability, and biocompatibility, has broadened the applications of smart polymers. The market is experiencing a shift towards sustainable and biodegradable options, driven by growing environmental concerns. The development of innovative manufacturing processes and the exploration of novel polymer chemistries continue to shape the market's trajectory. Specifically, the self-healing polymers segment is projected to grow at a CAGR of xx% between 2025 and 2033, driven primarily by the increasing demand from the automotive and aerospace industries. Adoption rates for smart polymers are growing steadily, with a projected xx% increase in adoption across various sectors over the forecast period. Market growth is strongly correlated with technological advancements, particularly in areas such as nanotechnology and biotechnology, enabling the creation of highly specialized and functional smart polymers. The increasing demand for advanced materials in emerging technologies such as 5G networks and flexible electronics are significant factors in driving growth in the electrical and electronics segment.
Leading Regions, Countries, or Segments in Smart Polymers Industry
Dominant Regions: North America and Europe currently hold the largest market share, driven by strong R&D investments and established manufacturing infrastructure. However, Asia-Pacific is expected to witness the fastest growth rate during the forecast period, fueled by rapid industrialization and increasing demand from developing economies.
Key Drivers:
- Investment Trends: Significant private and public sector investments are fueling innovation and expansion in the smart polymers market.
- Regulatory Support: Government initiatives promoting the development and adoption of sustainable materials are creating favorable market conditions.
Segment Analysis:
- Biomedical and Healthcare: This segment holds the largest market share, driven by the growing demand for advanced medical devices and drug delivery systems that leverage the unique properties of smart polymers.
- Electrical and Electronics: The increasing demand for flexible electronics and advanced sensors is boosting the adoption of smart polymers in this sector.
- Self-healing Polymers: This segment is characterized by high growth potential, driven by the demand for durable and long-lasting materials in various applications.
The dominance of North America and Europe is primarily attributed to the established research infrastructure and the presence of key players within these regions. The Asia-Pacific region is projected to experience significant growth, driven by rapid industrialization and increasing demand from various end-user industries.
Smart Polymers Industry Product Innovations
Recent innovations in smart polymers encompass the development of self-healing materials with enhanced durability and improved responsiveness to environmental stimuli. New formulations are being developed to enhance biocompatibility and reduce toxicity, broadening their applications in biomedical and healthcare. Significant advancements in manufacturing processes are enabling the production of cost-effective and high-performance smart polymers. Unique selling propositions include enhanced performance characteristics such as increased strength, flexibility, and responsiveness to specific stimuli, thus making them desirable for a wide range of applications.
Propelling Factors for Smart Polymers Industry Growth
Technological advancements in polymer chemistry and materials science are primary growth drivers. The increasing demand for high-performance materials in various sectors fuels market expansion. Favorable government regulations and incentives promoting sustainable materials further accelerate growth. For instance, the development of biodegradable and compostable smart polymers is reducing environmental concerns and enhancing their appeal.
Obstacles in the Smart Polymers Industry Market
High production costs and the complexity of manufacturing processes remain significant barriers. Supply chain disruptions and fluctuations in raw material prices pose challenges. Intense competition from traditional polymers and alternative materials may limit market penetration in certain applications. Stringent regulatory requirements for specific applications, like those in the biomedical sector, can also impede growth.
Future Opportunities in Smart Polymers Industry
Emerging applications in areas like 3D printing and flexible electronics offer vast growth potential. The development of smart polymers with enhanced functionalities, such as improved conductivity and self-healing capabilities, creates new market opportunities. The increasing demand for sustainable and biodegradable materials opens up possibilities for environmentally friendly applications.
Major Players in the Smart Polymers Industry Ecosystem
- Nouryon
- Merck KGaA
- Autonomic Materials
- Evonik Industries AG
- Spintech LLC
- Huntsman International LLC
- DuPont
- The Lubrizol Corporation
- Covestro AG
- SMP Technologies Inc
- TNO
Key Developments in Smart Polymers Industry Industry
- August 2021: Evonik acquired the German biotech company JeNaCell, expanding its biomaterials portfolio.
- March 2021: Nouryon launched LumaTreat, a new water management product line featuring a smart-tagged polymer.
Strategic Smart Polymers Industry Market Forecast
The Smart Polymers market is poised for robust growth, driven by ongoing technological advancements and increasing demand across diverse sectors. The development of sustainable and high-performance materials will continue to shape market dynamics. Emerging applications in areas such as flexible electronics and 3D printing will unlock new growth opportunities, leading to significant market expansion over the forecast period.
Smart Polymers Industry Segmentation
-
1. Type
- 1.1. Physical Stimuli-responsive
- 1.2. Chemical Stimuli-responsive
- 1.3. Biological Stimuli-responsive
- 1.4. Self-healing Polymers
- 1.5. Other Types (Thermally Responsive, Etc.)
-
2. End-user Industry
- 2.1. Biomedical and Healthcare
- 2.2. Electrical and Electronics
- 2.3. Textile
- 2.4. Automotive
- 2.5. Other End-user Industries (Agriculture, Etc.)
Smart Polymers Industry Segmentation By Geography
-
1. Asia Pacific
- 1.1. China
- 1.2. India
- 1.3. Japan
- 1.4. South Korea
- 1.5. Rest of Asia Pacific
-
2. North America
- 2.1. United States
- 2.2. Canada
- 2.3. Mexico
-
3. Europe
- 3.1. Germany
- 3.2. United Kingdom
- 3.3. Italy
- 3.4. France
- 3.5. Rest of Europe
-
4. South America
- 4.1. Brazil
- 4.2. Argentina
- 4.3. Rest of South America
-
5. Middle East and Africa
- 5.1. Saudi Arabia
- 5.2. South Africa
- 5.3. Rest of Middle East and Africa

Smart Polymers Industry Regional Market Share
Geographic Coverage of Smart Polymers Industry
Smart Polymers Industry REPORT HIGHLIGHTS
| Aspects | Details |
|---|---|
| Study Period | 2020-2034 |
| Base Year | 2025 |
| Estimated Year | 2026 |
| Forecast Period | 2026-2034 |
| Historical Period | 2020-2025 |
| Growth Rate | CAGR of > 15.00% from 2020-2034 |
| Segmentation |
|
Table of Contents
- 1. Introduction
- 1.1. Research Scope
- 1.2. Market Segmentation
- 1.3. Research Methodology
- 1.4. Definitions and Assumptions
- 2. Executive Summary
- 2.1. Introduction
- 3. Market Dynamics
- 3.1. Introduction
- 3.2. Market Drivers
- 3.2.1. Increasing Application of Shape Memory Polymer in Textile Industry; Increasing Need for Efficient Drug Delivery System; Development of Smart Biopolymers
- 3.3. Market Restrains
- 3.3.1. High Cost of Technology and Development of Smart Polymers; Other Restraints
- 3.4. Market Trends
- 3.4.1. Biomedical and Healthcare to Dominate the Market
- 4. Market Factor Analysis
- 4.1. Porters Five Forces
- 4.2. Supply/Value Chain
- 4.3. PESTEL analysis
- 4.4. Market Entropy
- 4.5. Patent/Trademark Analysis
- 5. Global Smart Polymers Industry Analysis, Insights and Forecast, 2020-2032
- 5.1. Market Analysis, Insights and Forecast - by Type
- 5.1.1. Physical Stimuli-responsive
- 5.1.2. Chemical Stimuli-responsive
- 5.1.3. Biological Stimuli-responsive
- 5.1.4. Self-healing Polymers
- 5.1.5. Other Types (Thermally Responsive, Etc.)
- 5.2. Market Analysis, Insights and Forecast - by End-user Industry
- 5.2.1. Biomedical and Healthcare
- 5.2.2. Electrical and Electronics
- 5.2.3. Textile
- 5.2.4. Automotive
- 5.2.5. Other End-user Industries (Agriculture, Etc.)
- 5.3. Market Analysis, Insights and Forecast - by Region
- 5.3.1. Asia Pacific
- 5.3.2. North America
- 5.3.3. Europe
- 5.3.4. South America
- 5.3.5. Middle East and Africa
- 5.1. Market Analysis, Insights and Forecast - by Type
- 6. Asia Pacific Smart Polymers Industry Analysis, Insights and Forecast, 2020-2032
- 6.1. Market Analysis, Insights and Forecast - by Type
- 6.1.1. Physical Stimuli-responsive
- 6.1.2. Chemical Stimuli-responsive
- 6.1.3. Biological Stimuli-responsive
- 6.1.4. Self-healing Polymers
- 6.1.5. Other Types (Thermally Responsive, Etc.)
- 6.2. Market Analysis, Insights and Forecast - by End-user Industry
- 6.2.1. Biomedical and Healthcare
- 6.2.2. Electrical and Electronics
- 6.2.3. Textile
- 6.2.4. Automotive
- 6.2.5. Other End-user Industries (Agriculture, Etc.)
- 6.1. Market Analysis, Insights and Forecast - by Type
- 7. North America Smart Polymers Industry Analysis, Insights and Forecast, 2020-2032
- 7.1. Market Analysis, Insights and Forecast - by Type
- 7.1.1. Physical Stimuli-responsive
- 7.1.2. Chemical Stimuli-responsive
- 7.1.3. Biological Stimuli-responsive
- 7.1.4. Self-healing Polymers
- 7.1.5. Other Types (Thermally Responsive, Etc.)
- 7.2. Market Analysis, Insights and Forecast - by End-user Industry
- 7.2.1. Biomedical and Healthcare
- 7.2.2. Electrical and Electronics
- 7.2.3. Textile
- 7.2.4. Automotive
- 7.2.5. Other End-user Industries (Agriculture, Etc.)
- 7.1. Market Analysis, Insights and Forecast - by Type
- 8. Europe Smart Polymers Industry Analysis, Insights and Forecast, 2020-2032
- 8.1. Market Analysis, Insights and Forecast - by Type
- 8.1.1. Physical Stimuli-responsive
- 8.1.2. Chemical Stimuli-responsive
- 8.1.3. Biological Stimuli-responsive
- 8.1.4. Self-healing Polymers
- 8.1.5. Other Types (Thermally Responsive, Etc.)
- 8.2. Market Analysis, Insights and Forecast - by End-user Industry
- 8.2.1. Biomedical and Healthcare
- 8.2.2. Electrical and Electronics
- 8.2.3. Textile
- 8.2.4. Automotive
- 8.2.5. Other End-user Industries (Agriculture, Etc.)
- 8.1. Market Analysis, Insights and Forecast - by Type
- 9. South America Smart Polymers Industry Analysis, Insights and Forecast, 2020-2032
- 9.1. Market Analysis, Insights and Forecast - by Type
- 9.1.1. Physical Stimuli-responsive
- 9.1.2. Chemical Stimuli-responsive
- 9.1.3. Biological Stimuli-responsive
- 9.1.4. Self-healing Polymers
- 9.1.5. Other Types (Thermally Responsive, Etc.)
- 9.2. Market Analysis, Insights and Forecast - by End-user Industry
- 9.2.1. Biomedical and Healthcare
- 9.2.2. Electrical and Electronics
- 9.2.3. Textile
- 9.2.4. Automotive
- 9.2.5. Other End-user Industries (Agriculture, Etc.)
- 9.1. Market Analysis, Insights and Forecast - by Type
- 10. Middle East and Africa Smart Polymers Industry Analysis, Insights and Forecast, 2020-2032
- 10.1. Market Analysis, Insights and Forecast - by Type
- 10.1.1. Physical Stimuli-responsive
- 10.1.2. Chemical Stimuli-responsive
- 10.1.3. Biological Stimuli-responsive
- 10.1.4. Self-healing Polymers
- 10.1.5. Other Types (Thermally Responsive, Etc.)
- 10.2. Market Analysis, Insights and Forecast - by End-user Industry
- 10.2.1. Biomedical and Healthcare
- 10.2.2. Electrical and Electronics
- 10.2.3. Textile
- 10.2.4. Automotive
- 10.2.5. Other End-user Industries (Agriculture, Etc.)
- 10.1. Market Analysis, Insights and Forecast - by Type
- 11. Competitive Analysis
- 11.1. Global Market Share Analysis 2025
- 11.2. Company Profiles
- 11.2.1 Nouryon
- 11.2.1.1. Overview
- 11.2.1.2. Products
- 11.2.1.3. SWOT Analysis
- 11.2.1.4. Recent Developments
- 11.2.1.5. Financials (Based on Availability)
- 11.2.2 Merck KGaA
- 11.2.2.1. Overview
- 11.2.2.2. Products
- 11.2.2.3. SWOT Analysis
- 11.2.2.4. Recent Developments
- 11.2.2.5. Financials (Based on Availability)
- 11.2.3 Autonomic Materials
- 11.2.3.1. Overview
- 11.2.3.2. Products
- 11.2.3.3. SWOT Analysis
- 11.2.3.4. Recent Developments
- 11.2.3.5. Financials (Based on Availability)
- 11.2.4 Evonik Industries AG
- 11.2.4.1. Overview
- 11.2.4.2. Products
- 11.2.4.3. SWOT Analysis
- 11.2.4.4. Recent Developments
- 11.2.4.5. Financials (Based on Availability)
- 11.2.5 Spintech LLC
- 11.2.5.1. Overview
- 11.2.5.2. Products
- 11.2.5.3. SWOT Analysis
- 11.2.5.4. Recent Developments
- 11.2.5.5. Financials (Based on Availability)
- 11.2.6 Huntsman International LLC
- 11.2.6.1. Overview
- 11.2.6.2. Products
- 11.2.6.3. SWOT Analysis
- 11.2.6.4. Recent Developments
- 11.2.6.5. Financials (Based on Availability)
- 11.2.7 DuPont
- 11.2.7.1. Overview
- 11.2.7.2. Products
- 11.2.7.3. SWOT Analysis
- 11.2.7.4. Recent Developments
- 11.2.7.5. Financials (Based on Availability)
- 11.2.8 The Lubrizol Corporation
- 11.2.8.1. Overview
- 11.2.8.2. Products
- 11.2.8.3. SWOT Analysis
- 11.2.8.4. Recent Developments
- 11.2.8.5. Financials (Based on Availability)
- 11.2.9 Covestro AG
- 11.2.9.1. Overview
- 11.2.9.2. Products
- 11.2.9.3. SWOT Analysis
- 11.2.9.4. Recent Developments
- 11.2.9.5. Financials (Based on Availability)
- 11.2.10 SMP Technologies Inc
- 11.2.10.1. Overview
- 11.2.10.2. Products
- 11.2.10.3. SWOT Analysis
- 11.2.10.4. Recent Developments
- 11.2.10.5. Financials (Based on Availability)
- 11.2.11 TNO
- 11.2.11.1. Overview
- 11.2.11.2. Products
- 11.2.11.3. SWOT Analysis
- 11.2.11.4. Recent Developments
- 11.2.11.5. Financials (Based on Availability)
- 11.2.1 Nouryon
List of Figures
- Figure 1: Global Smart Polymers Industry Revenue Breakdown (Million, %) by Region 2025 & 2033
- Figure 2: Global Smart Polymers Industry Volume Breakdown (K Tons, %) by Region 2025 & 2033
- Figure 3: Asia Pacific Smart Polymers Industry Revenue (Million), by Type 2025 & 2033
- Figure 4: Asia Pacific Smart Polymers Industry Volume (K Tons), by Type 2025 & 2033
- Figure 5: Asia Pacific Smart Polymers Industry Revenue Share (%), by Type 2025 & 2033
- Figure 6: Asia Pacific Smart Polymers Industry Volume Share (%), by Type 2025 & 2033
- Figure 7: Asia Pacific Smart Polymers Industry Revenue (Million), by End-user Industry 2025 & 2033
- Figure 8: Asia Pacific Smart Polymers Industry Volume (K Tons), by End-user Industry 2025 & 2033
- Figure 9: Asia Pacific Smart Polymers Industry Revenue Share (%), by End-user Industry 2025 & 2033
- Figure 10: Asia Pacific Smart Polymers Industry Volume Share (%), by End-user Industry 2025 & 2033
- Figure 11: Asia Pacific Smart Polymers Industry Revenue (Million), by Country 2025 & 2033
- Figure 12: Asia Pacific Smart Polymers Industry Volume (K Tons), by Country 2025 & 2033
- Figure 13: Asia Pacific Smart Polymers Industry Revenue Share (%), by Country 2025 & 2033
- Figure 14: Asia Pacific Smart Polymers Industry Volume Share (%), by Country 2025 & 2033
- Figure 15: North America Smart Polymers Industry Revenue (Million), by Type 2025 & 2033
- Figure 16: North America Smart Polymers Industry Volume (K Tons), by Type 2025 & 2033
- Figure 17: North America Smart Polymers Industry Revenue Share (%), by Type 2025 & 2033
- Figure 18: North America Smart Polymers Industry Volume Share (%), by Type 2025 & 2033
- Figure 19: North America Smart Polymers Industry Revenue (Million), by End-user Industry 2025 & 2033
- Figure 20: North America Smart Polymers Industry Volume (K Tons), by End-user Industry 2025 & 2033
- Figure 21: North America Smart Polymers Industry Revenue Share (%), by End-user Industry 2025 & 2033
- Figure 22: North America Smart Polymers Industry Volume Share (%), by End-user Industry 2025 & 2033
- Figure 23: North America Smart Polymers Industry Revenue (Million), by Country 2025 & 2033
- Figure 24: North America Smart Polymers Industry Volume (K Tons), by Country 2025 & 2033
- Figure 25: North America Smart Polymers Industry Revenue Share (%), by Country 2025 & 2033
- Figure 26: North America Smart Polymers Industry Volume Share (%), by Country 2025 & 2033
- Figure 27: Europe Smart Polymers Industry Revenue (Million), by Type 2025 & 2033
- Figure 28: Europe Smart Polymers Industry Volume (K Tons), by Type 2025 & 2033
- Figure 29: Europe Smart Polymers Industry Revenue Share (%), by Type 2025 & 2033
- Figure 30: Europe Smart Polymers Industry Volume Share (%), by Type 2025 & 2033
- Figure 31: Europe Smart Polymers Industry Revenue (Million), by End-user Industry 2025 & 2033
- Figure 32: Europe Smart Polymers Industry Volume (K Tons), by End-user Industry 2025 & 2033
- Figure 33: Europe Smart Polymers Industry Revenue Share (%), by End-user Industry 2025 & 2033
- Figure 34: Europe Smart Polymers Industry Volume Share (%), by End-user Industry 2025 & 2033
- Figure 35: Europe Smart Polymers Industry Revenue (Million), by Country 2025 & 2033
- Figure 36: Europe Smart Polymers Industry Volume (K Tons), by Country 2025 & 2033
- Figure 37: Europe Smart Polymers Industry Revenue Share (%), by Country 2025 & 2033
- Figure 38: Europe Smart Polymers Industry Volume Share (%), by Country 2025 & 2033
- Figure 39: South America Smart Polymers Industry Revenue (Million), by Type 2025 & 2033
- Figure 40: South America Smart Polymers Industry Volume (K Tons), by Type 2025 & 2033
- Figure 41: South America Smart Polymers Industry Revenue Share (%), by Type 2025 & 2033
- Figure 42: South America Smart Polymers Industry Volume Share (%), by Type 2025 & 2033
- Figure 43: South America Smart Polymers Industry Revenue (Million), by End-user Industry 2025 & 2033
- Figure 44: South America Smart Polymers Industry Volume (K Tons), by End-user Industry 2025 & 2033
- Figure 45: South America Smart Polymers Industry Revenue Share (%), by End-user Industry 2025 & 2033
- Figure 46: South America Smart Polymers Industry Volume Share (%), by End-user Industry 2025 & 2033
- Figure 47: South America Smart Polymers Industry Revenue (Million), by Country 2025 & 2033
- Figure 48: South America Smart Polymers Industry Volume (K Tons), by Country 2025 & 2033
- Figure 49: South America Smart Polymers Industry Revenue Share (%), by Country 2025 & 2033
- Figure 50: South America Smart Polymers Industry Volume Share (%), by Country 2025 & 2033
- Figure 51: Middle East and Africa Smart Polymers Industry Revenue (Million), by Type 2025 & 2033
- Figure 52: Middle East and Africa Smart Polymers Industry Volume (K Tons), by Type 2025 & 2033
- Figure 53: Middle East and Africa Smart Polymers Industry Revenue Share (%), by Type 2025 & 2033
- Figure 54: Middle East and Africa Smart Polymers Industry Volume Share (%), by Type 2025 & 2033
- Figure 55: Middle East and Africa Smart Polymers Industry Revenue (Million), by End-user Industry 2025 & 2033
- Figure 56: Middle East and Africa Smart Polymers Industry Volume (K Tons), by End-user Industry 2025 & 2033
- Figure 57: Middle East and Africa Smart Polymers Industry Revenue Share (%), by End-user Industry 2025 & 2033
- Figure 58: Middle East and Africa Smart Polymers Industry Volume Share (%), by End-user Industry 2025 & 2033
- Figure 59: Middle East and Africa Smart Polymers Industry Revenue (Million), by Country 2025 & 2033
- Figure 60: Middle East and Africa Smart Polymers Industry Volume (K Tons), by Country 2025 & 2033
- Figure 61: Middle East and Africa Smart Polymers Industry Revenue Share (%), by Country 2025 & 2033
- Figure 62: Middle East and Africa Smart Polymers Industry Volume Share (%), by Country 2025 & 2033
List of Tables
- Table 1: Global Smart Polymers Industry Revenue Million Forecast, by Type 2020 & 2033
- Table 2: Global Smart Polymers Industry Volume K Tons Forecast, by Type 2020 & 2033
- Table 3: Global Smart Polymers Industry Revenue Million Forecast, by End-user Industry 2020 & 2033
- Table 4: Global Smart Polymers Industry Volume K Tons Forecast, by End-user Industry 2020 & 2033
- Table 5: Global Smart Polymers Industry Revenue Million Forecast, by Region 2020 & 2033
- Table 6: Global Smart Polymers Industry Volume K Tons Forecast, by Region 2020 & 2033
- Table 7: Global Smart Polymers Industry Revenue Million Forecast, by Type 2020 & 2033
- Table 8: Global Smart Polymers Industry Volume K Tons Forecast, by Type 2020 & 2033
- Table 9: Global Smart Polymers Industry Revenue Million Forecast, by End-user Industry 2020 & 2033
- Table 10: Global Smart Polymers Industry Volume K Tons Forecast, by End-user Industry 2020 & 2033
- Table 11: Global Smart Polymers Industry Revenue Million Forecast, by Country 2020 & 2033
- Table 12: Global Smart Polymers Industry Volume K Tons Forecast, by Country 2020 & 2033
- Table 13: China Smart Polymers Industry Revenue (Million) Forecast, by Application 2020 & 2033
- Table 14: China Smart Polymers Industry Volume (K Tons) Forecast, by Application 2020 & 2033
- Table 15: India Smart Polymers Industry Revenue (Million) Forecast, by Application 2020 & 2033
- Table 16: India Smart Polymers Industry Volume (K Tons) Forecast, by Application 2020 & 2033
- Table 17: Japan Smart Polymers Industry Revenue (Million) Forecast, by Application 2020 & 2033
- Table 18: Japan Smart Polymers Industry Volume (K Tons) Forecast, by Application 2020 & 2033
- Table 19: South Korea Smart Polymers Industry Revenue (Million) Forecast, by Application 2020 & 2033
- Table 20: South Korea Smart Polymers Industry Volume (K Tons) Forecast, by Application 2020 & 2033
- Table 21: Rest of Asia Pacific Smart Polymers Industry Revenue (Million) Forecast, by Application 2020 & 2033
- Table 22: Rest of Asia Pacific Smart Polymers Industry Volume (K Tons) Forecast, by Application 2020 & 2033
- Table 23: Global Smart Polymers Industry Revenue Million Forecast, by Type 2020 & 2033
- Table 24: Global Smart Polymers Industry Volume K Tons Forecast, by Type 2020 & 2033
- Table 25: Global Smart Polymers Industry Revenue Million Forecast, by End-user Industry 2020 & 2033
- Table 26: Global Smart Polymers Industry Volume K Tons Forecast, by End-user Industry 2020 & 2033
- Table 27: Global Smart Polymers Industry Revenue Million Forecast, by Country 2020 & 2033
- Table 28: Global Smart Polymers Industry Volume K Tons Forecast, by Country 2020 & 2033
- Table 29: United States Smart Polymers Industry Revenue (Million) Forecast, by Application 2020 & 2033
- Table 30: United States Smart Polymers Industry Volume (K Tons) Forecast, by Application 2020 & 2033
- Table 31: Canada Smart Polymers Industry Revenue (Million) Forecast, by Application 2020 & 2033
- Table 32: Canada Smart Polymers Industry Volume (K Tons) Forecast, by Application 2020 & 2033
- Table 33: Mexico Smart Polymers Industry Revenue (Million) Forecast, by Application 2020 & 2033
- Table 34: Mexico Smart Polymers Industry Volume (K Tons) Forecast, by Application 2020 & 2033
- Table 35: Global Smart Polymers Industry Revenue Million Forecast, by Type 2020 & 2033
- Table 36: Global Smart Polymers Industry Volume K Tons Forecast, by Type 2020 & 2033
- Table 37: Global Smart Polymers Industry Revenue Million Forecast, by End-user Industry 2020 & 2033
- Table 38: Global Smart Polymers Industry Volume K Tons Forecast, by End-user Industry 2020 & 2033
- Table 39: Global Smart Polymers Industry Revenue Million Forecast, by Country 2020 & 2033
- Table 40: Global Smart Polymers Industry Volume K Tons Forecast, by Country 2020 & 2033
- Table 41: Germany Smart Polymers Industry Revenue (Million) Forecast, by Application 2020 & 2033
- Table 42: Germany Smart Polymers Industry Volume (K Tons) Forecast, by Application 2020 & 2033
- Table 43: United Kingdom Smart Polymers Industry Revenue (Million) Forecast, by Application 2020 & 2033
- Table 44: United Kingdom Smart Polymers Industry Volume (K Tons) Forecast, by Application 2020 & 2033
- Table 45: Italy Smart Polymers Industry Revenue (Million) Forecast, by Application 2020 & 2033
- Table 46: Italy Smart Polymers Industry Volume (K Tons) Forecast, by Application 2020 & 2033
- Table 47: France Smart Polymers Industry Revenue (Million) Forecast, by Application 2020 & 2033
- Table 48: France Smart Polymers Industry Volume (K Tons) Forecast, by Application 2020 & 2033
- Table 49: Rest of Europe Smart Polymers Industry Revenue (Million) Forecast, by Application 2020 & 2033
- Table 50: Rest of Europe Smart Polymers Industry Volume (K Tons) Forecast, by Application 2020 & 2033
- Table 51: Global Smart Polymers Industry Revenue Million Forecast, by Type 2020 & 2033
- Table 52: Global Smart Polymers Industry Volume K Tons Forecast, by Type 2020 & 2033
- Table 53: Global Smart Polymers Industry Revenue Million Forecast, by End-user Industry 2020 & 2033
- Table 54: Global Smart Polymers Industry Volume K Tons Forecast, by End-user Industry 2020 & 2033
- Table 55: Global Smart Polymers Industry Revenue Million Forecast, by Country 2020 & 2033
- Table 56: Global Smart Polymers Industry Volume K Tons Forecast, by Country 2020 & 2033
- Table 57: Brazil Smart Polymers Industry Revenue (Million) Forecast, by Application 2020 & 2033
- Table 58: Brazil Smart Polymers Industry Volume (K Tons) Forecast, by Application 2020 & 2033
- Table 59: Argentina Smart Polymers Industry Revenue (Million) Forecast, by Application 2020 & 2033
- Table 60: Argentina Smart Polymers Industry Volume (K Tons) Forecast, by Application 2020 & 2033
- Table 61: Rest of South America Smart Polymers Industry Revenue (Million) Forecast, by Application 2020 & 2033
- Table 62: Rest of South America Smart Polymers Industry Volume (K Tons) Forecast, by Application 2020 & 2033
- Table 63: Global Smart Polymers Industry Revenue Million Forecast, by Type 2020 & 2033
- Table 64: Global Smart Polymers Industry Volume K Tons Forecast, by Type 2020 & 2033
- Table 65: Global Smart Polymers Industry Revenue Million Forecast, by End-user Industry 2020 & 2033
- Table 66: Global Smart Polymers Industry Volume K Tons Forecast, by End-user Industry 2020 & 2033
- Table 67: Global Smart Polymers Industry Revenue Million Forecast, by Country 2020 & 2033
- Table 68: Global Smart Polymers Industry Volume K Tons Forecast, by Country 2020 & 2033
- Table 69: Saudi Arabia Smart Polymers Industry Revenue (Million) Forecast, by Application 2020 & 2033
- Table 70: Saudi Arabia Smart Polymers Industry Volume (K Tons) Forecast, by Application 2020 & 2033
- Table 71: South Africa Smart Polymers Industry Revenue (Million) Forecast, by Application 2020 & 2033
- Table 72: South Africa Smart Polymers Industry Volume (K Tons) Forecast, by Application 2020 & 2033
- Table 73: Rest of Middle East and Africa Smart Polymers Industry Revenue (Million) Forecast, by Application 2020 & 2033
- Table 74: Rest of Middle East and Africa Smart Polymers Industry Volume (K Tons) Forecast, by Application 2020 & 2033
Frequently Asked Questions
1. What is the projected Compound Annual Growth Rate (CAGR) of the Smart Polymers Industry?
The projected CAGR is approximately > 15.00%.
2. Which companies are prominent players in the Smart Polymers Industry?
Key companies in the market include Nouryon, Merck KGaA, Autonomic Materials, Evonik Industries AG, Spintech LLC, Huntsman International LLC, DuPont, The Lubrizol Corporation, Covestro AG, SMP Technologies Inc, TNO.
3. What are the main segments of the Smart Polymers Industry?
The market segments include Type, End-user Industry.
4. Can you provide details about the market size?
The market size is estimated to be USD XX Million as of 2022.
5. What are some drivers contributing to market growth?
Increasing Application of Shape Memory Polymer in Textile Industry; Increasing Need for Efficient Drug Delivery System; Development of Smart Biopolymers.
6. What are the notable trends driving market growth?
Biomedical and Healthcare to Dominate the Market.
7. Are there any restraints impacting market growth?
High Cost of Technology and Development of Smart Polymers; Other Restraints.
8. Can you provide examples of recent developments in the market?
In August 2021, Evonik aquired the German biotech company JeNaCell. The acquisition adds biotechnologically produced cellulose to Evonik's portfolio of biomaterials.
9. What pricing options are available for accessing the report?
Pricing options include single-user, multi-user, and enterprise licenses priced at USD 4750, USD 5250, and USD 8750 respectively.
10. Is the market size provided in terms of value or volume?
The market size is provided in terms of value, measured in Million and volume, measured in K Tons.
11. Are there any specific market keywords associated with the report?
Yes, the market keyword associated with the report is "Smart Polymers Industry," which aids in identifying and referencing the specific market segment covered.
12. How do I determine which pricing option suits my needs best?
The pricing options vary based on user requirements and access needs. Individual users may opt for single-user licenses, while businesses requiring broader access may choose multi-user or enterprise licenses for cost-effective access to the report.
13. Are there any additional resources or data provided in the Smart Polymers Industry report?
While the report offers comprehensive insights, it's advisable to review the specific contents or supplementary materials provided to ascertain if additional resources or data are available.
14. How can I stay updated on further developments or reports in the Smart Polymers Industry?
To stay informed about further developments, trends, and reports in the Smart Polymers Industry, consider subscribing to industry newsletters, following relevant companies and organizations, or regularly checking reputable industry news sources and publications.
Methodology
Step 1 - Identification of Relevant Samples Size from Population Database


Step 2 - Approaches for Defining Global Market Size (Value, Volume* & Price*)

Note*: In applicable scenarios
Step 3 - Data Sources
Primary Research
- Web Analytics
- Survey Reports
- Research Institute
- Latest Research Reports
- Opinion Leaders
Secondary Research
- Annual Reports
- White Paper
- Latest Press Release
- Industry Association
- Paid Database
- Investor Presentations

Step 4 - Data Triangulation
Involves using different sources of information in order to increase the validity of a study
These sources are likely to be stakeholders in a program - participants, other researchers, program staff, other community members, and so on.
Then we put all data in single framework & apply various statistical tools to find out the dynamic on the market.
During the analysis stage, feedback from the stakeholder groups would be compared to determine areas of agreement as well as areas of divergence