

Key Insights
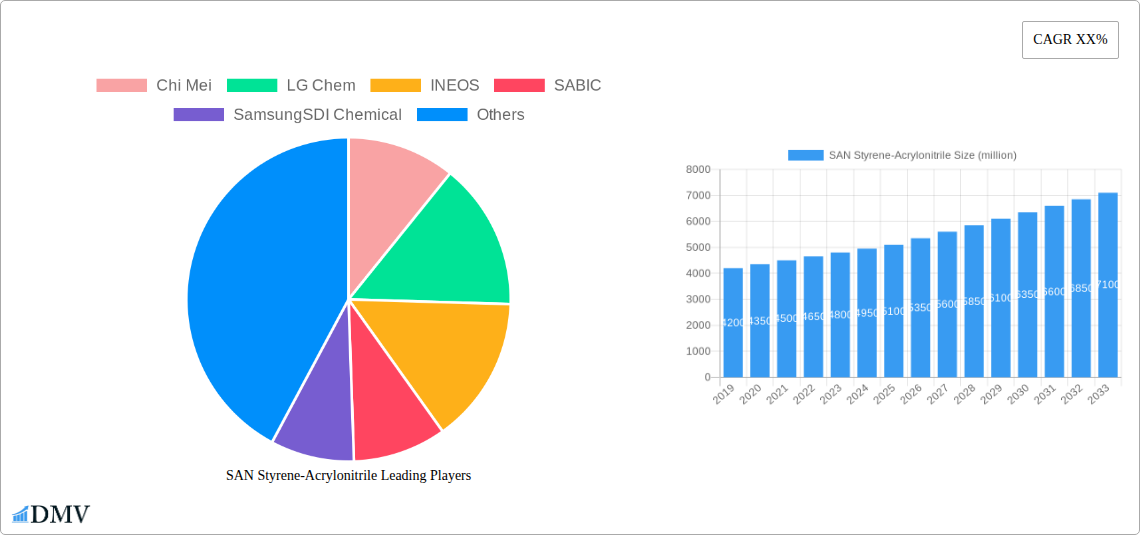
The global Styrene-Acrylonitrile (SAN) resin market is poised for robust expansion, projected to reach an estimated market size of USD 5,100 million by 2025, with a Compound Annual Growth Rate (CAGR) of approximately 5.2% anticipated through 2033. This growth is primarily fueled by the increasing demand from key end-use industries such as rubber, plastics, pharmaceuticals, and dyes. The inherent properties of SAN, including excellent chemical resistance, heat stability, transparency, and rigidity, make it a versatile material for a wide array of applications. The automotive sector, in particular, is a significant driver, leveraging SAN for interior and exterior components due to its durability and aesthetic appeal. Similarly, its use in consumer goods, from kitchenware to appliance housings, continues to rise, driven by consumer preferences for durable and visually appealing products. The pharmaceutical industry's need for transparent and chemically inert packaging further bolsters demand. The market is characterized by a dynamic competitive landscape with major players like Chi Mei, LG Chem, INEOS, and SABIC actively investing in capacity expansion and product innovation to cater to evolving market needs and maintain a competitive edge.
The SAN market's trajectory is influenced by a confluence of factors, including technological advancements in polymerization processes and the development of specialized SAN grades like chemical and pharmaceutical grades, which command premium pricing. Emerging economies, particularly in the Asia Pacific region, are emerging as significant growth hubs due to rapid industrialization, increasing disposable incomes, and a burgeoning manufacturing base. However, the market also faces certain restraints. Fluctuations in the prices of styrene and acrylonitrile, the primary raw materials, can impact production costs and profitability. Furthermore, the availability of substitute materials in certain applications, though less common for SAN's unique combination of properties, presents a potential challenge. Despite these headwinds, the sustained demand for high-performance plastics and the continuous innovation by key manufacturers are expected to ensure a positive growth outlook for the SAN Styrene-Acrylonitrile market in the coming years, with a focus on sustainable production practices and the development of eco-friendly SAN variants gaining traction.
SAN Styrene-Acrylonitrile Market Composition & Trends
The Styrene-Acrylonitrile (SAN) market demonstrates a moderate level of concentration, with key players like Chi Mei, LG Chem, INEOS, and SABIC holding significant market share, estimated collectively at over 60% in the base year of 2025. Innovation is driven by advancements in polymerization techniques, leading to enhanced material properties such as improved heat resistance and clarity, crucial for demanding applications. The regulatory landscape is evolving, with a growing emphasis on sustainability and recycled content, influencing product development and material sourcing. Substitute products, including ABS (Acrylonitrile Butadiene Styrene) and PMMA (Polymethyl Methacrylate), present a competitive challenge, though SAN offers a distinct balance of properties and cost-effectiveness for specific end-uses. End-user profiles span diverse industries, with the plastics sector being the most prominent, followed by rubber, and niche applications in pharmaceuticals and dyes. Mergers and acquisitions (M&A) activities, though not consistently high, have seen strategic consolidations to enhance market reach and technological capabilities. For instance, past M&A deals, though not detailed here, generally aim to secure raw material supply chains and expand product portfolios, contributing to an estimated M&A deal value in the tens of millions over the study period.
- Market Concentration: Dominated by a few major players, with Chi Mei and LG Chem leading.
- Innovation Catalysts: Enhanced polymerization, improved thermal and optical properties.
- Regulatory Landscape: Increasing focus on sustainability and recycled SAN.
- Substitute Products: ABS, PMMA offer alternatives, but SAN provides unique cost-performance benefits.
- End-User Profiles: Primarily plastics, followed by rubber, pharmaceuticals, and dyes.
- M&A Activities: Strategic consolidations for market expansion and technology acquisition.
SAN Styrene-Acrylonitrile Industry Evolution
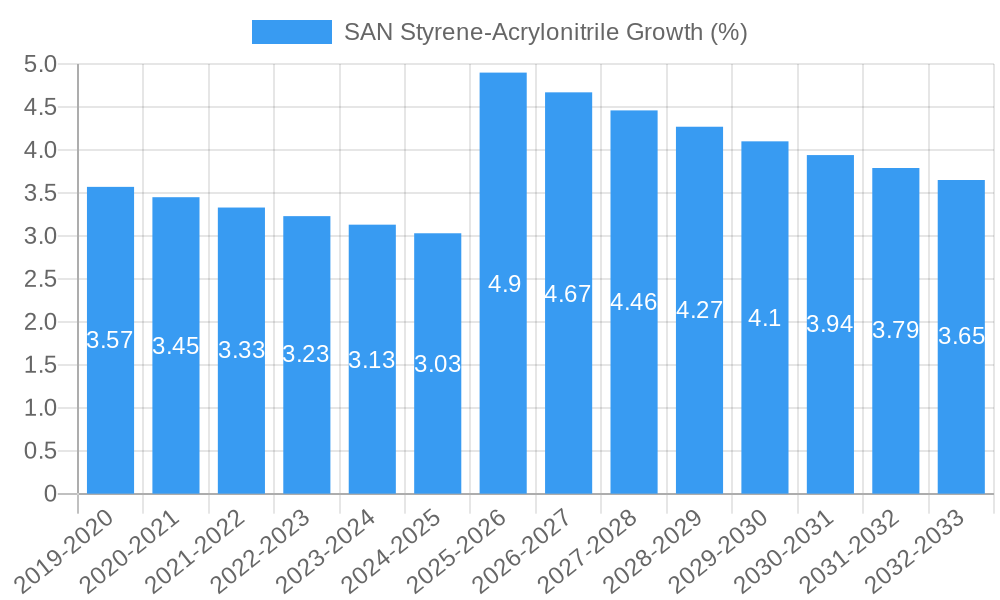
The Styrene-Acrylonitrile (SAN) industry has undergone significant evolution from 2019 to 2033, marked by consistent growth trajectories fueled by robust demand from its primary end-use sectors. During the historical period (2019-2024), the market experienced steady expansion, with an average annual growth rate of approximately 4.5%, driven by increased consumption in the automotive, consumer goods, and electronics industries. This growth was further bolstered by technological advancements in SAN production, enabling manufacturers to develop specialized grades with enhanced properties such as superior chemical resistance and improved processability. The base year of 2025 represents a pivotal point, with the market projected to reach a valuation of over $5,000 million.
The forecast period (2025-2033) is anticipated to witness a compounded annual growth rate (CAGR) of around 4.8%, indicating sustained market momentum. This upward trend is attributable to several factors, including the rising demand for lightweight yet durable materials in the automotive sector, where SAN is increasingly used in interior components and dashboards. Furthermore, the growing popularity of transparent and aesthetically pleasing consumer goods, such as kitchenware, food containers, and small appliances, continues to drive SAN consumption. The pharmaceutical industry is also emerging as a significant application area, with SAN grades being utilized for packaging and diagnostic devices due to their excellent clarity and chemical inertness.
Technological advancements are at the forefront of this evolution. Innovations in polymerization catalysts and process optimization have led to the development of high-performance SAN grades with improved thermal stability and impact strength, expanding its applicability into more demanding environments. For example, the adoption of advanced emulsion polymerization techniques has allowed for greater control over polymer microstructure, resulting in materials with superior optical clarity and reduced yellowing over time, crucial for applications requiring long-term visual appeal. Adoption metrics for these advanced grades are steadily increasing, with specialized SAN types now accounting for an estimated 20% of the total market volume by 2025.
Shifting consumer demands, particularly the growing preference for sustainable and recyclable materials, are also shaping the SAN industry. Manufacturers are investing in research and development to enhance the recyclability of SAN and to incorporate recycled content into their product offerings. This trend is expected to gain further traction throughout the forecast period, potentially leading to a significant shift in production methods and material sourcing. The integration of bio-based monomers is also an area of emerging interest, although its commercial viability and widespread adoption are still in the early stages. Overall, the SAN industry is characterized by a dynamic interplay of market demand, technological innovation, and evolving sustainability imperatives, setting the stage for continued robust growth and diversification.
Leading Regions, Countries, or Segments in SAN Styrene-Acrylonitrile
The Styrene-Acrylonitrile (SAN) market is characterized by a distinct regional dominance and a clear preference for specific application segments, with the Plastic application emerging as the undisputed leader. This dominance is driven by a confluence of factors including robust industrialization, a thriving consumer goods sector, and significant investments in manufacturing infrastructure across key regions. The forecast period (2025-2033) will see the Plastic segment alone contributing an estimated 75% to the global SAN market value, projected to reach over $3,750 million by 2025.
Within the application types, Chemical Grade SAN holds the largest market share, estimated at over 80% of the total market volume in 2025. This is directly correlated with its widespread use in the production of various plastic articles. Chemical grade SAN offers a balance of properties including good transparency, rigidity, chemical resistance, and heat resistance, making it ideal for injection molding and extrusion processes used in manufacturing consumer goods, appliances, automotive parts, and packaging. The demand for chemical grade SAN is consistently high due to the sheer volume of plastic products manufactured globally.
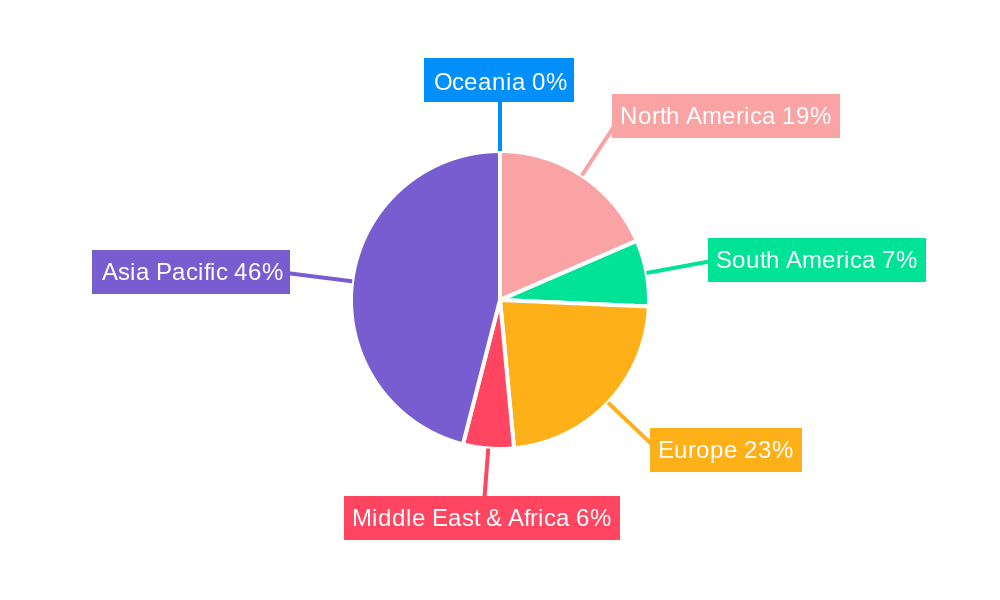
Leading Region: Asia Pacific stands as the dominant region in the SAN Styrene-Acrylonitrile market. This leadership is underpinned by several key drivers:
- Investment Trends: Substantial foreign and domestic investments in manufacturing facilities, particularly in countries like China, South Korea, and India, have created a massive demand base for SAN. These investments are estimated to be in the billions across the study period.
- Regulatory Support: Favorable government policies promoting industrial growth and manufacturing exports in many Asia Pacific nations provide a conducive environment for SAN producers and consumers.
- Growing Consumer Base: The region's burgeoning middle class and increasing disposable incomes translate into higher demand for consumer goods, appliances, and automotive products, all of which utilize SAN.
- Established Supply Chains: The presence of major petrochemical producers and integrated manufacturing clusters further strengthens the region's position by ensuring a stable supply of raw materials and efficient production processes.
Dominant Segment: Plastic Application The Plastic application segment's dominance is propelled by:
- Extensive Use in Consumer Goods: SAN is a preferred material for transparent housewares, food containers, cosmetic packaging, and appliance components due to its clarity, rigidity, and food-grade compliance. The global market for these products is valued in the hundreds of millions.
- Automotive Industry Demand: In automotive applications, SAN is used for interior trim parts, instrument panels, and lighting components, benefiting from its impact resistance and aesthetic appeal. The automotive sector's shift towards lightweight materials further bolsters this demand.
- Electronics and Electrical Applications: SAN finds its way into electronic housings, connectors, and various components where its dielectric properties and dimensional stability are advantageous.
While Pharmaceutical applications represent a smaller but growing segment, its high-value nature makes it significant. Pharmaceutical grade SAN is utilized for its excellent clarity, biocompatibility, and resistance to sterilization processes, crucial for drug delivery systems, medical devices, and diagnostic equipment. The market for pharmaceutical grade SAN, though smaller in volume, is projected to grow at a CAGR of approximately 5.5% during the forecast period.
Types Dominance: The Chemical Grade dominates due to its broad applicability across various plastic manufacturing processes. Its cost-effectiveness and versatile performance characteristics make it the go-to choice for a vast array of everyday products. The Pharmaceutical Grade, while a niche, commands a premium price due to stringent quality and regulatory requirements.
SAN Styrene-Acrylonitrile Product Innovations
Recent product innovations in the Styrene-Acrylonitrile (SAN) market are focused on enhancing performance and expanding application versatility. Manufacturers are developing SAN grades with improved heat distortion temperatures (HDT), enabling their use in higher-temperature environments. Furthermore, advancements in polymerization processes are yielding SAN with superior impact resistance without compromising clarity, a critical factor for durable consumer goods and automotive components. New formulations are also emerging with enhanced UV stability, extending the lifespan of products exposed to sunlight, while others offer improved chemical resistance for specialized industrial applications. These innovations, often characterized by proprietary catalyst systems and precise molecular weight control, allow for unique selling propositions and technological advancements that cater to evolving industry needs, pushing the boundaries of what SAN can achieve.
Propelling Factors for SAN Styrene-Acrylonitrile Growth
The growth of the Styrene-Acrylonitrile (SAN) market is propelled by several key factors. Technological advancements in polymerization are leading to SAN grades with superior properties like enhanced heat resistance and impact strength, broadening their applicability. The robust demand from the plastics industry, particularly for consumer goods, appliances, and automotive components, serves as a primary driver. Economic growth in emerging markets is fueling increased consumer spending on these products. Furthermore, favorable regulatory environments in certain regions that support manufacturing and material innovation contribute to market expansion. The inherent advantages of SAN, such as its excellent clarity, rigidity, and cost-effectiveness compared to some other engineering plastics, make it an attractive choice for manufacturers worldwide, contributing to an estimated market expansion of over $1,000 million in the forecast period.
Obstacles in the SAN Styrene-Acrylonitrile Market
Despite its growth, the SAN Styrene-Acrylonitrile market faces several obstacles. Fluctuations in the price of raw materials, particularly styrene and acrylonitrile, can significantly impact production costs and profit margins. Increasing competition from substitute materials like ABS and PMMA, which offer similar or overlapping performance characteristics, poses a constant challenge, potentially diverting market share. Stringent environmental regulations regarding chemical production and waste management can increase operational costs and require substantial investments in compliance. Supply chain disruptions, as witnessed in recent global events, can lead to material shortages and production delays, impacting market stability. The perceived complexity of recycling certain SAN formulations can also hinder its adoption in a circular economy, representing a significant barrier estimated to impact market growth by up to 5% annually if not addressed.
Future Opportunities in SAN Styrene-Acrylonitrile
The future of the Styrene-Acrylonitrile (SAN) market is ripe with opportunities. Growing demand for sustainable materials presents a chance for producers to develop and market bio-based or significantly recycled SAN. Expansion into new application areas, such as advanced medical devices and 3D printing filaments, offers significant growth potential. The increasing adoption of SAN in emerging economies, driven by industrialization and rising consumerism, will continue to be a key opportunity, with an estimated market influx of several hundred million dollars. Furthermore, technological advancements leading to enhanced performance characteristics – such as improved flame retardancy or antimicrobial properties – can open up entirely new market segments and applications, further diversifying the SAN portfolio. The development of specialized SAN grades for high-performance applications is projected to be a significant driver of future revenue.
Major Players in the SAN Styrene-Acrylonitrile Ecosystem
- Chi Mei
- LG Chem
- INEOS
- SABIC
- SamsungSDI Chemical
- Toray
- Trinseo
- FCFC
- JSR Corporation
- Kumho Petrochemical
- IRPC
- Taita Chemical
- Grand Pacific Petrochemical
- Asahi Kasei Chemicals
- SGPC
- CNPC
Key Developments in SAN Styrene-Acrylonitrile Industry
- 2023: Launch of new SAN grades with improved heat resistance and clarity by a leading manufacturer to cater to the appliance industry.
- 2022: Significant investment in R&D for bio-based SAN alternatives by a major chemical company, aiming for commercialization by 2027.
- 2021: Several key players announced partnerships to improve the recyclability of SAN products and establish closed-loop systems.
- 2020: Introduction of SAN grades with enhanced impact strength for automotive interior applications, meeting stricter safety standards.
- 2019: Strategic acquisition of a smaller SAN producer by a global chemical giant to expand market reach in Asia.
Strategic SAN Styrene-Acrylonitrile Market Forecast
The strategic SAN Styrene-Acrylonitrile market forecast indicates sustained growth driven by innovation and evolving consumer demands. The increasing emphasis on sustainable materials will unlock opportunities for bio-based and recycled SAN, further solidifying its market position. Continued advancements in polymerization technology will yield high-performance SAN grades, expanding its utility in demanding applications across automotive, electronics, and healthcare sectors. The growing middle class in emerging economies will fuel demand for consumer goods and appliances, directly benefiting the SAN market. Strategic partnerships and investments aimed at enhancing production efficiency and exploring new application frontiers will be crucial for market players to capitalize on the projected growth, which is expected to add over $2,000 million to the market value by 2033.
SAN Styrene-Acrylonitrile Segmentation
-
1. Application
- 1.1. Rubber
- 1.2. Plastic
- 1.3. Pharmaceuticals
- 1.4. Dye
- 1.5. Pesticide
- 1.6. Other
-
2. Types
- 2.1. Chemical Grade
- 2.2. Pharmaceutical Grade
SAN Styrene-Acrylonitrile Segmentation By Geography
-
1. North America
- 1.1. United States
- 1.2. Canada
- 1.3. Mexico
-
2. South America
- 2.1. Brazil
- 2.2. Argentina
- 2.3. Rest of South America
-
3. Europe
- 3.1. United Kingdom
- 3.2. Germany
- 3.3. France
- 3.4. Italy
- 3.5. Spain
- 3.6. Russia
- 3.7. Benelux
- 3.8. Nordics
- 3.9. Rest of Europe
-
4. Middle East & Africa
- 4.1. Turkey
- 4.2. Israel
- 4.3. GCC
- 4.4. North Africa
- 4.5. South Africa
- 4.6. Rest of Middle East & Africa
-
5. Asia Pacific
- 5.1. China
- 5.2. India
- 5.3. Japan
- 5.4. South Korea
- 5.5. ASEAN
- 5.6. Oceania
- 5.7. Rest of Asia Pacific
SAN Styrene-Acrylonitrile REPORT HIGHLIGHTS
| Aspects | Details |
|---|---|
| Study Period | 2019-2033 |
| Base Year | 2024 |
| Estimated Year | 2025 |
| Forecast Period | 2025-2033 |
| Historical Period | 2019-2024 |
| Growth Rate | CAGR of XX% from 2019-2033 |
| Segmentation |
|
Table of Contents
- 1. Introduction
- 1.1. Research Scope
- 1.2. Market Segmentation
- 1.3. Research Methodology
- 1.4. Definitions and Assumptions
- 2. Executive Summary
- 2.1. Introduction
- 3. Market Dynamics
- 3.1. Introduction
- 3.2. Market Drivers
- 3.3. Market Restrains
- 3.4. Market Trends
- 4. Market Factor Analysis
- 4.1. Porters Five Forces
- 4.2. Supply/Value Chain
- 4.3. PESTEL analysis
- 4.4. Market Entropy
- 4.5. Patent/Trademark Analysis
- 5. Global SAN Styrene-Acrylonitrile Analysis, Insights and Forecast, 2019-2031
- 5.1. Market Analysis, Insights and Forecast - by Application
- 5.1.1. Rubber
- 5.1.2. Plastic
- 5.1.3. Pharmaceuticals
- 5.1.4. Dye
- 5.1.5. Pesticide
- 5.1.6. Other
- 5.2. Market Analysis, Insights and Forecast - by Types
- 5.2.1. Chemical Grade
- 5.2.2. Pharmaceutical Grade
- 5.3. Market Analysis, Insights and Forecast - by Region
- 5.3.1. North America
- 5.3.2. South America
- 5.3.3. Europe
- 5.3.4. Middle East & Africa
- 5.3.5. Asia Pacific
- 5.1. Market Analysis, Insights and Forecast - by Application
- 6. North America SAN Styrene-Acrylonitrile Analysis, Insights and Forecast, 2019-2031
- 6.1. Market Analysis, Insights and Forecast - by Application
- 6.1.1. Rubber
- 6.1.2. Plastic
- 6.1.3. Pharmaceuticals
- 6.1.4. Dye
- 6.1.5. Pesticide
- 6.1.6. Other
- 6.2. Market Analysis, Insights and Forecast - by Types
- 6.2.1. Chemical Grade
- 6.2.2. Pharmaceutical Grade
- 6.1. Market Analysis, Insights and Forecast - by Application
- 7. South America SAN Styrene-Acrylonitrile Analysis, Insights and Forecast, 2019-2031
- 7.1. Market Analysis, Insights and Forecast - by Application
- 7.1.1. Rubber
- 7.1.2. Plastic
- 7.1.3. Pharmaceuticals
- 7.1.4. Dye
- 7.1.5. Pesticide
- 7.1.6. Other
- 7.2. Market Analysis, Insights and Forecast - by Types
- 7.2.1. Chemical Grade
- 7.2.2. Pharmaceutical Grade
- 7.1. Market Analysis, Insights and Forecast - by Application
- 8. Europe SAN Styrene-Acrylonitrile Analysis, Insights and Forecast, 2019-2031
- 8.1. Market Analysis, Insights and Forecast - by Application
- 8.1.1. Rubber
- 8.1.2. Plastic
- 8.1.3. Pharmaceuticals
- 8.1.4. Dye
- 8.1.5. Pesticide
- 8.1.6. Other
- 8.2. Market Analysis, Insights and Forecast - by Types
- 8.2.1. Chemical Grade
- 8.2.2. Pharmaceutical Grade
- 8.1. Market Analysis, Insights and Forecast - by Application
- 9. Middle East & Africa SAN Styrene-Acrylonitrile Analysis, Insights and Forecast, 2019-2031
- 9.1. Market Analysis, Insights and Forecast - by Application
- 9.1.1. Rubber
- 9.1.2. Plastic
- 9.1.3. Pharmaceuticals
- 9.1.4. Dye
- 9.1.5. Pesticide
- 9.1.6. Other
- 9.2. Market Analysis, Insights and Forecast - by Types
- 9.2.1. Chemical Grade
- 9.2.2. Pharmaceutical Grade
- 9.1. Market Analysis, Insights and Forecast - by Application
- 10. Asia Pacific SAN Styrene-Acrylonitrile Analysis, Insights and Forecast, 2019-2031
- 10.1. Market Analysis, Insights and Forecast - by Application
- 10.1.1. Rubber
- 10.1.2. Plastic
- 10.1.3. Pharmaceuticals
- 10.1.4. Dye
- 10.1.5. Pesticide
- 10.1.6. Other
- 10.2. Market Analysis, Insights and Forecast - by Types
- 10.2.1. Chemical Grade
- 10.2.2. Pharmaceutical Grade
- 10.1. Market Analysis, Insights and Forecast - by Application
- 11. Competitive Analysis
- 11.1. Global Market Share Analysis 2024
- 11.2. Company Profiles
- 11.2.1 Chi Mei
- 11.2.1.1. Overview
- 11.2.1.2. Products
- 11.2.1.3. SWOT Analysis
- 11.2.1.4. Recent Developments
- 11.2.1.5. Financials (Based on Availability)
- 11.2.2 LG Chem
- 11.2.2.1. Overview
- 11.2.2.2. Products
- 11.2.2.3. SWOT Analysis
- 11.2.2.4. Recent Developments
- 11.2.2.5. Financials (Based on Availability)
- 11.2.3 INEOS
- 11.2.3.1. Overview
- 11.2.3.2. Products
- 11.2.3.3. SWOT Analysis
- 11.2.3.4. Recent Developments
- 11.2.3.5. Financials (Based on Availability)
- 11.2.4 SABIC
- 11.2.4.1. Overview
- 11.2.4.2. Products
- 11.2.4.3. SWOT Analysis
- 11.2.4.4. Recent Developments
- 11.2.4.5. Financials (Based on Availability)
- 11.2.5 SamsungSDI Chemical
- 11.2.5.1. Overview
- 11.2.5.2. Products
- 11.2.5.3. SWOT Analysis
- 11.2.5.4. Recent Developments
- 11.2.5.5. Financials (Based on Availability)
- 11.2.6 Toray
- 11.2.6.1. Overview
- 11.2.6.2. Products
- 11.2.6.3. SWOT Analysis
- 11.2.6.4. Recent Developments
- 11.2.6.5. Financials (Based on Availability)
- 11.2.7 Trinseo
- 11.2.7.1. Overview
- 11.2.7.2. Products
- 11.2.7.3. SWOT Analysis
- 11.2.7.4. Recent Developments
- 11.2.7.5. Financials (Based on Availability)
- 11.2.8 FCFC
- 11.2.8.1. Overview
- 11.2.8.2. Products
- 11.2.8.3. SWOT Analysis
- 11.2.8.4. Recent Developments
- 11.2.8.5. Financials (Based on Availability)
- 11.2.9 JSR Corporation
- 11.2.9.1. Overview
- 11.2.9.2. Products
- 11.2.9.3. SWOT Analysis
- 11.2.9.4. Recent Developments
- 11.2.9.5. Financials (Based on Availability)
- 11.2.10 Kumho Petrochemical
- 11.2.10.1. Overview
- 11.2.10.2. Products
- 11.2.10.3. SWOT Analysis
- 11.2.10.4. Recent Developments
- 11.2.10.5. Financials (Based on Availability)
- 11.2.11 IRPC
- 11.2.11.1. Overview
- 11.2.11.2. Products
- 11.2.11.3. SWOT Analysis
- 11.2.11.4. Recent Developments
- 11.2.11.5. Financials (Based on Availability)
- 11.2.12 Taita Chemical
- 11.2.12.1. Overview
- 11.2.12.2. Products
- 11.2.12.3. SWOT Analysis
- 11.2.12.4. Recent Developments
- 11.2.12.5. Financials (Based on Availability)
- 11.2.13 Grand Pacific Petrochemical
- 11.2.13.1. Overview
- 11.2.13.2. Products
- 11.2.13.3. SWOT Analysis
- 11.2.13.4. Recent Developments
- 11.2.13.5. Financials (Based on Availability)
- 11.2.14 Asahi Kasei Chemicals
- 11.2.14.1. Overview
- 11.2.14.2. Products
- 11.2.14.3. SWOT Analysis
- 11.2.14.4. Recent Developments
- 11.2.14.5. Financials (Based on Availability)
- 11.2.15 SGPC
- 11.2.15.1. Overview
- 11.2.15.2. Products
- 11.2.15.3. SWOT Analysis
- 11.2.15.4. Recent Developments
- 11.2.15.5. Financials (Based on Availability)
- 11.2.16 CNPC
- 11.2.16.1. Overview
- 11.2.16.2. Products
- 11.2.16.3. SWOT Analysis
- 11.2.16.4. Recent Developments
- 11.2.16.5. Financials (Based on Availability)
- 11.2.1 Chi Mei
List of Figures
- Figure 1: Global SAN Styrene-Acrylonitrile Revenue Breakdown (million, %) by Region 2024 & 2032
- Figure 2: North America SAN Styrene-Acrylonitrile Revenue (million), by Application 2024 & 2032
- Figure 3: North America SAN Styrene-Acrylonitrile Revenue Share (%), by Application 2024 & 2032
- Figure 4: North America SAN Styrene-Acrylonitrile Revenue (million), by Types 2024 & 2032
- Figure 5: North America SAN Styrene-Acrylonitrile Revenue Share (%), by Types 2024 & 2032
- Figure 6: North America SAN Styrene-Acrylonitrile Revenue (million), by Country 2024 & 2032
- Figure 7: North America SAN Styrene-Acrylonitrile Revenue Share (%), by Country 2024 & 2032
- Figure 8: South America SAN Styrene-Acrylonitrile Revenue (million), by Application 2024 & 2032
- Figure 9: South America SAN Styrene-Acrylonitrile Revenue Share (%), by Application 2024 & 2032
- Figure 10: South America SAN Styrene-Acrylonitrile Revenue (million), by Types 2024 & 2032
- Figure 11: South America SAN Styrene-Acrylonitrile Revenue Share (%), by Types 2024 & 2032
- Figure 12: South America SAN Styrene-Acrylonitrile Revenue (million), by Country 2024 & 2032
- Figure 13: South America SAN Styrene-Acrylonitrile Revenue Share (%), by Country 2024 & 2032
- Figure 14: Europe SAN Styrene-Acrylonitrile Revenue (million), by Application 2024 & 2032
- Figure 15: Europe SAN Styrene-Acrylonitrile Revenue Share (%), by Application 2024 & 2032
- Figure 16: Europe SAN Styrene-Acrylonitrile Revenue (million), by Types 2024 & 2032
- Figure 17: Europe SAN Styrene-Acrylonitrile Revenue Share (%), by Types 2024 & 2032
- Figure 18: Europe SAN Styrene-Acrylonitrile Revenue (million), by Country 2024 & 2032
- Figure 19: Europe SAN Styrene-Acrylonitrile Revenue Share (%), by Country 2024 & 2032
- Figure 20: Middle East & Africa SAN Styrene-Acrylonitrile Revenue (million), by Application 2024 & 2032
- Figure 21: Middle East & Africa SAN Styrene-Acrylonitrile Revenue Share (%), by Application 2024 & 2032
- Figure 22: Middle East & Africa SAN Styrene-Acrylonitrile Revenue (million), by Types 2024 & 2032
- Figure 23: Middle East & Africa SAN Styrene-Acrylonitrile Revenue Share (%), by Types 2024 & 2032
- Figure 24: Middle East & Africa SAN Styrene-Acrylonitrile Revenue (million), by Country 2024 & 2032
- Figure 25: Middle East & Africa SAN Styrene-Acrylonitrile Revenue Share (%), by Country 2024 & 2032
- Figure 26: Asia Pacific SAN Styrene-Acrylonitrile Revenue (million), by Application 2024 & 2032
- Figure 27: Asia Pacific SAN Styrene-Acrylonitrile Revenue Share (%), by Application 2024 & 2032
- Figure 28: Asia Pacific SAN Styrene-Acrylonitrile Revenue (million), by Types 2024 & 2032
- Figure 29: Asia Pacific SAN Styrene-Acrylonitrile Revenue Share (%), by Types 2024 & 2032
- Figure 30: Asia Pacific SAN Styrene-Acrylonitrile Revenue (million), by Country 2024 & 2032
- Figure 31: Asia Pacific SAN Styrene-Acrylonitrile Revenue Share (%), by Country 2024 & 2032
List of Tables
- Table 1: Global SAN Styrene-Acrylonitrile Revenue million Forecast, by Region 2019 & 2032
- Table 2: Global SAN Styrene-Acrylonitrile Revenue million Forecast, by Application 2019 & 2032
- Table 3: Global SAN Styrene-Acrylonitrile Revenue million Forecast, by Types 2019 & 2032
- Table 4: Global SAN Styrene-Acrylonitrile Revenue million Forecast, by Region 2019 & 2032
- Table 5: Global SAN Styrene-Acrylonitrile Revenue million Forecast, by Application 2019 & 2032
- Table 6: Global SAN Styrene-Acrylonitrile Revenue million Forecast, by Types 2019 & 2032
- Table 7: Global SAN Styrene-Acrylonitrile Revenue million Forecast, by Country 2019 & 2032
- Table 8: United States SAN Styrene-Acrylonitrile Revenue (million) Forecast, by Application 2019 & 2032
- Table 9: Canada SAN Styrene-Acrylonitrile Revenue (million) Forecast, by Application 2019 & 2032
- Table 10: Mexico SAN Styrene-Acrylonitrile Revenue (million) Forecast, by Application 2019 & 2032
- Table 11: Global SAN Styrene-Acrylonitrile Revenue million Forecast, by Application 2019 & 2032
- Table 12: Global SAN Styrene-Acrylonitrile Revenue million Forecast, by Types 2019 & 2032
- Table 13: Global SAN Styrene-Acrylonitrile Revenue million Forecast, by Country 2019 & 2032
- Table 14: Brazil SAN Styrene-Acrylonitrile Revenue (million) Forecast, by Application 2019 & 2032
- Table 15: Argentina SAN Styrene-Acrylonitrile Revenue (million) Forecast, by Application 2019 & 2032
- Table 16: Rest of South America SAN Styrene-Acrylonitrile Revenue (million) Forecast, by Application 2019 & 2032
- Table 17: Global SAN Styrene-Acrylonitrile Revenue million Forecast, by Application 2019 & 2032
- Table 18: Global SAN Styrene-Acrylonitrile Revenue million Forecast, by Types 2019 & 2032
- Table 19: Global SAN Styrene-Acrylonitrile Revenue million Forecast, by Country 2019 & 2032
- Table 20: United Kingdom SAN Styrene-Acrylonitrile Revenue (million) Forecast, by Application 2019 & 2032
- Table 21: Germany SAN Styrene-Acrylonitrile Revenue (million) Forecast, by Application 2019 & 2032
- Table 22: France SAN Styrene-Acrylonitrile Revenue (million) Forecast, by Application 2019 & 2032
- Table 23: Italy SAN Styrene-Acrylonitrile Revenue (million) Forecast, by Application 2019 & 2032
- Table 24: Spain SAN Styrene-Acrylonitrile Revenue (million) Forecast, by Application 2019 & 2032
- Table 25: Russia SAN Styrene-Acrylonitrile Revenue (million) Forecast, by Application 2019 & 2032
- Table 26: Benelux SAN Styrene-Acrylonitrile Revenue (million) Forecast, by Application 2019 & 2032
- Table 27: Nordics SAN Styrene-Acrylonitrile Revenue (million) Forecast, by Application 2019 & 2032
- Table 28: Rest of Europe SAN Styrene-Acrylonitrile Revenue (million) Forecast, by Application 2019 & 2032
- Table 29: Global SAN Styrene-Acrylonitrile Revenue million Forecast, by Application 2019 & 2032
- Table 30: Global SAN Styrene-Acrylonitrile Revenue million Forecast, by Types 2019 & 2032
- Table 31: Global SAN Styrene-Acrylonitrile Revenue million Forecast, by Country 2019 & 2032
- Table 32: Turkey SAN Styrene-Acrylonitrile Revenue (million) Forecast, by Application 2019 & 2032
- Table 33: Israel SAN Styrene-Acrylonitrile Revenue (million) Forecast, by Application 2019 & 2032
- Table 34: GCC SAN Styrene-Acrylonitrile Revenue (million) Forecast, by Application 2019 & 2032
- Table 35: North Africa SAN Styrene-Acrylonitrile Revenue (million) Forecast, by Application 2019 & 2032
- Table 36: South Africa SAN Styrene-Acrylonitrile Revenue (million) Forecast, by Application 2019 & 2032
- Table 37: Rest of Middle East & Africa SAN Styrene-Acrylonitrile Revenue (million) Forecast, by Application 2019 & 2032
- Table 38: Global SAN Styrene-Acrylonitrile Revenue million Forecast, by Application 2019 & 2032
- Table 39: Global SAN Styrene-Acrylonitrile Revenue million Forecast, by Types 2019 & 2032
- Table 40: Global SAN Styrene-Acrylonitrile Revenue million Forecast, by Country 2019 & 2032
- Table 41: China SAN Styrene-Acrylonitrile Revenue (million) Forecast, by Application 2019 & 2032
- Table 42: India SAN Styrene-Acrylonitrile Revenue (million) Forecast, by Application 2019 & 2032
- Table 43: Japan SAN Styrene-Acrylonitrile Revenue (million) Forecast, by Application 2019 & 2032
- Table 44: South Korea SAN Styrene-Acrylonitrile Revenue (million) Forecast, by Application 2019 & 2032
- Table 45: ASEAN SAN Styrene-Acrylonitrile Revenue (million) Forecast, by Application 2019 & 2032
- Table 46: Oceania SAN Styrene-Acrylonitrile Revenue (million) Forecast, by Application 2019 & 2032
- Table 47: Rest of Asia Pacific SAN Styrene-Acrylonitrile Revenue (million) Forecast, by Application 2019 & 2032
Frequently Asked Questions
1. What is the projected Compound Annual Growth Rate (CAGR) of the SAN Styrene-Acrylonitrile?
The projected CAGR is approximately XX%.
2. Which companies are prominent players in the SAN Styrene-Acrylonitrile?
Key companies in the market include Chi Mei, LG Chem, INEOS, SABIC, SamsungSDI Chemical, Toray, Trinseo, FCFC, JSR Corporation, Kumho Petrochemical, IRPC, Taita Chemical, Grand Pacific Petrochemical, Asahi Kasei Chemicals, SGPC, CNPC.
3. What are the main segments of the SAN Styrene-Acrylonitrile?
The market segments include Application, Types.
4. Can you provide details about the market size?
The market size is estimated to be USD XXX million as of 2022.
5. What are some drivers contributing to market growth?
N/A
6. What are the notable trends driving market growth?
N/A
7. Are there any restraints impacting market growth?
N/A
8. Can you provide examples of recent developments in the market?
N/A
9. What pricing options are available for accessing the report?
Pricing options include single-user, multi-user, and enterprise licenses priced at USD 4900.00, USD 7350.00, and USD 9800.00 respectively.
10. Is the market size provided in terms of value or volume?
The market size is provided in terms of value, measured in million.
11. Are there any specific market keywords associated with the report?
Yes, the market keyword associated with the report is "SAN Styrene-Acrylonitrile," which aids in identifying and referencing the specific market segment covered.
12. How do I determine which pricing option suits my needs best?
The pricing options vary based on user requirements and access needs. Individual users may opt for single-user licenses, while businesses requiring broader access may choose multi-user or enterprise licenses for cost-effective access to the report.
13. Are there any additional resources or data provided in the SAN Styrene-Acrylonitrile report?
While the report offers comprehensive insights, it's advisable to review the specific contents or supplementary materials provided to ascertain if additional resources or data are available.
14. How can I stay updated on further developments or reports in the SAN Styrene-Acrylonitrile?
To stay informed about further developments, trends, and reports in the SAN Styrene-Acrylonitrile, consider subscribing to industry newsletters, following relevant companies and organizations, or regularly checking reputable industry news sources and publications.
Methodology
Step 1 - Identification of Relevant Samples Size from Population Database


Step 2 - Approaches for Defining Global Market Size (Value, Volume* & Price*)

Note*: In applicable scenarios
Step 3 - Data Sources
Primary Research
- Web Analytics
- Survey Reports
- Research Institute
- Latest Research Reports
- Opinion Leaders
Secondary Research
- Annual Reports
- White Paper
- Latest Press Release
- Industry Association
- Paid Database
- Investor Presentations

Step 4 - Data Triangulation
Involves using different sources of information in order to increase the validity of a study
These sources are likely to be stakeholders in a program - participants, other researchers, program staff, other community members, and so on.
Then we put all data in single framework & apply various statistical tools to find out the dynamic on the market.
During the analysis stage, feedback from the stakeholder groups would be compared to determine areas of agreement as well as areas of divergence
