

Key Insights
The global Specialty Surfactant market is projected for substantial growth, anticipated to reach 47.4 billion by 2025. This expansion is driven by a compelling Compound Annual Growth Rate (CAGR) of 5.3%. Key growth drivers include robust demand from diverse end-use sectors such as household detergents, personal care, industrial cleaning, oilfield chemicals, and agricultural formulations. Specialty surfactants offer critical performance enhancements like improved emulsification, dispersion, and foaming, making them vital for modern product innovation. The increasing consumer preference for sustainable and eco-friendly products also fuels the adoption of bio-based surfactants, presenting significant market opportunities.
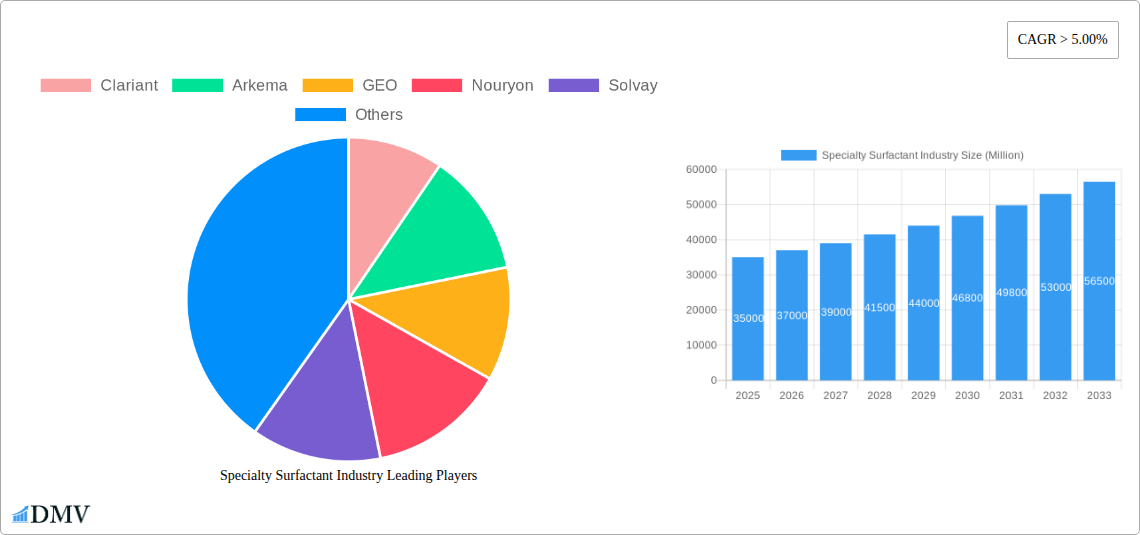
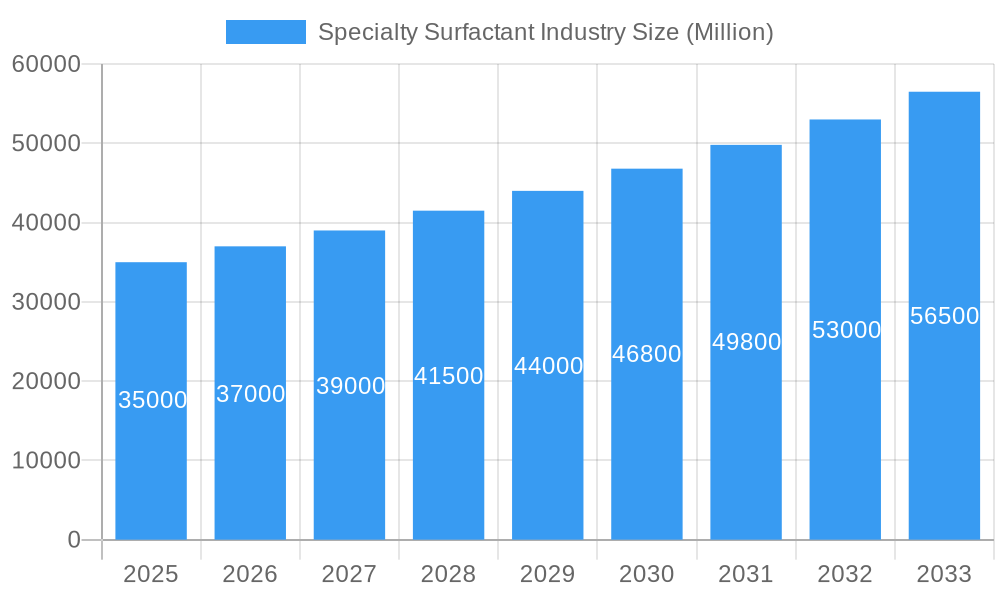
Specialty Surfactant Industry Market Size (In Billion)
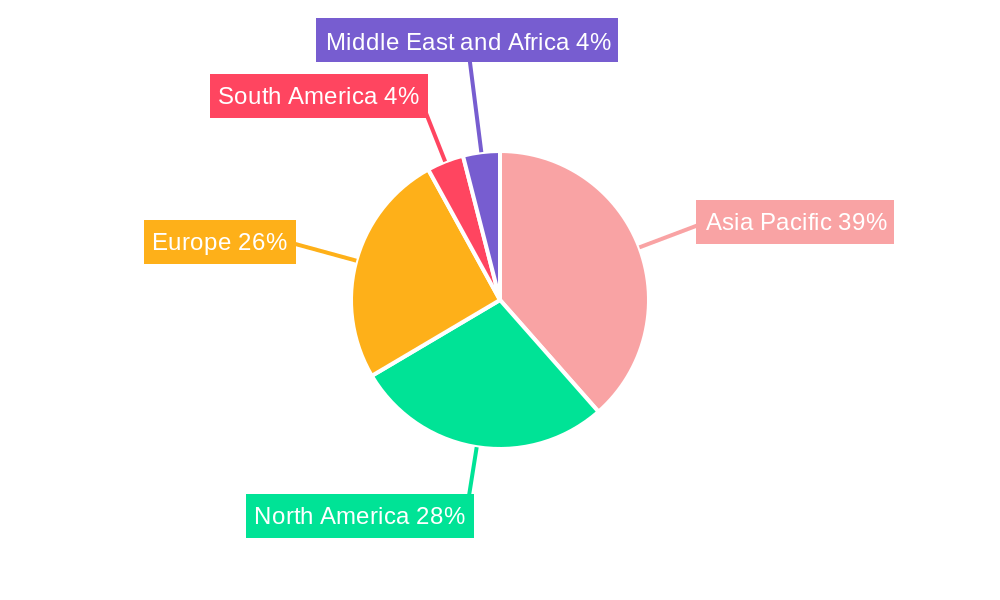
Market dynamics are further influenced by trends in high-performance, low-foaming surfactants for advanced cleaning, and the growing use of silicone surfactants in personal care for enhanced product feel and efficacy. Challenges include raw material price volatility and evolving environmental regulations, prompting a shift towards sustainable alternatives. Geographically, the Asia Pacific region, particularly China and India, is expected to lead market growth due to its expanding industrial base and consumer markets. North America and Europe remain key markets focused on innovation and premium offerings. Leading companies like BASF SE, Dow, and Clariant are actively investing in research and development to meet emerging market demands and sustain competitive advantage.
Specialty Surfactant Industry Company Market Share
Specialty Surfactant Industry Market Composition & Trends
The specialty surfactant market is characterized by a dynamic composition, driven by continuous innovation and evolving regulatory landscapes. Market concentration is moderately fragmented, with a few key players holding significant market share, while numerous smaller entities contribute to niche segments. Innovation catalysts include the growing demand for sustainable and bio-based alternatives, advancements in delivery systems, and the development of high-performance surfactants for specialized applications. Regulatory frameworks, particularly concerning environmental impact and safety, are shaping product development and market entry strategies. Substitute products, such as conventional detergents and soaps, pose a challenge, but the unique performance benefits of specialty surfactants in demanding applications continue to drive adoption. End-user profiles are diverse, spanning industries from personal care and household cleaning to industrial applications like oilfield chemicals and agricultural formulations. Mergers and acquisitions (M&A) activity is a significant trend, indicating consolidation and strategic expansion. For example, the estimated M&A deal value for the historical period 2019-2024 is in the billions of USD.
- Market Share Distribution: Major players like BASF SE, Dow, and Evonik Industries AG collectively hold an estimated XX% of the global market.
- M&A Deal Values: The historical period saw significant investments, with key acquisitions valued at over $XXX Million.
Specialty Surfactant Industry Industry Evolution
The specialty surfactant industry has undergone a significant evolutionary trajectory, driven by a confluence of technological advancements, shifting consumer demands, and an increasing global focus on sustainability. Over the study period of 2019–2033, the market has witnessed a consistent upward trend in growth, with the base year 2025 projecting a robust market size of over $XX Billion. This growth is underpinned by continuous innovation in surfactant chemistry, leading to the development of more efficient, environmentally friendly, and application-specific products. Technological advancements have focused on improving biodegradability, reducing toxicity, and enhancing performance in challenging conditions, such as extreme pH levels or high salinity environments. For instance, the development of novel non-ionic surfactants with superior emulsification properties has opened new avenues in personal care and industrial cleaning.
Shifting consumer demands play a pivotal role in this evolution. There's a palpable surge in preference for bio-based surfactants derived from renewable resources, driven by growing environmental consciousness and a desire for natural ingredients in personal care products and household detergents. This shift has compelled manufacturers to invest heavily in research and development for sustainable feedstock. The adoption of bio-based surfactants has grown at an estimated XX% CAGR during the historical period. Furthermore, the increasing stringency of environmental regulations globally, coupled with a heightened awareness of the potential impact of chemicals on human health and ecosystems, is another significant driver. Regulatory bodies are increasingly promoting the use of greener chemistries, thereby incentivizing the development and adoption of specialty surfactants that meet these criteria.
The application landscape has also broadened considerably. Historically dominated by household soap and detergent and personal care, the market has seen substantial growth in specialized applications such as oilfield chemicals, agricultural chemicals, and industrial and institutional cleaning. The demand for high-performance lubricants and fuel additives, where specialty surfactants play a crucial role in improving efficiency and reducing emissions, has also been a key growth area. The projected market size for the forecast period 2025–2033 is expected to reach over $XX Billion, reflecting sustained demand and continued innovation within the industry.
- Growth Rates: The historical period 2019-2024 exhibited an average annual growth rate of approximately XX%.
- Adoption Metrics: Bio-based surfactant adoption has seen an increase of XX% since 2019.
- Market Size Projections: The market is forecasted to grow from $XX Billion in 2025 to over $XX Billion by 2033.
Leading Regions, Countries, or Segments in Specialty Surfactant Industry
The specialty surfactant industry’s regional dominance and segment leadership are intricate, shaped by industrial infrastructure, economic development, and regulatory environments. Asia-Pacific, particularly China and India, has emerged as a leading region due to its burgeoning manufacturing sector, growing middle class, and increasing demand across diverse end-use applications like household detergents, personal care, and textiles. North America and Europe remain significant markets, driven by advanced technological adoption, stringent environmental regulations that favor high-performance and sustainable surfactants, and a strong presence of key players.
Within segments, Synthetic Surfactants continue to hold a dominant position, representing a significant market share due to their versatility, cost-effectiveness, and established production capabilities. However, the growth of Bio-based Surfactants is exceptionally robust, fueled by sustainability initiatives and consumer preference for eco-friendly products. This segment is experiencing a higher Compound Annual Growth Rate (CAGR) compared to synthetic counterparts.
Considering Type, Anionic Surfactants remain a cornerstone of the industry, widely used in detergents and cleaning products for their excellent foaming and cleaning properties. Non-ionic Surfactants are also critical, finding extensive use in personal care, agrochemicals, and industrial applications due to their mildness and compatibility. The demand for Amphoteric Surfactants is growing, particularly in personal care products, owing to their gentle nature and conditioning properties.
In terms of Application, the Household Soap and Detergent segment continues to be a major consumer of specialty surfactants, driven by global population growth and increasing hygiene awareness. The Personal Care sector is another colossal segment, with a rising demand for premium and natural-based formulations. Industry and Institutional Cleaning also presents substantial growth opportunities, fueled by stringent hygiene standards in commercial and public spaces. Oilfield Chemicals and Agricultural Chemicals are highly specialized segments that rely heavily on the performance characteristics of specialty surfactants for enhanced efficiency in extraction and crop protection, respectively.
- Key Drivers in Asia-Pacific: Rapid industrialization, increasing disposable incomes, and a large consumer base.
- Dominant Segments by Application: Household Soap and Detergent and Personal Care combined account for an estimated XX% of the market.
- Growth in Bio-based Surfactants: This segment is projected to grow at a CAGR of XX% from 2025 to 2033.
- Investment Trends: Significant investments are being directed towards R&D for bio-based and high-performance surfactants in North America and Europe.
Specialty Surfactant Industry Product Innovations
Product innovation in the specialty surfactant industry is primarily focused on enhancing biodegradability, reducing toxicity, and improving performance metrics across diverse applications. Advancements include the development of low-foaming surfactants for automatic dishwashing detergents, high-efficiency emulsifiers for agricultural formulations, and mild, sulfate-free surfactants for sensitive skin personal care products. Silicone surfactants are gaining traction for their unique properties in hair care and textile finishing. Novel delivery systems, such as microencapsulation of active ingredients using surfactants, are also emerging, offering controlled release and improved efficacy. These innovations are driven by both market demand for sustainable and high-performance solutions and increasingly stringent regulatory requirements.
Propelling Factors for Specialty Surfactant Industry Growth
Several key factors are propelling the growth of the specialty surfactant industry. The escalating demand for environmentally friendly and biodegradable products, driven by consumer awareness and regulatory mandates, is a primary catalyst. Technological advancements in synthesizing novel surfactant chemistries that offer superior performance and reduced environmental impact are also significant drivers. The expanding applications of specialty surfactants in burgeoning sectors like personal care, pharmaceuticals, and advanced agricultural formulations further fuel market expansion. Furthermore, the increasing emphasis on industrial efficiency and sustainability in sectors such as oil and gas and textiles necessitates the use of high-performance surfactants.
Obstacles in the Specialty Surfactant Industry Market
Despite robust growth, the specialty surfactant industry faces several obstacles. Stringent and evolving regulatory landscapes worldwide, particularly concerning chemical safety and environmental impact, can lead to increased compliance costs and hinder product development timelines. Fluctuations in the prices of raw materials, especially those derived from petrochemicals or agricultural feedstocks, can impact profit margins and market stability. Supply chain disruptions, exacerbated by geopolitical events and logistical challenges, can affect the availability and cost of essential ingredients. Intense competition from established players and the emergence of new market entrants also create pricing pressures and necessitate continuous innovation to maintain market share.
Future Opportunities in Specialty Surfactant Industry
The specialty surfactant industry is poised for significant future opportunities. The accelerating shift towards bio-based and renewable surfactants presents a substantial growth avenue, aligning with global sustainability goals. Emerging markets in developing economies, with their growing populations and increasing disposable incomes, offer untapped potential for various surfactant applications. The continuous evolution of end-use industries, such as advanced materials, biotechnology, and renewable energy, will create new demands for specialized surfactant functionalities. Furthermore, the development of smart surfactants with responsive properties and the integration of digital technologies for optimized surfactant usage and supply chain management represent exciting future frontiers.
Major Players in the Specialty Surfactant Industry Ecosystem
- Clariant
- Arkema
- GEO
- Nouryon
- Solvay
- Sanyo Chemical Industries Ltd
- KLK OLEO
- Reliance Industries Limited
- Evonik Industries AG
- 3M
- Stepan Company
- Croda International Plc
- Ashland
- Emery Oleochemicals
- BASF SE
- Huntsman International LLC
- ELEMENTIS PLC
- Sasol
- Akzo Nobel N V
- Dow
- KAO CORPORATION
- Godrej Industries Limited
- Sumitomo Corporation*List Not Exhaustive
- GALAXY
- Lonza
- Mitsui & Co Ltd
- Innospec
Key Developments in Specialty Surfactant Industry Industry
- December 2022: Nouryon expanded its specialized surfactant alkoxylation presence in Southeast Asia through an asset purchase on Jurong Island in Singapore. The purchased plant will help Nouryon meet expanding regional customer demand in important end-markets such as agriculture and food, home and personal care, natural resources, and paints and coatings.
- October 2022: BASF and Hannong Chemicals announced plans to establish a production joint venture for the commercial production of non-ionic specialty surfactants in the Asia-Pacific region.
Strategic Specialty Surfactant Industry Market Forecast
The strategic forecast for the specialty surfactant industry anticipates continued robust growth, primarily driven by the global imperative for sustainability and innovation. The increasing adoption of bio-based and biodegradable surfactants will be a key growth catalyst, supported by favorable regulatory policies and rising consumer demand for eco-conscious products. Advancements in surfactant technology, enabling higher performance and efficiency across diverse applications, will also contribute significantly. Emerging market penetration and the expansion of specialty surfactant use in high-growth sectors such as advanced materials, pharmaceuticals, and agriculture will further bolster market potential, positioning the industry for sustained expansion and significant value creation in the coming years.
Specialty Surfactant Industry Segmentation
-
1. Origin
- 1.1. Synthetic Surfactants
- 1.2. Bio-based Surfactants
-
2. Type
- 2.1. Anionic Surfactants
- 2.2. Cationic Surfactants
- 2.3. Non-ionic Surfactants
- 2.4. Amphoteric Surfactants
- 2.5. Silicone Surfactants
- 2.6. Other Types
-
3. Application
- 3.1. Household Soap and Detergent
- 3.2. Personal Care
- 3.3. Lubricants and Fuel Additives
- 3.4. Industry and Institutional Cleaning
- 3.5. Food Processing
- 3.6. Oilfield Chemicals
- 3.7. Agricultural Chemicals
- 3.8. Textile Processing
- 3.9. Other Applications
Specialty Surfactant Industry Segmentation By Geography
-
1. Asia Pacific
- 1.1. China
- 1.2. India
- 1.3. Japan
- 1.4. South Korea
- 1.5. ASEAN Countries
- 1.6. Rest of Asia Pacific
-
2. North America
- 2.1. United States
- 2.2. Canada
- 2.3. Mexico
-
3. Europe
- 3.1. Germany
- 3.2. United Kingdom
- 3.3. Italy
- 3.4. France
- 3.5. Rest of Europe
-
4. South America
- 4.1. Brazil
- 4.2. Argentina
- 4.3. Rest of South America
-
5. Middle East and Africa
- 5.1. Saudi Arabia
- 5.2. South Africa
- 5.3. Rest of Middle East and Africa
Specialty Surfactant Industry Regional Market Share
Geographic Coverage of Specialty Surfactant Industry
Specialty Surfactant Industry REPORT HIGHLIGHTS
| Aspects | Details |
|---|---|
| Study Period | 2020-2034 |
| Base Year | 2025 |
| Estimated Year | 2026 |
| Forecast Period | 2026-2034 |
| Historical Period | 2020-2025 |
| Growth Rate | CAGR of 5.3% from 2020-2034 |
| Segmentation |
|
Table of Contents
- 1. Introduction
- 1.1. Research Scope
- 1.2. Market Segmentation
- 1.3. Research Objective
- 1.4. Definitions and Assumptions
- 2. Executive Summary
- 2.1. Market Snapshot
- 3. Market Dynamics
- 3.1. Market Drivers
- 3.2. Market Restrains
- 3.3. Market Trends
- 3.4. Market Opportunities
- 4. Market Factor Analysis
- 4.1. Porters Five Forces
- 4.1.1. Bargaining Power of Suppliers
- 4.1.2. Bargaining Power of Buyers
- 4.1.3. Threat of New Entrants
- 4.1.4. Threat of Substitutes
- 4.1.5. Competitive Rivalry
- 4.2. PESTEL analysis
- 4.3. BCG Analysis
- 4.3.1. Stars (High Growth, High Market Share)
- 4.3.2. Cash Cows (Low Growth, High Market Share)
- 4.3.3. Question Mark (High Growth, Low Market Share)
- 4.3.4. Dogs (Low Growth, Low Market Share)
- 4.4. Ansoff Matrix Analysis
- 4.5. Supply Chain Analysis
- 4.6. Regulatory Landscape
- 4.7. Current Market Potential and Opportunity Assessment (TAM–SAM–SOM Framework)
- 4.8. DMV Analyst Note
- 4.1. Porters Five Forces
- 5. Market Analysis, Insights and Forecast 2021-2033
- 5.1. Market Analysis, Insights and Forecast - by Origin
- 5.1.1. Synthetic Surfactants
- 5.1.2. Bio-based Surfactants
- 5.2. Market Analysis, Insights and Forecast - by Type
- 5.2.1. Anionic Surfactants
- 5.2.2. Cationic Surfactants
- 5.2.3. Non-ionic Surfactants
- 5.2.4. Amphoteric Surfactants
- 5.2.5. Silicone Surfactants
- 5.2.6. Other Types
- 5.3. Market Analysis, Insights and Forecast - by Application
- 5.3.1. Household Soap and Detergent
- 5.3.2. Personal Care
- 5.3.3. Lubricants and Fuel Additives
- 5.3.4. Industry and Institutional Cleaning
- 5.3.5. Food Processing
- 5.3.6. Oilfield Chemicals
- 5.3.7. Agricultural Chemicals
- 5.3.8. Textile Processing
- 5.3.9. Other Applications
- 5.4. Market Analysis, Insights and Forecast - by Region
- 5.4.1. Asia Pacific
- 5.4.2. North America
- 5.4.3. Europe
- 5.4.4. South America
- 5.4.5. Middle East and Africa
- 5.1. Market Analysis, Insights and Forecast - by Origin
- 6. Global Specialty Surfactant Industry Analysis, Insights and Forecast, 2021-2033
- 6.1. Market Analysis, Insights and Forecast - by Origin
- 6.1.1. Synthetic Surfactants
- 6.1.2. Bio-based Surfactants
- 6.2. Market Analysis, Insights and Forecast - by Type
- 6.2.1. Anionic Surfactants
- 6.2.2. Cationic Surfactants
- 6.2.3. Non-ionic Surfactants
- 6.2.4. Amphoteric Surfactants
- 6.2.5. Silicone Surfactants
- 6.2.6. Other Types
- 6.3. Market Analysis, Insights and Forecast - by Application
- 6.3.1. Household Soap and Detergent
- 6.3.2. Personal Care
- 6.3.3. Lubricants and Fuel Additives
- 6.3.4. Industry and Institutional Cleaning
- 6.3.5. Food Processing
- 6.3.6. Oilfield Chemicals
- 6.3.7. Agricultural Chemicals
- 6.3.8. Textile Processing
- 6.3.9. Other Applications
- 6.1. Market Analysis, Insights and Forecast - by Origin
- 7. Asia Pacific Specialty Surfactant Industry Analysis, Insights and Forecast, 2020-2032
- 7.1. Market Analysis, Insights and Forecast - by Origin
- 7.1.1. Synthetic Surfactants
- 7.1.2. Bio-based Surfactants
- 7.2. Market Analysis, Insights and Forecast - by Type
- 7.2.1. Anionic Surfactants
- 7.2.2. Cationic Surfactants
- 7.2.3. Non-ionic Surfactants
- 7.2.4. Amphoteric Surfactants
- 7.2.5. Silicone Surfactants
- 7.2.6. Other Types
- 7.3. Market Analysis, Insights and Forecast - by Application
- 7.3.1. Household Soap and Detergent
- 7.3.2. Personal Care
- 7.3.3. Lubricants and Fuel Additives
- 7.3.4. Industry and Institutional Cleaning
- 7.3.5. Food Processing
- 7.3.6. Oilfield Chemicals
- 7.3.7. Agricultural Chemicals
- 7.3.8. Textile Processing
- 7.3.9. Other Applications
- 7.1. Market Analysis, Insights and Forecast - by Origin
- 8. North America Specialty Surfactant Industry Analysis, Insights and Forecast, 2020-2032
- 8.1. Market Analysis, Insights and Forecast - by Origin
- 8.1.1. Synthetic Surfactants
- 8.1.2. Bio-based Surfactants
- 8.2. Market Analysis, Insights and Forecast - by Type
- 8.2.1. Anionic Surfactants
- 8.2.2. Cationic Surfactants
- 8.2.3. Non-ionic Surfactants
- 8.2.4. Amphoteric Surfactants
- 8.2.5. Silicone Surfactants
- 8.2.6. Other Types
- 8.3. Market Analysis, Insights and Forecast - by Application
- 8.3.1. Household Soap and Detergent
- 8.3.2. Personal Care
- 8.3.3. Lubricants and Fuel Additives
- 8.3.4. Industry and Institutional Cleaning
- 8.3.5. Food Processing
- 8.3.6. Oilfield Chemicals
- 8.3.7. Agricultural Chemicals
- 8.3.8. Textile Processing
- 8.3.9. Other Applications
- 8.1. Market Analysis, Insights and Forecast - by Origin
- 9. Europe Specialty Surfactant Industry Analysis, Insights and Forecast, 2020-2032
- 9.1. Market Analysis, Insights and Forecast - by Origin
- 9.1.1. Synthetic Surfactants
- 9.1.2. Bio-based Surfactants
- 9.2. Market Analysis, Insights and Forecast - by Type
- 9.2.1. Anionic Surfactants
- 9.2.2. Cationic Surfactants
- 9.2.3. Non-ionic Surfactants
- 9.2.4. Amphoteric Surfactants
- 9.2.5. Silicone Surfactants
- 9.2.6. Other Types
- 9.3. Market Analysis, Insights and Forecast - by Application
- 9.3.1. Household Soap and Detergent
- 9.3.2. Personal Care
- 9.3.3. Lubricants and Fuel Additives
- 9.3.4. Industry and Institutional Cleaning
- 9.3.5. Food Processing
- 9.3.6. Oilfield Chemicals
- 9.3.7. Agricultural Chemicals
- 9.3.8. Textile Processing
- 9.3.9. Other Applications
- 9.1. Market Analysis, Insights and Forecast - by Origin
- 10. South America Specialty Surfactant Industry Analysis, Insights and Forecast, 2020-2032
- 10.1. Market Analysis, Insights and Forecast - by Origin
- 10.1.1. Synthetic Surfactants
- 10.1.2. Bio-based Surfactants
- 10.2. Market Analysis, Insights and Forecast - by Type
- 10.2.1. Anionic Surfactants
- 10.2.2. Cationic Surfactants
- 10.2.3. Non-ionic Surfactants
- 10.2.4. Amphoteric Surfactants
- 10.2.5. Silicone Surfactants
- 10.2.6. Other Types
- 10.3. Market Analysis, Insights and Forecast - by Application
- 10.3.1. Household Soap and Detergent
- 10.3.2. Personal Care
- 10.3.3. Lubricants and Fuel Additives
- 10.3.4. Industry and Institutional Cleaning
- 10.3.5. Food Processing
- 10.3.6. Oilfield Chemicals
- 10.3.7. Agricultural Chemicals
- 10.3.8. Textile Processing
- 10.3.9. Other Applications
- 10.1. Market Analysis, Insights and Forecast - by Origin
- 11. Middle East and Africa Specialty Surfactant Industry Analysis, Insights and Forecast, 2020-2032
- 11.1. Market Analysis, Insights and Forecast - by Origin
- 11.1.1. Synthetic Surfactants
- 11.1.2. Bio-based Surfactants
- 11.2. Market Analysis, Insights and Forecast - by Type
- 11.2.1. Anionic Surfactants
- 11.2.2. Cationic Surfactants
- 11.2.3. Non-ionic Surfactants
- 11.2.4. Amphoteric Surfactants
- 11.2.5. Silicone Surfactants
- 11.2.6. Other Types
- 11.3. Market Analysis, Insights and Forecast - by Application
- 11.3.1. Household Soap and Detergent
- 11.3.2. Personal Care
- 11.3.3. Lubricants and Fuel Additives
- 11.3.4. Industry and Institutional Cleaning
- 11.3.5. Food Processing
- 11.3.6. Oilfield Chemicals
- 11.3.7. Agricultural Chemicals
- 11.3.8. Textile Processing
- 11.3.9. Other Applications
- 11.1. Market Analysis, Insights and Forecast - by Origin
- 12. Competitive Analysis
- 12.1. Company Profiles
- 12.1.1 Clariant
- 12.1.1.1. Company Overview
- 12.1.1.2. Products
- 12.1.1.3. Company Financials
- 12.1.1.4. SWOT Analysis
- 12.1.2 Arkema
- 12.1.2.1. Company Overview
- 12.1.2.2. Products
- 12.1.2.3. Company Financials
- 12.1.2.4. SWOT Analysis
- 12.1.3 GEO
- 12.1.3.1. Company Overview
- 12.1.3.2. Products
- 12.1.3.3. Company Financials
- 12.1.3.4. SWOT Analysis
- 12.1.4 Nouryon
- 12.1.4.1. Company Overview
- 12.1.4.2. Products
- 12.1.4.3. Company Financials
- 12.1.4.4. SWOT Analysis
- 12.1.5 Solvay
- 12.1.5.1. Company Overview
- 12.1.5.2. Products
- 12.1.5.3. Company Financials
- 12.1.5.4. SWOT Analysis
- 12.1.6 Sanyo Chemical Industries Ltd
- 12.1.6.1. Company Overview
- 12.1.6.2. Products
- 12.1.6.3. Company Financials
- 12.1.6.4. SWOT Analysis
- 12.1.7 KLK OLEO
- 12.1.7.1. Company Overview
- 12.1.7.2. Products
- 12.1.7.3. Company Financials
- 12.1.7.4. SWOT Analysis
- 12.1.8 Reliance Industries Limited
- 12.1.8.1. Company Overview
- 12.1.8.2. Products
- 12.1.8.3. Company Financials
- 12.1.8.4. SWOT Analysis
- 12.1.9 Evonik Industries AG
- 12.1.9.1. Company Overview
- 12.1.9.2. Products
- 12.1.9.3. Company Financials
- 12.1.9.4. SWOT Analysis
- 12.1.10 3M
- 12.1.10.1. Company Overview
- 12.1.10.2. Products
- 12.1.10.3. Company Financials
- 12.1.10.4. SWOT Analysis
- 12.1.11 Stepan Company
- 12.1.11.1. Company Overview
- 12.1.11.2. Products
- 12.1.11.3. Company Financials
- 12.1.11.4. SWOT Analysis
- 12.1.12 Croda International Plc
- 12.1.12.1. Company Overview
- 12.1.12.2. Products
- 12.1.12.3. Company Financials
- 12.1.12.4. SWOT Analysis
- 12.1.13 Ashland
- 12.1.13.1. Company Overview
- 12.1.13.2. Products
- 12.1.13.3. Company Financials
- 12.1.13.4. SWOT Analysis
- 12.1.14 Emery Oleochemicals
- 12.1.14.1. Company Overview
- 12.1.14.2. Products
- 12.1.14.3. Company Financials
- 12.1.14.4. SWOT Analysis
- 12.1.15 BASF SE
- 12.1.15.1. Company Overview
- 12.1.15.2. Products
- 12.1.15.3. Company Financials
- 12.1.15.4. SWOT Analysis
- 12.1.16 Huntsman International LLC
- 12.1.16.1. Company Overview
- 12.1.16.2. Products
- 12.1.16.3. Company Financials
- 12.1.16.4. SWOT Analysis
- 12.1.17 ELEMENTIS PLC
- 12.1.17.1. Company Overview
- 12.1.17.2. Products
- 12.1.17.3. Company Financials
- 12.1.17.4. SWOT Analysis
- 12.1.18 Sasol
- 12.1.18.1. Company Overview
- 12.1.18.2. Products
- 12.1.18.3. Company Financials
- 12.1.18.4. SWOT Analysis
- 12.1.19 Akzo Nobel N V
- 12.1.19.1. Company Overview
- 12.1.19.2. Products
- 12.1.19.3. Company Financials
- 12.1.19.4. SWOT Analysis
- 12.1.20 Dow
- 12.1.20.1. Company Overview
- 12.1.20.2. Products
- 12.1.20.3. Company Financials
- 12.1.20.4. SWOT Analysis
- 12.1.21 KAO CORPORATION
- 12.1.21.1. Company Overview
- 12.1.21.2. Products
- 12.1.21.3. Company Financials
- 12.1.21.4. SWOT Analysis
- 12.1.22 Godrej Industries Limited
- 12.1.22.1. Company Overview
- 12.1.22.2. Products
- 12.1.22.3. Company Financials
- 12.1.22.4. SWOT Analysis
- 12.1.23 Sumitomo Corporation*List Not Exhaustive
- 12.1.23.1. Company Overview
- 12.1.23.2. Products
- 12.1.23.3. Company Financials
- 12.1.23.4. SWOT Analysis
- 12.1.24 GALAXY
- 12.1.24.1. Company Overview
- 12.1.24.2. Products
- 12.1.24.3. Company Financials
- 12.1.24.4. SWOT Analysis
- 12.1.25 Lonza
- 12.1.25.1. Company Overview
- 12.1.25.2. Products
- 12.1.25.3. Company Financials
- 12.1.25.4. SWOT Analysis
- 12.1.26 Mitsui & Co Ltd
- 12.1.26.1. Company Overview
- 12.1.26.2. Products
- 12.1.26.3. Company Financials
- 12.1.26.4. SWOT Analysis
- 12.1.27 Innospec
- 12.1.27.1. Company Overview
- 12.1.27.2. Products
- 12.1.27.3. Company Financials
- 12.1.27.4. SWOT Analysis
- 12.1.1 Clariant
- 12.2. Market Entropy
- 12.2.1 Company's Key Areas Served
- 12.2.2 Recent Developments
- 12.3. Company Market Share Analysis 2025
- 12.3.1 Top 5 Companies Market Share Analysis
- 12.3.2 Top 3 Companies Market Share Analysis
- 12.4. List of Potential Customers
- 13. Research Methodology
List of Figures
- Figure 1: Global Specialty Surfactant Industry Revenue Breakdown (billion, %) by Region 2025 & 2033
- Figure 2: Asia Pacific Specialty Surfactant Industry Revenue (billion), by Origin 2025 & 2033
- Figure 3: Asia Pacific Specialty Surfactant Industry Revenue Share (%), by Origin 2025 & 2033
- Figure 4: Asia Pacific Specialty Surfactant Industry Revenue (billion), by Type 2025 & 2033
- Figure 5: Asia Pacific Specialty Surfactant Industry Revenue Share (%), by Type 2025 & 2033
- Figure 6: Asia Pacific Specialty Surfactant Industry Revenue (billion), by Application 2025 & 2033
- Figure 7: Asia Pacific Specialty Surfactant Industry Revenue Share (%), by Application 2025 & 2033
- Figure 8: Asia Pacific Specialty Surfactant Industry Revenue (billion), by Country 2025 & 2033
- Figure 9: Asia Pacific Specialty Surfactant Industry Revenue Share (%), by Country 2025 & 2033
- Figure 10: North America Specialty Surfactant Industry Revenue (billion), by Origin 2025 & 2033
- Figure 11: North America Specialty Surfactant Industry Revenue Share (%), by Origin 2025 & 2033
- Figure 12: North America Specialty Surfactant Industry Revenue (billion), by Type 2025 & 2033
- Figure 13: North America Specialty Surfactant Industry Revenue Share (%), by Type 2025 & 2033
- Figure 14: North America Specialty Surfactant Industry Revenue (billion), by Application 2025 & 2033
- Figure 15: North America Specialty Surfactant Industry Revenue Share (%), by Application 2025 & 2033
- Figure 16: North America Specialty Surfactant Industry Revenue (billion), by Country 2025 & 2033
- Figure 17: North America Specialty Surfactant Industry Revenue Share (%), by Country 2025 & 2033
- Figure 18: Europe Specialty Surfactant Industry Revenue (billion), by Origin 2025 & 2033
- Figure 19: Europe Specialty Surfactant Industry Revenue Share (%), by Origin 2025 & 2033
- Figure 20: Europe Specialty Surfactant Industry Revenue (billion), by Type 2025 & 2033
- Figure 21: Europe Specialty Surfactant Industry Revenue Share (%), by Type 2025 & 2033
- Figure 22: Europe Specialty Surfactant Industry Revenue (billion), by Application 2025 & 2033
- Figure 23: Europe Specialty Surfactant Industry Revenue Share (%), by Application 2025 & 2033
- Figure 24: Europe Specialty Surfactant Industry Revenue (billion), by Country 2025 & 2033
- Figure 25: Europe Specialty Surfactant Industry Revenue Share (%), by Country 2025 & 2033
- Figure 26: South America Specialty Surfactant Industry Revenue (billion), by Origin 2025 & 2033
- Figure 27: South America Specialty Surfactant Industry Revenue Share (%), by Origin 2025 & 2033
- Figure 28: South America Specialty Surfactant Industry Revenue (billion), by Type 2025 & 2033
- Figure 29: South America Specialty Surfactant Industry Revenue Share (%), by Type 2025 & 2033
- Figure 30: South America Specialty Surfactant Industry Revenue (billion), by Application 2025 & 2033
- Figure 31: South America Specialty Surfactant Industry Revenue Share (%), by Application 2025 & 2033
- Figure 32: South America Specialty Surfactant Industry Revenue (billion), by Country 2025 & 2033
- Figure 33: South America Specialty Surfactant Industry Revenue Share (%), by Country 2025 & 2033
- Figure 34: Middle East and Africa Specialty Surfactant Industry Revenue (billion), by Origin 2025 & 2033
- Figure 35: Middle East and Africa Specialty Surfactant Industry Revenue Share (%), by Origin 2025 & 2033
- Figure 36: Middle East and Africa Specialty Surfactant Industry Revenue (billion), by Type 2025 & 2033
- Figure 37: Middle East and Africa Specialty Surfactant Industry Revenue Share (%), by Type 2025 & 2033
- Figure 38: Middle East and Africa Specialty Surfactant Industry Revenue (billion), by Application 2025 & 2033
- Figure 39: Middle East and Africa Specialty Surfactant Industry Revenue Share (%), by Application 2025 & 2033
- Figure 40: Middle East and Africa Specialty Surfactant Industry Revenue (billion), by Country 2025 & 2033
- Figure 41: Middle East and Africa Specialty Surfactant Industry Revenue Share (%), by Country 2025 & 2033
List of Tables
- Table 1: Global Specialty Surfactant Industry Revenue billion Forecast, by Origin 2020 & 2033
- Table 2: Global Specialty Surfactant Industry Revenue billion Forecast, by Type 2020 & 2033
- Table 3: Global Specialty Surfactant Industry Revenue billion Forecast, by Application 2020 & 2033
- Table 4: Global Specialty Surfactant Industry Revenue billion Forecast, by Region 2020 & 2033
- Table 5: Global Specialty Surfactant Industry Revenue billion Forecast, by Origin 2020 & 2033
- Table 6: Global Specialty Surfactant Industry Revenue billion Forecast, by Type 2020 & 2033
- Table 7: Global Specialty Surfactant Industry Revenue billion Forecast, by Application 2020 & 2033
- Table 8: Global Specialty Surfactant Industry Revenue billion Forecast, by Country 2020 & 2033
- Table 9: China Specialty Surfactant Industry Revenue (billion) Forecast, by Application 2020 & 2033
- Table 10: India Specialty Surfactant Industry Revenue (billion) Forecast, by Application 2020 & 2033
- Table 11: Japan Specialty Surfactant Industry Revenue (billion) Forecast, by Application 2020 & 2033
- Table 12: South Korea Specialty Surfactant Industry Revenue (billion) Forecast, by Application 2020 & 2033
- Table 13: ASEAN Countries Specialty Surfactant Industry Revenue (billion) Forecast, by Application 2020 & 2033
- Table 14: Rest of Asia Pacific Specialty Surfactant Industry Revenue (billion) Forecast, by Application 2020 & 2033
- Table 15: Global Specialty Surfactant Industry Revenue billion Forecast, by Origin 2020 & 2033
- Table 16: Global Specialty Surfactant Industry Revenue billion Forecast, by Type 2020 & 2033
- Table 17: Global Specialty Surfactant Industry Revenue billion Forecast, by Application 2020 & 2033
- Table 18: Global Specialty Surfactant Industry Revenue billion Forecast, by Country 2020 & 2033
- Table 19: United States Specialty Surfactant Industry Revenue (billion) Forecast, by Application 2020 & 2033
- Table 20: Canada Specialty Surfactant Industry Revenue (billion) Forecast, by Application 2020 & 2033
- Table 21: Mexico Specialty Surfactant Industry Revenue (billion) Forecast, by Application 2020 & 2033
- Table 22: Global Specialty Surfactant Industry Revenue billion Forecast, by Origin 2020 & 2033
- Table 23: Global Specialty Surfactant Industry Revenue billion Forecast, by Type 2020 & 2033
- Table 24: Global Specialty Surfactant Industry Revenue billion Forecast, by Application 2020 & 2033
- Table 25: Global Specialty Surfactant Industry Revenue billion Forecast, by Country 2020 & 2033
- Table 26: Germany Specialty Surfactant Industry Revenue (billion) Forecast, by Application 2020 & 2033
- Table 27: United Kingdom Specialty Surfactant Industry Revenue (billion) Forecast, by Application 2020 & 2033
- Table 28: Italy Specialty Surfactant Industry Revenue (billion) Forecast, by Application 2020 & 2033
- Table 29: France Specialty Surfactant Industry Revenue (billion) Forecast, by Application 2020 & 2033
- Table 30: Rest of Europe Specialty Surfactant Industry Revenue (billion) Forecast, by Application 2020 & 2033
- Table 31: Global Specialty Surfactant Industry Revenue billion Forecast, by Origin 2020 & 2033
- Table 32: Global Specialty Surfactant Industry Revenue billion Forecast, by Type 2020 & 2033
- Table 33: Global Specialty Surfactant Industry Revenue billion Forecast, by Application 2020 & 2033
- Table 34: Global Specialty Surfactant Industry Revenue billion Forecast, by Country 2020 & 2033
- Table 35: Brazil Specialty Surfactant Industry Revenue (billion) Forecast, by Application 2020 & 2033
- Table 36: Argentina Specialty Surfactant Industry Revenue (billion) Forecast, by Application 2020 & 2033
- Table 37: Rest of South America Specialty Surfactant Industry Revenue (billion) Forecast, by Application 2020 & 2033
- Table 38: Global Specialty Surfactant Industry Revenue billion Forecast, by Origin 2020 & 2033
- Table 39: Global Specialty Surfactant Industry Revenue billion Forecast, by Type 2020 & 2033
- Table 40: Global Specialty Surfactant Industry Revenue billion Forecast, by Application 2020 & 2033
- Table 41: Global Specialty Surfactant Industry Revenue billion Forecast, by Country 2020 & 2033
- Table 42: Saudi Arabia Specialty Surfactant Industry Revenue (billion) Forecast, by Application 2020 & 2033
- Table 43: South Africa Specialty Surfactant Industry Revenue (billion) Forecast, by Application 2020 & 2033
- Table 44: Rest of Middle East and Africa Specialty Surfactant Industry Revenue (billion) Forecast, by Application 2020 & 2033
Frequently Asked Questions
1. What is the projected Compound Annual Growth Rate (CAGR) of the Specialty Surfactant Industry?
The projected CAGR is approximately 5.3%.
2. Which companies are prominent players in the Specialty Surfactant Industry?
Key companies in the market include Clariant, Arkema, GEO, Nouryon, Solvay, Sanyo Chemical Industries Ltd, KLK OLEO, Reliance Industries Limited, Evonik Industries AG, 3M, Stepan Company, Croda International Plc, Ashland, Emery Oleochemicals, BASF SE, Huntsman International LLC, ELEMENTIS PLC, Sasol, Akzo Nobel N V, Dow, KAO CORPORATION, Godrej Industries Limited, Sumitomo Corporation*List Not Exhaustive, GALAXY, Lonza, Mitsui & Co Ltd, Innospec.
3. What are the main segments of the Specialty Surfactant Industry?
The market segments include Origin, Type, Application.
4. Can you provide details about the market size?
The market size is estimated to be USD 47.4 billion as of 2022.
5. What are some drivers contributing to market growth?
Growing Personal Care Industry In Asia-pacific; Growth Of The Oleo Chemicals Market.
6. What are the notable trends driving market growth?
Household Soap and Detergent Application to Dominate the Market.
7. Are there any restraints impacting market growth?
Increasing Focus On Environmental Regulations.
8. Can you provide examples of recent developments in the market?
December 2022: Nouryon expanded its specialized surfactant alkoxylation presence in Southeast Asia through an asset purchase on Jurong Island in Singapore. The purchased plant will help Nouryon meet expanding regional customer demand in important end-markets such as agriculture and food, home and personal care, natural resources, and paints and coatings.
9. What pricing options are available for accessing the report?
Pricing options include single-user, multi-user, and enterprise licenses priced at USD 4750, USD 5250, and USD 8750 respectively.
10. Is the market size provided in terms of value or volume?
The market size is provided in terms of value, measured in billion.
11. Are there any specific market keywords associated with the report?
Yes, the market keyword associated with the report is "Specialty Surfactant Industry," which aids in identifying and referencing the specific market segment covered.
12. How do I determine which pricing option suits my needs best?
The pricing options vary based on user requirements and access needs. Individual users may opt for single-user licenses, while businesses requiring broader access may choose multi-user or enterprise licenses for cost-effective access to the report.
13. Are there any additional resources or data provided in the Specialty Surfactant Industry report?
While the report offers comprehensive insights, it's advisable to review the specific contents or supplementary materials provided to ascertain if additional resources or data are available.
14. How can I stay updated on further developments or reports in the Specialty Surfactant Industry?
To stay informed about further developments, trends, and reports in the Specialty Surfactant Industry, consider subscribing to industry newsletters, following relevant companies and organizations, or regularly checking reputable industry news sources and publications.
Methodology
Step 1 - Identification of Relevant Samples Size from Population Database


Step 2 - Approaches for Defining Global Market Size (Value, Volume* & Price*)

Note*: In applicable scenarios
Step 3 - Data Sources
Primary Research
- Web Analytics
- Survey Reports
- Research Institute
- Latest Research Reports
- Opinion Leaders
Secondary Research
- Annual Reports
- White Paper
- Latest Press Release
- Industry Association
- Paid Database
- Investor Presentations

Step 4 - Data Triangulation
Involves using different sources of information in order to increase the validity of a study
These sources are likely to be stakeholders in a program - participants, other researchers, program staff, other community members, and so on.
Then we put all data in single framework & apply various statistical tools to find out the dynamic on the market.
During the analysis stage, feedback from the stakeholder groups would be compared to determine areas of agreement as well as areas of divergence