

Key Insights
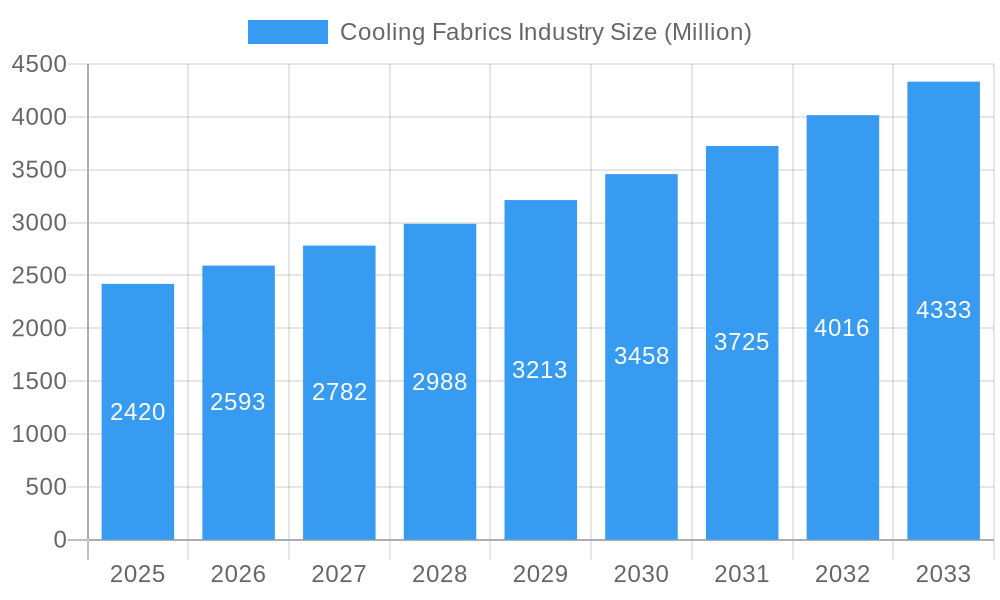
The global cooling fabrics market, valued at $2.42 billion in 2025, is projected to experience robust growth, driven by rising demand for athletic apparel, increasing health consciousness, and technological advancements in fabric production. The 7.21% CAGR from 2019 to 2025 indicates a consistently expanding market, fueled by factors such as the growing popularity of sportswear and outdoor activities, particularly in regions with warmer climates. The market segmentation reveals significant opportunities within the sportswear and protective wear applications, with a notable preference for natural and synthetic blends depending on performance requirements. The dominance of woven and knitted fabric types highlights the continued importance of traditional manufacturing processes while technological advancements in non-woven fabrics are emerging as a key growth area. Leading companies like Asahi Kasei Corporation, Polartec, and HeiQ Materials AG are driving innovation by introducing high-performance, sustainable, and eco-friendly cooling fabrics. Regional analysis suggests strong growth across Asia Pacific, driven by large and expanding consumer markets in China and India, while North America and Europe represent mature but still significant markets, presenting opportunities for premium and specialized cooling fabric products.
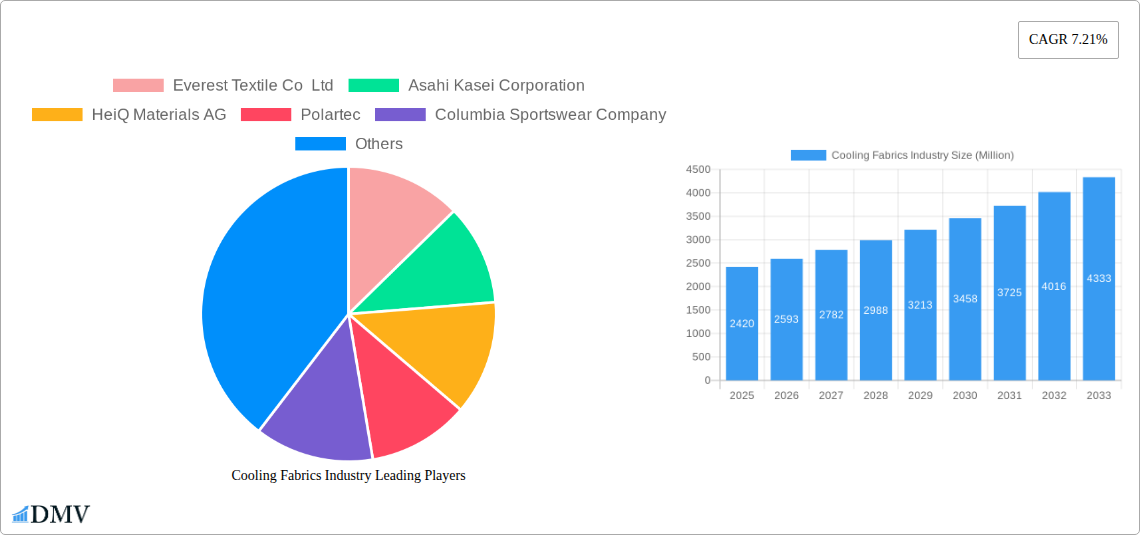
Cooling Fabrics Industry Market Size (In Billion)
The forecast period of 2025-2033 promises continued expansion, with the market poised to capitalize on emerging trends like the integration of smart textiles, personalized cooling solutions, and increasing focus on sustainable and recycled materials. Growth will be further influenced by factors such as technological advancements in moisture-wicking technologies, improved breathability, and antimicrobial properties. However, challenges such as fluctuating raw material prices and stringent environmental regulations may exert some restraint on market growth. Nevertheless, the overall outlook remains positive, with significant potential for growth across diverse applications and geographical regions, positioning cooling fabrics as a key player in the global textile and apparel industry.
Cooling Fabrics Industry Company Market Share
Cooling Fabrics Industry: A Comprehensive Market Report (2019-2033)
This insightful report provides a detailed analysis of the Cooling Fabrics industry, encompassing market size, trends, leading players, and future growth prospects. With a study period spanning 2019-2033, a base year of 2025, and a forecast period of 2025-2033, this report is an essential resource for stakeholders seeking to understand and capitalize on the opportunities within this dynamic sector. The global cooling fabrics market is projected to reach xx Million by 2033, exhibiting a robust CAGR.
Cooling Fabrics Industry Market Composition & Trends
The cooling fabrics market is characterized by a moderately concentrated landscape, with key players such as Asahi Kasei Corporation, HeiQ Materials AG, and NILIT holding significant market share. The exact distribution is difficult to ascertain precisely without internal company data but estimations from market research places the top 5 companies controlling approximately 40% of the market. Innovation is a key driver, with companies continuously developing new fabrics using advanced materials and technologies to enhance breathability, moisture-wicking capabilities, and UV protection. The regulatory landscape, particularly regarding sustainability and chemical usage, is evolving, influencing material selection and manufacturing processes. Substitute products, such as traditional cotton blends, continue to exist, but the increasing demand for enhanced performance and comfort is driving the adoption of cooling fabrics. The primary end-users are within the sportswear, apparel, and protective wear sectors, each with unique demands and preferences. M&A activity has been relatively moderate in recent years, with deal values averaging xx Million per transaction, mostly focusing on smaller firms specializing in niche technologies being absorbed by larger companies.
- Market Concentration: Moderately concentrated, top 5 players control approximately 40% of the market.
- Innovation Catalysts: Advancements in material science, biomimicry, and nanotechnology.
- Regulatory Landscape: Growing emphasis on sustainability and environmental regulations.
- Substitute Products: Traditional cotton and other natural fibers.
- End-User Profiles: Sportswear, apparel, protective wear, and medical sectors.
- M&A Activity: Moderate, with average deal values around xx Million.
Cooling Fabrics Industry Industry Evolution
The cooling fabrics industry has experienced significant growth over the historical period (2019-2024), driven by rising consumer demand for comfortable and high-performance apparel and protective gear. Technological advancements, such as the integration of phase-change materials and advanced fiber structures, have significantly improved the performance of cooling fabrics. The market is witnessing a shift towards sustainable and eco-friendly materials, such as recycled nylon and plant-based fibers, aligning with growing environmental consciousness among consumers. This increasing demand for sustainable products has led to a significant increase in the adoption of recycled materials, leading to a xx% increase in recycled content usage in cooling fabrics between 2019 and 2024. Growth rates have varied across segments, with the sportswear segment demonstrating the highest growth due to increasing participation in athletic activities. The overall market growth trajectory is expected to remain positive over the forecast period (2025-2033), driven by continuous product innovations and increasing consumer awareness of the benefits of cooling fabrics. This will be partially offset by economic downturns and changing consumer preferences.
Leading Regions, Countries, or Segments in Cooling Fabrics Industry
The North American market currently dominates the cooling fabrics industry, driven by strong consumer demand and a significant presence of major players. However, the Asia-Pacific region exhibits high growth potential due to rising disposable incomes and increasing participation in sports and outdoor activities. Within application segments, sportswear maintains its position as the largest consumer of cooling fabrics.
- Key Drivers (North America): High consumer spending on athletic wear, strong presence of major brands, robust innovation ecosystem.
- Key Drivers (Asia-Pacific): Rapidly expanding middle class, growing participation in sports and outdoor activities, favorable government policies.
- Dominant Application Segment: Sportswear, followed by Apparel and protective wear.
- Dominant Fabric Type: Knitted fabrics, due to their comfort and breathability.
- Dominant Material Type: Synthetic fabrics are currently dominating the market due to their better performance characteristics compared to natural fabrics. However, natural fabrics are seeing a rise due to increasing demand for environmentally sustainable materials.
Cooling Fabrics Industry Product Innovations
Recent innovations include the incorporation of phase-change materials (PCMs) for enhanced temperature regulation, the development of bio-based and recycled fibers for sustainability, and the use of advanced weaving and knitting techniques to improve fabric breathability and moisture-wicking capabilities. These advancements result in fabrics with superior comfort, performance, and reduced environmental impact, enabling unique selling propositions like increased athletic performance and sustained comfort in various climate conditions.
Propelling Factors for Cooling Fabrics Industry Growth
Several factors are propelling growth in this market. Technological advancements in material science are leading to the development of more effective and sustainable cooling fabrics. The rising popularity of athleisure and outdoor activities is fueling demand for comfortable and performance-enhancing apparel. Government regulations promoting sustainable manufacturing practices are encouraging the adoption of eco-friendly materials. Economic growth, especially in emerging economies, is increasing consumer purchasing power.
Obstacles in the Cooling Fabrics Industry Market
Significant challenges remain. Supply chain disruptions due to geopolitical instability and pandemics can impact production and pricing. Stringent environmental regulations can increase manufacturing costs. Intense competition among existing players and the emergence of new entrants exert pressure on profit margins.
Future Opportunities in Cooling Fabrics Industry
Future opportunities lie in the development of personalized cooling apparel using smart textiles and wearable sensors, expansion into niche markets such as medical and healthcare, and further innovation in sustainable and recyclable materials. Increasing demand for sustainable and ethically sourced materials offers great growth potential. Moreover, integrating advanced technologies such as antimicrobial properties and UV protection enhances the fabric's overall value proposition.
Major Players in the Cooling Fabrics Industry Ecosystem
- Everest Textile Co Ltd
- Asahi Kasei Corporation
- HeiQ Materials AG
- Polartec
- Columbia Sportswear Company
- Formosa Taffeta Co Ltd
- NILIT
- Coolcore
- NAN YA PLASTICS CORPORATION
- Burlington
- Wilson Fabrics
- Balavigna Weaving Mills Pvt Ltd
Key Developments in Cooling Fabrics Industry Industry
- January 2023: NILIT launched a new version of SENSIL EcoCare recycled Nylon 6.6 manufactured completely from US materials. This development highlights the growing focus on sustainability and local sourcing within the industry.
- March 2023: NILIT earned the ISCC+ accreditation for its SENSIL ByNature brand. This certification underscores the increasing importance of sustainability certifications and their influence on consumer preferences and market access.
Strategic Cooling Fabrics Industry Market Forecast
The cooling fabrics market is poised for continued growth, driven by technological advancements, increasing consumer awareness, and a growing focus on sustainability. New applications in medical and protective wear, coupled with innovations in material science and manufacturing processes, will further expand market potential. The market is projected to maintain a strong growth trajectory throughout the forecast period, reaching significant market value within the next decade.
Cooling Fabrics Industry Segmentation
-
1. Type
- 1.1. Natural
- 1.2. Synthetic
-
2. Fabric Type
- 2.1. Woven
- 2.2. Non-woven
- 2.3. Knitted
-
3. Application
- 3.1. Sportswear
- 3.2. Protective Wear
- 3.3. Apparels
- 3.4. Others (Medical, etc.)
Cooling Fabrics Industry Segmentation By Geography
-
1. Asia Pacific
- 1.1. China
- 1.2. India
- 1.3. Japan
- 1.4. South Korea
- 1.5. Rest of Asia Pacific
-
2. North America
- 2.1. United States
- 2.2. Canada
- 2.3. Mexico
-
3. Europe
- 3.1. Germany
- 3.2. United Kingdom
- 3.3. Italy
- 3.4. France
- 3.5. Rest of Europe
-
4. South America
- 4.1. Brazil
- 4.2. Argentina
- 4.3. Rest of South America
-
5. Middle East and Africa
- 5.1. Saudi Arabia
- 5.2. South Africa
- 5.3. Rest of Middle East and Africa
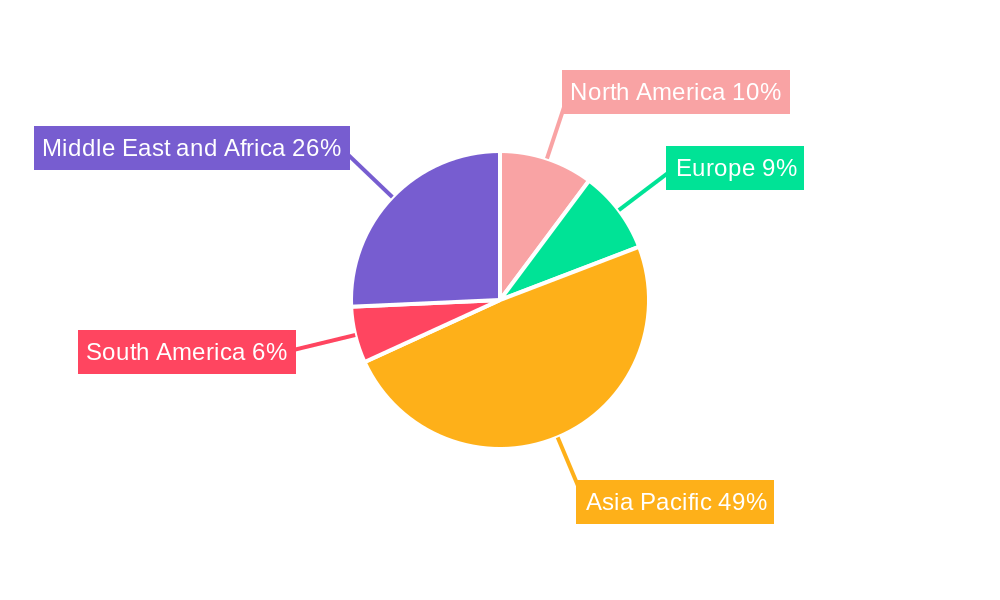
Cooling Fabrics Industry Regional Market Share
Geographic Coverage of Cooling Fabrics Industry
Cooling Fabrics Industry REPORT HIGHLIGHTS
| Aspects | Details |
|---|---|
| Study Period | 2020-2034 |
| Base Year | 2025 |
| Estimated Year | 2026 |
| Forecast Period | 2026-2034 |
| Historical Period | 2020-2025 |
| Growth Rate | CAGR of 7.21% from 2020-2034 |
| Segmentation |
|
Table of Contents
- 1. Introduction
- 1.1. Research Scope
- 1.2. Market Segmentation
- 1.3. Research Methodology
- 1.4. Definitions and Assumptions
- 2. Executive Summary
- 2.1. Introduction
- 3. Market Dynamics
- 3.1. Introduction
- 3.2. Market Drivers
- 3.2.1. Growing Demand for Synthetic Fabrics; Increasing Demand for Sportwear Fabrics; Other Drivers
- 3.3. Market Restrains
- 3.3.1. High Cost of Cooling Fabrics; Other Restraints
- 3.4. Market Trends
- 3.4.1. Increasing Demand from Sportswear Application
- 4. Market Factor Analysis
- 4.1. Porters Five Forces
- 4.2. Supply/Value Chain
- 4.3. PESTEL analysis
- 4.4. Market Entropy
- 4.5. Patent/Trademark Analysis
- 5. Global Cooling Fabrics Industry Analysis, Insights and Forecast, 2020-2032
- 5.1. Market Analysis, Insights and Forecast - by Type
- 5.1.1. Natural
- 5.1.2. Synthetic
- 5.2. Market Analysis, Insights and Forecast - by Fabric Type
- 5.2.1. Woven
- 5.2.2. Non-woven
- 5.2.3. Knitted
- 5.3. Market Analysis, Insights and Forecast - by Application
- 5.3.1. Sportswear
- 5.3.2. Protective Wear
- 5.3.3. Apparels
- 5.3.4. Others (Medical, etc.)
- 5.4. Market Analysis, Insights and Forecast - by Region
- 5.4.1. Asia Pacific
- 5.4.2. North America
- 5.4.3. Europe
- 5.4.4. South America
- 5.4.5. Middle East and Africa
- 5.1. Market Analysis, Insights and Forecast - by Type
- 6. Asia Pacific Cooling Fabrics Industry Analysis, Insights and Forecast, 2020-2032
- 6.1. Market Analysis, Insights and Forecast - by Type
- 6.1.1. Natural
- 6.1.2. Synthetic
- 6.2. Market Analysis, Insights and Forecast - by Fabric Type
- 6.2.1. Woven
- 6.2.2. Non-woven
- 6.2.3. Knitted
- 6.3. Market Analysis, Insights and Forecast - by Application
- 6.3.1. Sportswear
- 6.3.2. Protective Wear
- 6.3.3. Apparels
- 6.3.4. Others (Medical, etc.)
- 6.1. Market Analysis, Insights and Forecast - by Type
- 7. North America Cooling Fabrics Industry Analysis, Insights and Forecast, 2020-2032
- 7.1. Market Analysis, Insights and Forecast - by Type
- 7.1.1. Natural
- 7.1.2. Synthetic
- 7.2. Market Analysis, Insights and Forecast - by Fabric Type
- 7.2.1. Woven
- 7.2.2. Non-woven
- 7.2.3. Knitted
- 7.3. Market Analysis, Insights and Forecast - by Application
- 7.3.1. Sportswear
- 7.3.2. Protective Wear
- 7.3.3. Apparels
- 7.3.4. Others (Medical, etc.)
- 7.1. Market Analysis, Insights and Forecast - by Type
- 8. Europe Cooling Fabrics Industry Analysis, Insights and Forecast, 2020-2032
- 8.1. Market Analysis, Insights and Forecast - by Type
- 8.1.1. Natural
- 8.1.2. Synthetic
- 8.2. Market Analysis, Insights and Forecast - by Fabric Type
- 8.2.1. Woven
- 8.2.2. Non-woven
- 8.2.3. Knitted
- 8.3. Market Analysis, Insights and Forecast - by Application
- 8.3.1. Sportswear
- 8.3.2. Protective Wear
- 8.3.3. Apparels
- 8.3.4. Others (Medical, etc.)
- 8.1. Market Analysis, Insights and Forecast - by Type
- 9. South America Cooling Fabrics Industry Analysis, Insights and Forecast, 2020-2032
- 9.1. Market Analysis, Insights and Forecast - by Type
- 9.1.1. Natural
- 9.1.2. Synthetic
- 9.2. Market Analysis, Insights and Forecast - by Fabric Type
- 9.2.1. Woven
- 9.2.2. Non-woven
- 9.2.3. Knitted
- 9.3. Market Analysis, Insights and Forecast - by Application
- 9.3.1. Sportswear
- 9.3.2. Protective Wear
- 9.3.3. Apparels
- 9.3.4. Others (Medical, etc.)
- 9.1. Market Analysis, Insights and Forecast - by Type
- 10. Middle East and Africa Cooling Fabrics Industry Analysis, Insights and Forecast, 2020-2032
- 10.1. Market Analysis, Insights and Forecast - by Type
- 10.1.1. Natural
- 10.1.2. Synthetic
- 10.2. Market Analysis, Insights and Forecast - by Fabric Type
- 10.2.1. Woven
- 10.2.2. Non-woven
- 10.2.3. Knitted
- 10.3. Market Analysis, Insights and Forecast - by Application
- 10.3.1. Sportswear
- 10.3.2. Protective Wear
- 10.3.3. Apparels
- 10.3.4. Others (Medical, etc.)
- 10.1. Market Analysis, Insights and Forecast - by Type
- 11. Competitive Analysis
- 11.1. Global Market Share Analysis 2025
- 11.2. Company Profiles
- 11.2.1 Everest Textile Co Ltd
- 11.2.1.1. Overview
- 11.2.1.2. Products
- 11.2.1.3. SWOT Analysis
- 11.2.1.4. Recent Developments
- 11.2.1.5. Financials (Based on Availability)
- 11.2.2 Asahi Kasei Corporation
- 11.2.2.1. Overview
- 11.2.2.2. Products
- 11.2.2.3. SWOT Analysis
- 11.2.2.4. Recent Developments
- 11.2.2.5. Financials (Based on Availability)
- 11.2.3 HeiQ Materials AG
- 11.2.3.1. Overview
- 11.2.3.2. Products
- 11.2.3.3. SWOT Analysis
- 11.2.3.4. Recent Developments
- 11.2.3.5. Financials (Based on Availability)
- 11.2.4 Polartec
- 11.2.4.1. Overview
- 11.2.4.2. Products
- 11.2.4.3. SWOT Analysis
- 11.2.4.4. Recent Developments
- 11.2.4.5. Financials (Based on Availability)
- 11.2.5 Columbia Sportswear Company
- 11.2.5.1. Overview
- 11.2.5.2. Products
- 11.2.5.3. SWOT Analysis
- 11.2.5.4. Recent Developments
- 11.2.5.5. Financials (Based on Availability)
- 11.2.6 Formosa Taffeta Co Ltd
- 11.2.6.1. Overview
- 11.2.6.2. Products
- 11.2.6.3. SWOT Analysis
- 11.2.6.4. Recent Developments
- 11.2.6.5. Financials (Based on Availability)
- 11.2.7 NILIT
- 11.2.7.1. Overview
- 11.2.7.2. Products
- 11.2.7.3. SWOT Analysis
- 11.2.7.4. Recent Developments
- 11.2.7.5. Financials (Based on Availability)
- 11.2.8 Coolcore
- 11.2.8.1. Overview
- 11.2.8.2. Products
- 11.2.8.3. SWOT Analysis
- 11.2.8.4. Recent Developments
- 11.2.8.5. Financials (Based on Availability)
- 11.2.9 NAN YA PLASTICS CORPORATION
- 11.2.9.1. Overview
- 11.2.9.2. Products
- 11.2.9.3. SWOT Analysis
- 11.2.9.4. Recent Developments
- 11.2.9.5. Financials (Based on Availability)
- 11.2.10 Burlington
- 11.2.10.1. Overview
- 11.2.10.2. Products
- 11.2.10.3. SWOT Analysis
- 11.2.10.4. Recent Developments
- 11.2.10.5. Financials (Based on Availability)
- 11.2.11 Wilson Fabrics
- 11.2.11.1. Overview
- 11.2.11.2. Products
- 11.2.11.3. SWOT Analysis
- 11.2.11.4. Recent Developments
- 11.2.11.5. Financials (Based on Availability)
- 11.2.12 Balavigna Weaving Mills Pvt Ltd
- 11.2.12.1. Overview
- 11.2.12.2. Products
- 11.2.12.3. SWOT Analysis
- 11.2.12.4. Recent Developments
- 11.2.12.5. Financials (Based on Availability)
- 11.2.1 Everest Textile Co Ltd
List of Figures
- Figure 1: Global Cooling Fabrics Industry Revenue Breakdown (Million, %) by Region 2025 & 2033
- Figure 2: Global Cooling Fabrics Industry Volume Breakdown (K Tons, %) by Region 2025 & 2033
- Figure 3: Asia Pacific Cooling Fabrics Industry Revenue (Million), by Type 2025 & 2033
- Figure 4: Asia Pacific Cooling Fabrics Industry Volume (K Tons), by Type 2025 & 2033
- Figure 5: Asia Pacific Cooling Fabrics Industry Revenue Share (%), by Type 2025 & 2033
- Figure 6: Asia Pacific Cooling Fabrics Industry Volume Share (%), by Type 2025 & 2033
- Figure 7: Asia Pacific Cooling Fabrics Industry Revenue (Million), by Fabric Type 2025 & 2033
- Figure 8: Asia Pacific Cooling Fabrics Industry Volume (K Tons), by Fabric Type 2025 & 2033
- Figure 9: Asia Pacific Cooling Fabrics Industry Revenue Share (%), by Fabric Type 2025 & 2033
- Figure 10: Asia Pacific Cooling Fabrics Industry Volume Share (%), by Fabric Type 2025 & 2033
- Figure 11: Asia Pacific Cooling Fabrics Industry Revenue (Million), by Application 2025 & 2033
- Figure 12: Asia Pacific Cooling Fabrics Industry Volume (K Tons), by Application 2025 & 2033
- Figure 13: Asia Pacific Cooling Fabrics Industry Revenue Share (%), by Application 2025 & 2033
- Figure 14: Asia Pacific Cooling Fabrics Industry Volume Share (%), by Application 2025 & 2033
- Figure 15: Asia Pacific Cooling Fabrics Industry Revenue (Million), by Country 2025 & 2033
- Figure 16: Asia Pacific Cooling Fabrics Industry Volume (K Tons), by Country 2025 & 2033
- Figure 17: Asia Pacific Cooling Fabrics Industry Revenue Share (%), by Country 2025 & 2033
- Figure 18: Asia Pacific Cooling Fabrics Industry Volume Share (%), by Country 2025 & 2033
- Figure 19: North America Cooling Fabrics Industry Revenue (Million), by Type 2025 & 2033
- Figure 20: North America Cooling Fabrics Industry Volume (K Tons), by Type 2025 & 2033
- Figure 21: North America Cooling Fabrics Industry Revenue Share (%), by Type 2025 & 2033
- Figure 22: North America Cooling Fabrics Industry Volume Share (%), by Type 2025 & 2033
- Figure 23: North America Cooling Fabrics Industry Revenue (Million), by Fabric Type 2025 & 2033
- Figure 24: North America Cooling Fabrics Industry Volume (K Tons), by Fabric Type 2025 & 2033
- Figure 25: North America Cooling Fabrics Industry Revenue Share (%), by Fabric Type 2025 & 2033
- Figure 26: North America Cooling Fabrics Industry Volume Share (%), by Fabric Type 2025 & 2033
- Figure 27: North America Cooling Fabrics Industry Revenue (Million), by Application 2025 & 2033
- Figure 28: North America Cooling Fabrics Industry Volume (K Tons), by Application 2025 & 2033
- Figure 29: North America Cooling Fabrics Industry Revenue Share (%), by Application 2025 & 2033
- Figure 30: North America Cooling Fabrics Industry Volume Share (%), by Application 2025 & 2033
- Figure 31: North America Cooling Fabrics Industry Revenue (Million), by Country 2025 & 2033
- Figure 32: North America Cooling Fabrics Industry Volume (K Tons), by Country 2025 & 2033
- Figure 33: North America Cooling Fabrics Industry Revenue Share (%), by Country 2025 & 2033
- Figure 34: North America Cooling Fabrics Industry Volume Share (%), by Country 2025 & 2033
- Figure 35: Europe Cooling Fabrics Industry Revenue (Million), by Type 2025 & 2033
- Figure 36: Europe Cooling Fabrics Industry Volume (K Tons), by Type 2025 & 2033
- Figure 37: Europe Cooling Fabrics Industry Revenue Share (%), by Type 2025 & 2033
- Figure 38: Europe Cooling Fabrics Industry Volume Share (%), by Type 2025 & 2033
- Figure 39: Europe Cooling Fabrics Industry Revenue (Million), by Fabric Type 2025 & 2033
- Figure 40: Europe Cooling Fabrics Industry Volume (K Tons), by Fabric Type 2025 & 2033
- Figure 41: Europe Cooling Fabrics Industry Revenue Share (%), by Fabric Type 2025 & 2033
- Figure 42: Europe Cooling Fabrics Industry Volume Share (%), by Fabric Type 2025 & 2033
- Figure 43: Europe Cooling Fabrics Industry Revenue (Million), by Application 2025 & 2033
- Figure 44: Europe Cooling Fabrics Industry Volume (K Tons), by Application 2025 & 2033
- Figure 45: Europe Cooling Fabrics Industry Revenue Share (%), by Application 2025 & 2033
- Figure 46: Europe Cooling Fabrics Industry Volume Share (%), by Application 2025 & 2033
- Figure 47: Europe Cooling Fabrics Industry Revenue (Million), by Country 2025 & 2033
- Figure 48: Europe Cooling Fabrics Industry Volume (K Tons), by Country 2025 & 2033
- Figure 49: Europe Cooling Fabrics Industry Revenue Share (%), by Country 2025 & 2033
- Figure 50: Europe Cooling Fabrics Industry Volume Share (%), by Country 2025 & 2033
- Figure 51: South America Cooling Fabrics Industry Revenue (Million), by Type 2025 & 2033
- Figure 52: South America Cooling Fabrics Industry Volume (K Tons), by Type 2025 & 2033
- Figure 53: South America Cooling Fabrics Industry Revenue Share (%), by Type 2025 & 2033
- Figure 54: South America Cooling Fabrics Industry Volume Share (%), by Type 2025 & 2033
- Figure 55: South America Cooling Fabrics Industry Revenue (Million), by Fabric Type 2025 & 2033
- Figure 56: South America Cooling Fabrics Industry Volume (K Tons), by Fabric Type 2025 & 2033
- Figure 57: South America Cooling Fabrics Industry Revenue Share (%), by Fabric Type 2025 & 2033
- Figure 58: South America Cooling Fabrics Industry Volume Share (%), by Fabric Type 2025 & 2033
- Figure 59: South America Cooling Fabrics Industry Revenue (Million), by Application 2025 & 2033
- Figure 60: South America Cooling Fabrics Industry Volume (K Tons), by Application 2025 & 2033
- Figure 61: South America Cooling Fabrics Industry Revenue Share (%), by Application 2025 & 2033
- Figure 62: South America Cooling Fabrics Industry Volume Share (%), by Application 2025 & 2033
- Figure 63: South America Cooling Fabrics Industry Revenue (Million), by Country 2025 & 2033
- Figure 64: South America Cooling Fabrics Industry Volume (K Tons), by Country 2025 & 2033
- Figure 65: South America Cooling Fabrics Industry Revenue Share (%), by Country 2025 & 2033
- Figure 66: South America Cooling Fabrics Industry Volume Share (%), by Country 2025 & 2033
- Figure 67: Middle East and Africa Cooling Fabrics Industry Revenue (Million), by Type 2025 & 2033
- Figure 68: Middle East and Africa Cooling Fabrics Industry Volume (K Tons), by Type 2025 & 2033
- Figure 69: Middle East and Africa Cooling Fabrics Industry Revenue Share (%), by Type 2025 & 2033
- Figure 70: Middle East and Africa Cooling Fabrics Industry Volume Share (%), by Type 2025 & 2033
- Figure 71: Middle East and Africa Cooling Fabrics Industry Revenue (Million), by Fabric Type 2025 & 2033
- Figure 72: Middle East and Africa Cooling Fabrics Industry Volume (K Tons), by Fabric Type 2025 & 2033
- Figure 73: Middle East and Africa Cooling Fabrics Industry Revenue Share (%), by Fabric Type 2025 & 2033
- Figure 74: Middle East and Africa Cooling Fabrics Industry Volume Share (%), by Fabric Type 2025 & 2033
- Figure 75: Middle East and Africa Cooling Fabrics Industry Revenue (Million), by Application 2025 & 2033
- Figure 76: Middle East and Africa Cooling Fabrics Industry Volume (K Tons), by Application 2025 & 2033
- Figure 77: Middle East and Africa Cooling Fabrics Industry Revenue Share (%), by Application 2025 & 2033
- Figure 78: Middle East and Africa Cooling Fabrics Industry Volume Share (%), by Application 2025 & 2033
- Figure 79: Middle East and Africa Cooling Fabrics Industry Revenue (Million), by Country 2025 & 2033
- Figure 80: Middle East and Africa Cooling Fabrics Industry Volume (K Tons), by Country 2025 & 2033
- Figure 81: Middle East and Africa Cooling Fabrics Industry Revenue Share (%), by Country 2025 & 2033
- Figure 82: Middle East and Africa Cooling Fabrics Industry Volume Share (%), by Country 2025 & 2033
List of Tables
- Table 1: Global Cooling Fabrics Industry Revenue Million Forecast, by Type 2020 & 2033
- Table 2: Global Cooling Fabrics Industry Volume K Tons Forecast, by Type 2020 & 2033
- Table 3: Global Cooling Fabrics Industry Revenue Million Forecast, by Fabric Type 2020 & 2033
- Table 4: Global Cooling Fabrics Industry Volume K Tons Forecast, by Fabric Type 2020 & 2033
- Table 5: Global Cooling Fabrics Industry Revenue Million Forecast, by Application 2020 & 2033
- Table 6: Global Cooling Fabrics Industry Volume K Tons Forecast, by Application 2020 & 2033
- Table 7: Global Cooling Fabrics Industry Revenue Million Forecast, by Region 2020 & 2033
- Table 8: Global Cooling Fabrics Industry Volume K Tons Forecast, by Region 2020 & 2033
- Table 9: Global Cooling Fabrics Industry Revenue Million Forecast, by Type 2020 & 2033
- Table 10: Global Cooling Fabrics Industry Volume K Tons Forecast, by Type 2020 & 2033
- Table 11: Global Cooling Fabrics Industry Revenue Million Forecast, by Fabric Type 2020 & 2033
- Table 12: Global Cooling Fabrics Industry Volume K Tons Forecast, by Fabric Type 2020 & 2033
- Table 13: Global Cooling Fabrics Industry Revenue Million Forecast, by Application 2020 & 2033
- Table 14: Global Cooling Fabrics Industry Volume K Tons Forecast, by Application 2020 & 2033
- Table 15: Global Cooling Fabrics Industry Revenue Million Forecast, by Country 2020 & 2033
- Table 16: Global Cooling Fabrics Industry Volume K Tons Forecast, by Country 2020 & 2033
- Table 17: China Cooling Fabrics Industry Revenue (Million) Forecast, by Application 2020 & 2033
- Table 18: China Cooling Fabrics Industry Volume (K Tons) Forecast, by Application 2020 & 2033
- Table 19: India Cooling Fabrics Industry Revenue (Million) Forecast, by Application 2020 & 2033
- Table 20: India Cooling Fabrics Industry Volume (K Tons) Forecast, by Application 2020 & 2033
- Table 21: Japan Cooling Fabrics Industry Revenue (Million) Forecast, by Application 2020 & 2033
- Table 22: Japan Cooling Fabrics Industry Volume (K Tons) Forecast, by Application 2020 & 2033
- Table 23: South Korea Cooling Fabrics Industry Revenue (Million) Forecast, by Application 2020 & 2033
- Table 24: South Korea Cooling Fabrics Industry Volume (K Tons) Forecast, by Application 2020 & 2033
- Table 25: Rest of Asia Pacific Cooling Fabrics Industry Revenue (Million) Forecast, by Application 2020 & 2033
- Table 26: Rest of Asia Pacific Cooling Fabrics Industry Volume (K Tons) Forecast, by Application 2020 & 2033
- Table 27: Global Cooling Fabrics Industry Revenue Million Forecast, by Type 2020 & 2033
- Table 28: Global Cooling Fabrics Industry Volume K Tons Forecast, by Type 2020 & 2033
- Table 29: Global Cooling Fabrics Industry Revenue Million Forecast, by Fabric Type 2020 & 2033
- Table 30: Global Cooling Fabrics Industry Volume K Tons Forecast, by Fabric Type 2020 & 2033
- Table 31: Global Cooling Fabrics Industry Revenue Million Forecast, by Application 2020 & 2033
- Table 32: Global Cooling Fabrics Industry Volume K Tons Forecast, by Application 2020 & 2033
- Table 33: Global Cooling Fabrics Industry Revenue Million Forecast, by Country 2020 & 2033
- Table 34: Global Cooling Fabrics Industry Volume K Tons Forecast, by Country 2020 & 2033
- Table 35: United States Cooling Fabrics Industry Revenue (Million) Forecast, by Application 2020 & 2033
- Table 36: United States Cooling Fabrics Industry Volume (K Tons) Forecast, by Application 2020 & 2033
- Table 37: Canada Cooling Fabrics Industry Revenue (Million) Forecast, by Application 2020 & 2033
- Table 38: Canada Cooling Fabrics Industry Volume (K Tons) Forecast, by Application 2020 & 2033
- Table 39: Mexico Cooling Fabrics Industry Revenue (Million) Forecast, by Application 2020 & 2033
- Table 40: Mexico Cooling Fabrics Industry Volume (K Tons) Forecast, by Application 2020 & 2033
- Table 41: Global Cooling Fabrics Industry Revenue Million Forecast, by Type 2020 & 2033
- Table 42: Global Cooling Fabrics Industry Volume K Tons Forecast, by Type 2020 & 2033
- Table 43: Global Cooling Fabrics Industry Revenue Million Forecast, by Fabric Type 2020 & 2033
- Table 44: Global Cooling Fabrics Industry Volume K Tons Forecast, by Fabric Type 2020 & 2033
- Table 45: Global Cooling Fabrics Industry Revenue Million Forecast, by Application 2020 & 2033
- Table 46: Global Cooling Fabrics Industry Volume K Tons Forecast, by Application 2020 & 2033
- Table 47: Global Cooling Fabrics Industry Revenue Million Forecast, by Country 2020 & 2033
- Table 48: Global Cooling Fabrics Industry Volume K Tons Forecast, by Country 2020 & 2033
- Table 49: Germany Cooling Fabrics Industry Revenue (Million) Forecast, by Application 2020 & 2033
- Table 50: Germany Cooling Fabrics Industry Volume (K Tons) Forecast, by Application 2020 & 2033
- Table 51: United Kingdom Cooling Fabrics Industry Revenue (Million) Forecast, by Application 2020 & 2033
- Table 52: United Kingdom Cooling Fabrics Industry Volume (K Tons) Forecast, by Application 2020 & 2033
- Table 53: Italy Cooling Fabrics Industry Revenue (Million) Forecast, by Application 2020 & 2033
- Table 54: Italy Cooling Fabrics Industry Volume (K Tons) Forecast, by Application 2020 & 2033
- Table 55: France Cooling Fabrics Industry Revenue (Million) Forecast, by Application 2020 & 2033
- Table 56: France Cooling Fabrics Industry Volume (K Tons) Forecast, by Application 2020 & 2033
- Table 57: Rest of Europe Cooling Fabrics Industry Revenue (Million) Forecast, by Application 2020 & 2033
- Table 58: Rest of Europe Cooling Fabrics Industry Volume (K Tons) Forecast, by Application 2020 & 2033
- Table 59: Global Cooling Fabrics Industry Revenue Million Forecast, by Type 2020 & 2033
- Table 60: Global Cooling Fabrics Industry Volume K Tons Forecast, by Type 2020 & 2033
- Table 61: Global Cooling Fabrics Industry Revenue Million Forecast, by Fabric Type 2020 & 2033
- Table 62: Global Cooling Fabrics Industry Volume K Tons Forecast, by Fabric Type 2020 & 2033
- Table 63: Global Cooling Fabrics Industry Revenue Million Forecast, by Application 2020 & 2033
- Table 64: Global Cooling Fabrics Industry Volume K Tons Forecast, by Application 2020 & 2033
- Table 65: Global Cooling Fabrics Industry Revenue Million Forecast, by Country 2020 & 2033
- Table 66: Global Cooling Fabrics Industry Volume K Tons Forecast, by Country 2020 & 2033
- Table 67: Brazil Cooling Fabrics Industry Revenue (Million) Forecast, by Application 2020 & 2033
- Table 68: Brazil Cooling Fabrics Industry Volume (K Tons) Forecast, by Application 2020 & 2033
- Table 69: Argentina Cooling Fabrics Industry Revenue (Million) Forecast, by Application 2020 & 2033
- Table 70: Argentina Cooling Fabrics Industry Volume (K Tons) Forecast, by Application 2020 & 2033
- Table 71: Rest of South America Cooling Fabrics Industry Revenue (Million) Forecast, by Application 2020 & 2033
- Table 72: Rest of South America Cooling Fabrics Industry Volume (K Tons) Forecast, by Application 2020 & 2033
- Table 73: Global Cooling Fabrics Industry Revenue Million Forecast, by Type 2020 & 2033
- Table 74: Global Cooling Fabrics Industry Volume K Tons Forecast, by Type 2020 & 2033
- Table 75: Global Cooling Fabrics Industry Revenue Million Forecast, by Fabric Type 2020 & 2033
- Table 76: Global Cooling Fabrics Industry Volume K Tons Forecast, by Fabric Type 2020 & 2033
- Table 77: Global Cooling Fabrics Industry Revenue Million Forecast, by Application 2020 & 2033
- Table 78: Global Cooling Fabrics Industry Volume K Tons Forecast, by Application 2020 & 2033
- Table 79: Global Cooling Fabrics Industry Revenue Million Forecast, by Country 2020 & 2033
- Table 80: Global Cooling Fabrics Industry Volume K Tons Forecast, by Country 2020 & 2033
- Table 81: Saudi Arabia Cooling Fabrics Industry Revenue (Million) Forecast, by Application 2020 & 2033
- Table 82: Saudi Arabia Cooling Fabrics Industry Volume (K Tons) Forecast, by Application 2020 & 2033
- Table 83: South Africa Cooling Fabrics Industry Revenue (Million) Forecast, by Application 2020 & 2033
- Table 84: South Africa Cooling Fabrics Industry Volume (K Tons) Forecast, by Application 2020 & 2033
- Table 85: Rest of Middle East and Africa Cooling Fabrics Industry Revenue (Million) Forecast, by Application 2020 & 2033
- Table 86: Rest of Middle East and Africa Cooling Fabrics Industry Volume (K Tons) Forecast, by Application 2020 & 2033
Frequently Asked Questions
1. What is the projected Compound Annual Growth Rate (CAGR) of the Cooling Fabrics Industry?
The projected CAGR is approximately 7.21%.
2. Which companies are prominent players in the Cooling Fabrics Industry?
Key companies in the market include Everest Textile Co Ltd, Asahi Kasei Corporation, HeiQ Materials AG, Polartec, Columbia Sportswear Company, Formosa Taffeta Co Ltd, NILIT, Coolcore, NAN YA PLASTICS CORPORATION, Burlington, Wilson Fabrics, Balavigna Weaving Mills Pvt Ltd.
3. What are the main segments of the Cooling Fabrics Industry?
The market segments include Type, Fabric Type, Application.
4. Can you provide details about the market size?
The market size is estimated to be USD 2.42 Million as of 2022.
5. What are some drivers contributing to market growth?
Growing Demand for Synthetic Fabrics; Increasing Demand for Sportwear Fabrics; Other Drivers.
6. What are the notable trends driving market growth?
Increasing Demand from Sportswear Application.
7. Are there any restraints impacting market growth?
High Cost of Cooling Fabrics; Other Restraints.
8. Can you provide examples of recent developments in the market?
January 2023: NILIT launched a new version of SENSIL EcoCare recycled Nylon 6.6 manufactured completely from US materials at its North American facility in Martinsville, VA.
9. What pricing options are available for accessing the report?
Pricing options include single-user, multi-user, and enterprise licenses priced at USD 4750, USD 5250, and USD 8750 respectively.
10. Is the market size provided in terms of value or volume?
The market size is provided in terms of value, measured in Million and volume, measured in K Tons.
11. Are there any specific market keywords associated with the report?
Yes, the market keyword associated with the report is "Cooling Fabrics Industry," which aids in identifying and referencing the specific market segment covered.
12. How do I determine which pricing option suits my needs best?
The pricing options vary based on user requirements and access needs. Individual users may opt for single-user licenses, while businesses requiring broader access may choose multi-user or enterprise licenses for cost-effective access to the report.
13. Are there any additional resources or data provided in the Cooling Fabrics Industry report?
While the report offers comprehensive insights, it's advisable to review the specific contents or supplementary materials provided to ascertain if additional resources or data are available.
14. How can I stay updated on further developments or reports in the Cooling Fabrics Industry?
To stay informed about further developments, trends, and reports in the Cooling Fabrics Industry, consider subscribing to industry newsletters, following relevant companies and organizations, or regularly checking reputable industry news sources and publications.
Methodology
Step 1 - Identification of Relevant Samples Size from Population Database


Step 2 - Approaches for Defining Global Market Size (Value, Volume* & Price*)

Note*: In applicable scenarios
Step 3 - Data Sources
Primary Research
- Web Analytics
- Survey Reports
- Research Institute
- Latest Research Reports
- Opinion Leaders
Secondary Research
- Annual Reports
- White Paper
- Latest Press Release
- Industry Association
- Paid Database
- Investor Presentations

Step 4 - Data Triangulation
Involves using different sources of information in order to increase the validity of a study
These sources are likely to be stakeholders in a program - participants, other researchers, program staff, other community members, and so on.
Then we put all data in single framework & apply various statistical tools to find out the dynamic on the market.
During the analysis stage, feedback from the stakeholder groups would be compared to determine areas of agreement as well as areas of divergence