

Key Insights
The RF Power Semiconductor market is experiencing robust growth, projected to reach a substantial size by 2033, driven by the increasing demand for high-frequency and high-power applications across various sectors. A Compound Annual Growth Rate (CAGR) of 13.25% from 2019 to 2024 indicates a significant upward trajectory. Key growth drivers include the expansion of 5G telecom infrastructure necessitating efficient and powerful amplifiers, the burgeoning aerospace and defense industry's need for advanced radar and communication systems, and the rising adoption of wired broadband and satellite communication technologies. Furthermore, the electrification of vehicles and the growth of RF energy harvesting applications in the automotive sector contribute significantly to market expansion. Technological advancements in GaN and GaAs semiconductors offer higher efficiency and power density compared to traditional LDMOS, further fueling market growth.
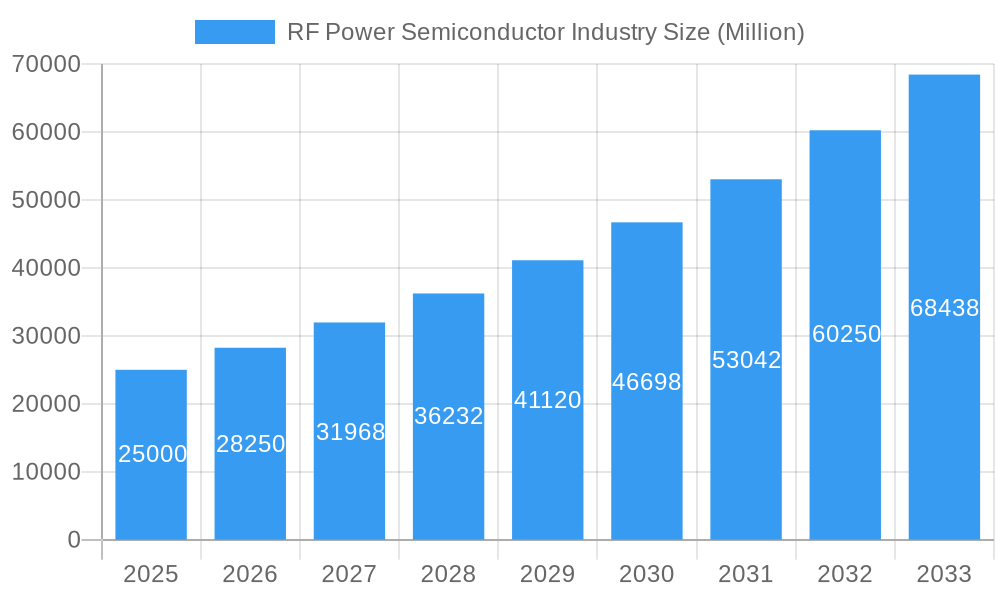
RF Power Semiconductor Industry Market Size (In Billion)
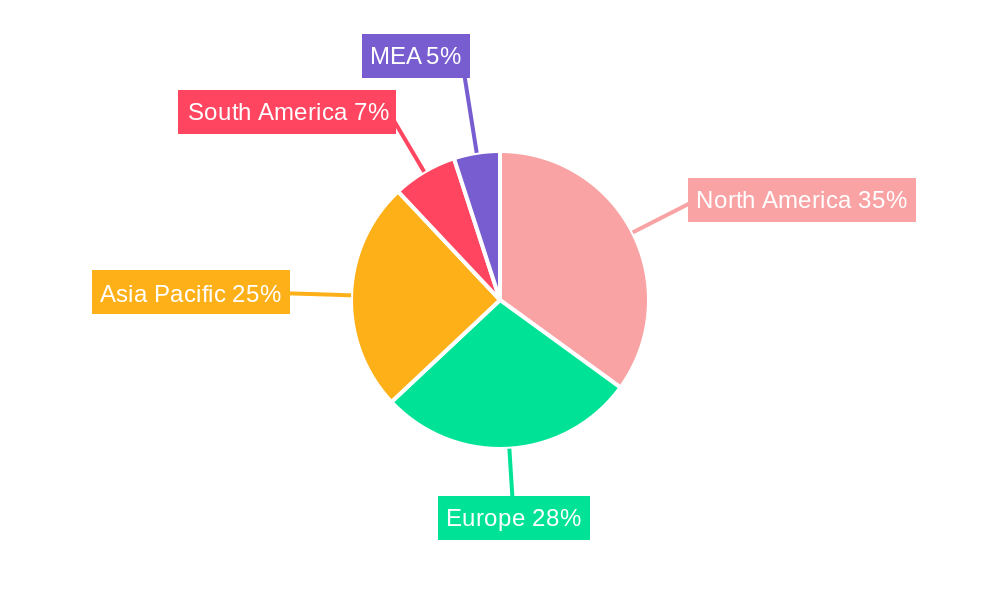
Segment-wise, the telecom infrastructure segment holds a dominant position, accounting for a considerable portion of the market share, followed by aerospace and defense, and wired broadband. However, the RF energy (automotive) segment is poised for rapid expansion, given the accelerating adoption of electric and hybrid vehicles. Geographically, North America and Asia Pacific are currently the leading markets, driven by strong technological advancements and substantial investments in infrastructure. However, emerging economies in regions like South America and MEA are showing significant potential for future growth, contributing to the overall market expansion. The competitive landscape is characterized by established players like NXP Semiconductors, Cree, and STMicroelectronics, alongside emerging companies specializing in niche applications. Continuous innovation in materials science and device architecture will remain crucial in shaping the future of this dynamic market.
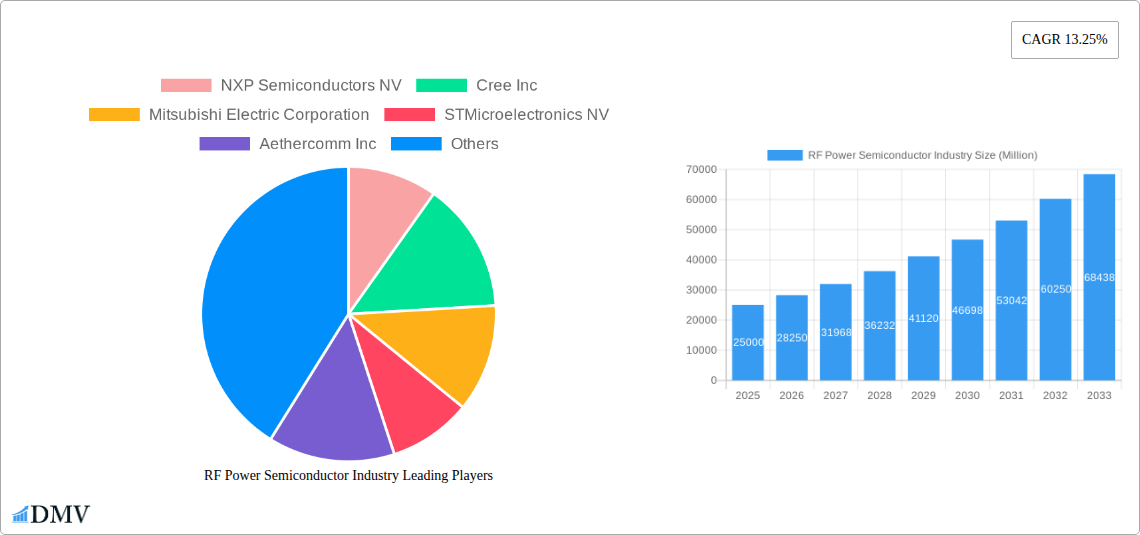
RF Power Semiconductor Industry Company Market Share
RF Power Semiconductor Industry Market Report: 2019-2033
This comprehensive report provides a detailed analysis of the RF Power Semiconductor industry, encompassing market trends, technological advancements, leading players, and future growth prospects. Covering the period from 2019 to 2033, with a base year of 2025 and a forecast period extending to 2033, this report offers crucial insights for stakeholders seeking to navigate this dynamic sector. The market is valued at xx Million in 2025 and is projected to reach xx Million by 2033.
RF Power Semiconductor Industry Market Composition & Trends
The RF Power Semiconductor market is characterized by a moderately consolidated landscape, with key players like NXP Semiconductors NV, Cree Inc, Mitsubishi Electric Corporation, STMicroelectronics NV, and Qorvo Inc holding significant market share. Market share distribution in 2025 is estimated as follows: NXP Semiconductors NV (15%), STMicroelectronics NV (12%), Qorvo Inc (10%), and others (63%). Innovation is driven by the increasing demand for higher power efficiency, improved linearity, and smaller form factors in various applications. The regulatory landscape is evolving with stricter emission standards globally, impacting product design and material choices. Substitute products, such as alternative amplification technologies, pose a competitive threat. End-users span diverse sectors, including telecom infrastructure, aerospace & defense, and automotive. M&A activity has been relatively moderate in recent years, with deal values totaling approximately $xx Million in the period 2019-2024.
- Market Concentration: Moderately Consolidated
- Innovation Catalysts: Higher power efficiency, improved linearity, miniaturization
- Regulatory Landscape: Stringent emission standards, evolving globally.
- Substitute Products: Alternative amplification technologies
- End-User Profiles: Telecom, Aerospace & Defense, Automotive, Wired Broadband, Satellite Communication
- M&A Activity: Moderate, totaling approximately $xx Million (2019-2024)
RF Power Semiconductor Industry Evolution
The RF Power Semiconductor market has witnessed robust growth over the past few years, fueled by the proliferation of wireless communication technologies and increasing demand for high-power applications. Between 2019 and 2024, the market experienced a CAGR of xx%, driven by the adoption of 5G infrastructure and the expansion of the satellite communication sector. Technological advancements, such as the introduction of GaN and SiC-based devices, have significantly improved power efficiency and performance. Consumer demand is shifting towards more energy-efficient and compact solutions, prompting manufacturers to innovate in materials science and packaging technologies. We project a CAGR of xx% during the forecast period (2025-2033), with the GaN segment experiencing the fastest growth due to its superior performance characteristics. The adoption rate of GaN devices is projected to increase from xx% in 2025 to xx% by 2033.
Leading Regions, Countries, or Segments in RF Power Semiconductor Industry
North America currently holds the leading position in the RF Power Semiconductor market, driven by strong investments in 5G infrastructure and the robust aerospace and defense sector. Asia-Pacific is expected to experience substantial growth during the forecast period, fueled by increasing smartphone penetration and the expansion of the telecom infrastructure.
- By Technology:
- GaN: Fastest-growing segment due to high efficiency and power density; key driver is increasing adoption in 5G infrastructure and defense applications.
- LDMOS: Mature technology, maintaining a significant market share driven by its cost-effectiveness in various applications.
- GaAs: Niche applications in high-frequency communication systems continue to drive market growth.
- By Application:
- Telecom Infrastructure: Dominant segment due to the ongoing deployment of 5G networks globally. Key drivers include government investment in network infrastructure and rising demand for high data rates.
- Aerospace & Defense: Significant growth due to the increasing demand for high-power, reliable RF components in radar systems and communication equipment.
- Automotive: Emerging segment driven by the adoption of advanced driver-assistance systems (ADAS) and vehicle-to-everything (V2X) communication.
RF Power Semiconductor Industry Product Innovations
Recent innovations focus on enhancing power efficiency, improving linearity, and reducing the size and cost of RF power semiconductors. Wide bandgap materials like GaN and SiC are driving significant performance improvements. Integration of multiple functions into a single chip is another key trend, reducing system complexity and cost. New packaging techniques are minimizing thermal resistance and improving reliability. These advancements are delivering unique selling propositions like higher power output, better linearity at high frequencies, and improved thermal management.
Propelling Factors for RF Power Semiconductor Industry Growth
Growth is primarily driven by the expansion of 5G and other wireless communication technologies, the increasing demand for high-power RF devices in the aerospace and defense sectors, and the rise of electric vehicles. Government incentives promoting the adoption of renewable energy technologies are also contributing to growth in the RF energy segment. Furthermore, ongoing advancements in materials science and packaging techniques are enhancing the performance and efficiency of RF power semiconductors, creating further growth opportunities.
Obstacles in the RF Power Semiconductor Industry Market
Key challenges include the high cost of wide bandgap materials (like GaN and SiC), supply chain disruptions impacting raw material availability, and intense competition among established and emerging players. Stringent environmental regulations and evolving industry standards also pose challenges for manufacturers. These factors collectively impact profitability and market growth.
Future Opportunities in RF Power Semiconductor Industry
Emerging opportunities lie in the expanding adoption of 5G and beyond-5G technologies, the growing demand for RF energy harvesting in automotive applications, and the development of innovative applications in the Internet of Things (IoT) and smart infrastructure. The continued development of high-frequency, high-power devices using advanced materials and innovative packaging techniques will further drive market growth.
Major Players in the RF Power Semiconductor Industry Ecosystem
Key Developments in RF Power Semiconductor Industry Industry
- 2023-Q3: Qorvo Inc launches a new series of GaN-on-SiC transistors for 5G base stations.
- 2022-Q4: NXP Semiconductors NV acquires a smaller RF semiconductor company, expanding its portfolio.
- 2021-Q2: Cree Inc announces a major investment in its GaN production facilities to meet growing demand.
- 2020-Q1: STMicroelectronics NV partners with a major telecom equipment manufacturer for 5G infrastructure projects. (Further specific developments require additional data)
Strategic RF Power Semiconductor Industry Market Forecast
The RF Power Semiconductor market is poised for continued robust growth, driven by the convergence of multiple technological trends and expanding applications. The adoption of GaN technology will accelerate, alongside the increasing demand for higher power and efficiency in diverse sectors. Continuous innovation in materials, packaging, and design will unlock new opportunities and shape the future landscape of this critical industry.
RF Power Semiconductor Industry Segmentation
-
1. Technology
- 1.1. LDMOS
- 1.2. GaAs
- 1.3. GaN
-
2. Application
- 2.1. Telecom Infrastructure
- 2.2. Aerospace and Defense
- 2.3. Wired Broadband
- 2.4. Satellite Communication
- 2.5. RF Energy (Automotive)
- 2.6. Other Applications
RF Power Semiconductor Industry Segmentation By Geography
-
1. North America
- 1.1. United States
- 1.2. Canada
-
2. Europe
- 2.1. United Kingdom
- 2.2. Germany
- 2.3. France
- 2.4. Rest of Europe
-
3. Asia Pacific
- 3.1. China
- 3.2. India
- 3.3. South Korea
- 3.4. Japan
- 3.5. Rest of Asia Pacific
-
4. Rest of the World
- 4.1. Latin America
- 4.2. Middle East
RF Power Semiconductor Industry Regional Market Share
Geographic Coverage of RF Power Semiconductor Industry
RF Power Semiconductor Industry REPORT HIGHLIGHTS
| Aspects | Details |
|---|---|
| Study Period | 2020-2034 |
| Base Year | 2025 |
| Estimated Year | 2026 |
| Forecast Period | 2026-2034 |
| Historical Period | 2020-2025 |
| Growth Rate | CAGR of 15.56% from 2020-2034 |
| Segmentation |
|
Table of Contents
- 1. Introduction
- 1.1. Research Scope
- 1.2. Market Segmentation
- 1.3. Research Objective
- 1.4. Definitions and Assumptions
- 2. Executive Summary
- 2.1. Market Snapshot
- 3. Market Dynamics
- 3.1. Market Drivers
- 3.2. Market Restrains
- 3.3. Market Trends
- 3.4. Market Opportunities
- 4. Market Factor Analysis
- 4.1. Porters Five Forces
- 4.1.1. Bargaining Power of Suppliers
- 4.1.2. Bargaining Power of Buyers
- 4.1.3. Threat of New Entrants
- 4.1.4. Threat of Substitutes
- 4.1.5. Competitive Rivalry
- 4.2. PESTEL analysis
- 4.3. BCG Analysis
- 4.3.1. Stars (High Growth, High Market Share)
- 4.3.2. Cash Cows (Low Growth, High Market Share)
- 4.3.3. Question Mark (High Growth, Low Market Share)
- 4.3.4. Dogs (Low Growth, Low Market Share)
- 4.4. Ansoff Matrix Analysis
- 4.5. Supply Chain Analysis
- 4.6. Regulatory Landscape
- 4.7. Current Market Potential and Opportunity Assessment (TAM–SAM–SOM Framework)
- 4.8. DMV Analyst Note
- 4.1. Porters Five Forces
- 5. Market Analysis, Insights and Forecast 2021-2033
- 5.1. Market Analysis, Insights and Forecast - by Technology
- 5.1.1. LDMOS
- 5.1.2. GaAs
- 5.1.3. GaN
- 5.2. Market Analysis, Insights and Forecast - by Application
- 5.2.1. Telecom Infrastructure
- 5.2.2. Aerospace and Defense
- 5.2.3. Wired Broadband
- 5.2.4. Satellite Communication
- 5.2.5. RF Energy (Automotive)
- 5.2.6. Other Applications
- 5.3. Market Analysis, Insights and Forecast - by Region
- 5.3.1. North America
- 5.3.2. Europe
- 5.3.3. Asia Pacific
- 5.3.4. Rest of the World
- 5.1. Market Analysis, Insights and Forecast - by Technology
- 6. Global RF Power Semiconductor Industry Analysis, Insights and Forecast, 2021-2033
- 6.1. Market Analysis, Insights and Forecast - by Technology
- 6.1.1. LDMOS
- 6.1.2. GaAs
- 6.1.3. GaN
- 6.2. Market Analysis, Insights and Forecast - by Application
- 6.2.1. Telecom Infrastructure
- 6.2.2. Aerospace and Defense
- 6.2.3. Wired Broadband
- 6.2.4. Satellite Communication
- 6.2.5. RF Energy (Automotive)
- 6.2.6. Other Applications
- 6.1. Market Analysis, Insights and Forecast - by Technology
- 7. North America RF Power Semiconductor Industry Analysis, Insights and Forecast, 2020-2032
- 7.1. Market Analysis, Insights and Forecast - by Technology
- 7.1.1. LDMOS
- 7.1.2. GaAs
- 7.1.3. GaN
- 7.2. Market Analysis, Insights and Forecast - by Application
- 7.2.1. Telecom Infrastructure
- 7.2.2. Aerospace and Defense
- 7.2.3. Wired Broadband
- 7.2.4. Satellite Communication
- 7.2.5. RF Energy (Automotive)
- 7.2.6. Other Applications
- 7.1. Market Analysis, Insights and Forecast - by Technology
- 8. Europe RF Power Semiconductor Industry Analysis, Insights and Forecast, 2020-2032
- 8.1. Market Analysis, Insights and Forecast - by Technology
- 8.1.1. LDMOS
- 8.1.2. GaAs
- 8.1.3. GaN
- 8.2. Market Analysis, Insights and Forecast - by Application
- 8.2.1. Telecom Infrastructure
- 8.2.2. Aerospace and Defense
- 8.2.3. Wired Broadband
- 8.2.4. Satellite Communication
- 8.2.5. RF Energy (Automotive)
- 8.2.6. Other Applications
- 8.1. Market Analysis, Insights and Forecast - by Technology
- 9. Asia Pacific RF Power Semiconductor Industry Analysis, Insights and Forecast, 2020-2032
- 9.1. Market Analysis, Insights and Forecast - by Technology
- 9.1.1. LDMOS
- 9.1.2. GaAs
- 9.1.3. GaN
- 9.2. Market Analysis, Insights and Forecast - by Application
- 9.2.1. Telecom Infrastructure
- 9.2.2. Aerospace and Defense
- 9.2.3. Wired Broadband
- 9.2.4. Satellite Communication
- 9.2.5. RF Energy (Automotive)
- 9.2.6. Other Applications
- 9.1. Market Analysis, Insights and Forecast - by Technology
- 10. Rest of the World RF Power Semiconductor Industry Analysis, Insights and Forecast, 2020-2032
- 10.1. Market Analysis, Insights and Forecast - by Technology
- 10.1.1. LDMOS
- 10.1.2. GaAs
- 10.1.3. GaN
- 10.2. Market Analysis, Insights and Forecast - by Application
- 10.2.1. Telecom Infrastructure
- 10.2.2. Aerospace and Defense
- 10.2.3. Wired Broadband
- 10.2.4. Satellite Communication
- 10.2.5. RF Energy (Automotive)
- 10.2.6. Other Applications
- 10.1. Market Analysis, Insights and Forecast - by Technology
- 11. Competitive Analysis
- 11.1. Company Profiles
- 11.1.1 NXP Semiconductors NV
- 11.1.1.1. Company Overview
- 11.1.1.2. Products
- 11.1.1.3. Company Financials
- 11.1.1.4. SWOT Analysis
- 11.1.2 Cree Inc
- 11.1.2.1. Company Overview
- 11.1.2.2. Products
- 11.1.2.3. Company Financials
- 11.1.2.4. SWOT Analysis
- 11.1.3 Mitsubishi Electric Corporation
- 11.1.3.1. Company Overview
- 11.1.3.2. Products
- 11.1.3.3. Company Financials
- 11.1.3.4. SWOT Analysis
- 11.1.4 STMicroelectronics NV
- 11.1.4.1. Company Overview
- 11.1.4.2. Products
- 11.1.4.3. Company Financials
- 11.1.4.4. SWOT Analysis
- 11.1.5 Aethercomm Inc
- 11.1.5.1. Company Overview
- 11.1.5.2. Products
- 11.1.5.3. Company Financials
- 11.1.5.4. SWOT Analysis
- 11.1.6 Toshiba Corporation
- 11.1.6.1. Company Overview
- 11.1.6.2. Products
- 11.1.6.3. Company Financials
- 11.1.6.4. SWOT Analysis
- 11.1.7 M/A-COM Technology Solutions Holdings Inc
- 11.1.7.1. Company Overview
- 11.1.7.2. Products
- 11.1.7.3. Company Financials
- 11.1.7.4. SWOT Analysis
- 11.1.8 Qorvo Inc
- 11.1.8.1. Company Overview
- 11.1.8.2. Products
- 11.1.8.3. Company Financials
- 11.1.8.4. SWOT Analysis
- 11.1.9 Murata Manufacturing Co Ltd
- 11.1.9.1. Company Overview
- 11.1.9.2. Products
- 11.1.9.3. Company Financials
- 11.1.9.4. SWOT Analysis
- 11.1.10 Analog Devices Inc
- 11.1.10.1. Company Overview
- 11.1.10.2. Products
- 11.1.10.3. Company Financials
- 11.1.10.4. SWOT Analysis
- 11.1.11 Qualcomm Inc
- 11.1.11.1. Company Overview
- 11.1.11.2. Products
- 11.1.11.3. Company Financials
- 11.1.11.4. SWOT Analysis
- 11.1.1 NXP Semiconductors NV
- 11.2. Market Entropy
- 11.2.1 Company's Key Areas Served
- 11.2.2 Recent Developments
- 11.3. Company Market Share Analysis 2025
- 11.3.1 Top 5 Companies Market Share Analysis
- 11.3.2 Top 3 Companies Market Share Analysis
- 11.4. List of Potential Customers
- 12. Research Methodology
List of Figures
- Figure 1: Global RF Power Semiconductor Industry Revenue Breakdown (undefined, %) by Region 2025 & 2033
- Figure 2: North America RF Power Semiconductor Industry Revenue (undefined), by Technology 2025 & 2033
- Figure 3: North America RF Power Semiconductor Industry Revenue Share (%), by Technology 2025 & 2033
- Figure 4: North America RF Power Semiconductor Industry Revenue (undefined), by Application 2025 & 2033
- Figure 5: North America RF Power Semiconductor Industry Revenue Share (%), by Application 2025 & 2033
- Figure 6: North America RF Power Semiconductor Industry Revenue (undefined), by Country 2025 & 2033
- Figure 7: North America RF Power Semiconductor Industry Revenue Share (%), by Country 2025 & 2033
- Figure 8: Europe RF Power Semiconductor Industry Revenue (undefined), by Technology 2025 & 2033
- Figure 9: Europe RF Power Semiconductor Industry Revenue Share (%), by Technology 2025 & 2033
- Figure 10: Europe RF Power Semiconductor Industry Revenue (undefined), by Application 2025 & 2033
- Figure 11: Europe RF Power Semiconductor Industry Revenue Share (%), by Application 2025 & 2033
- Figure 12: Europe RF Power Semiconductor Industry Revenue (undefined), by Country 2025 & 2033
- Figure 13: Europe RF Power Semiconductor Industry Revenue Share (%), by Country 2025 & 2033
- Figure 14: Asia Pacific RF Power Semiconductor Industry Revenue (undefined), by Technology 2025 & 2033
- Figure 15: Asia Pacific RF Power Semiconductor Industry Revenue Share (%), by Technology 2025 & 2033
- Figure 16: Asia Pacific RF Power Semiconductor Industry Revenue (undefined), by Application 2025 & 2033
- Figure 17: Asia Pacific RF Power Semiconductor Industry Revenue Share (%), by Application 2025 & 2033
- Figure 18: Asia Pacific RF Power Semiconductor Industry Revenue (undefined), by Country 2025 & 2033
- Figure 19: Asia Pacific RF Power Semiconductor Industry Revenue Share (%), by Country 2025 & 2033
- Figure 20: Rest of the World RF Power Semiconductor Industry Revenue (undefined), by Technology 2025 & 2033
- Figure 21: Rest of the World RF Power Semiconductor Industry Revenue Share (%), by Technology 2025 & 2033
- Figure 22: Rest of the World RF Power Semiconductor Industry Revenue (undefined), by Application 2025 & 2033
- Figure 23: Rest of the World RF Power Semiconductor Industry Revenue Share (%), by Application 2025 & 2033
- Figure 24: Rest of the World RF Power Semiconductor Industry Revenue (undefined), by Country 2025 & 2033
- Figure 25: Rest of the World RF Power Semiconductor Industry Revenue Share (%), by Country 2025 & 2033
List of Tables
- Table 1: Global RF Power Semiconductor Industry Revenue undefined Forecast, by Technology 2020 & 2033
- Table 2: Global RF Power Semiconductor Industry Revenue undefined Forecast, by Application 2020 & 2033
- Table 3: Global RF Power Semiconductor Industry Revenue undefined Forecast, by Region 2020 & 2033
- Table 4: Global RF Power Semiconductor Industry Revenue undefined Forecast, by Technology 2020 & 2033
- Table 5: Global RF Power Semiconductor Industry Revenue undefined Forecast, by Application 2020 & 2033
- Table 6: Global RF Power Semiconductor Industry Revenue undefined Forecast, by Country 2020 & 2033
- Table 7: United States RF Power Semiconductor Industry Revenue (undefined) Forecast, by Application 2020 & 2033
- Table 8: Canada RF Power Semiconductor Industry Revenue (undefined) Forecast, by Application 2020 & 2033
- Table 9: Global RF Power Semiconductor Industry Revenue undefined Forecast, by Technology 2020 & 2033
- Table 10: Global RF Power Semiconductor Industry Revenue undefined Forecast, by Application 2020 & 2033
- Table 11: Global RF Power Semiconductor Industry Revenue undefined Forecast, by Country 2020 & 2033
- Table 12: United Kingdom RF Power Semiconductor Industry Revenue (undefined) Forecast, by Application 2020 & 2033
- Table 13: Germany RF Power Semiconductor Industry Revenue (undefined) Forecast, by Application 2020 & 2033
- Table 14: France RF Power Semiconductor Industry Revenue (undefined) Forecast, by Application 2020 & 2033
- Table 15: Rest of Europe RF Power Semiconductor Industry Revenue (undefined) Forecast, by Application 2020 & 2033
- Table 16: Global RF Power Semiconductor Industry Revenue undefined Forecast, by Technology 2020 & 2033
- Table 17: Global RF Power Semiconductor Industry Revenue undefined Forecast, by Application 2020 & 2033
- Table 18: Global RF Power Semiconductor Industry Revenue undefined Forecast, by Country 2020 & 2033
- Table 19: China RF Power Semiconductor Industry Revenue (undefined) Forecast, by Application 2020 & 2033
- Table 20: India RF Power Semiconductor Industry Revenue (undefined) Forecast, by Application 2020 & 2033
- Table 21: South Korea RF Power Semiconductor Industry Revenue (undefined) Forecast, by Application 2020 & 2033
- Table 22: Japan RF Power Semiconductor Industry Revenue (undefined) Forecast, by Application 2020 & 2033
- Table 23: Rest of Asia Pacific RF Power Semiconductor Industry Revenue (undefined) Forecast, by Application 2020 & 2033
- Table 24: Global RF Power Semiconductor Industry Revenue undefined Forecast, by Technology 2020 & 2033
- Table 25: Global RF Power Semiconductor Industry Revenue undefined Forecast, by Application 2020 & 2033
- Table 26: Global RF Power Semiconductor Industry Revenue undefined Forecast, by Country 2020 & 2033
- Table 27: Latin America RF Power Semiconductor Industry Revenue (undefined) Forecast, by Application 2020 & 2033
- Table 28: Middle East RF Power Semiconductor Industry Revenue (undefined) Forecast, by Application 2020 & 2033
Frequently Asked Questions
1. What is the projected Compound Annual Growth Rate (CAGR) of the RF Power Semiconductor Industry?
The projected CAGR is approximately 15.56%.
2. Which companies are prominent players in the RF Power Semiconductor Industry?
Key companies in the market include NXP Semiconductors NV, Cree Inc, Mitsubishi Electric Corporation, STMicroelectronics NV, Aethercomm Inc, Toshiba Corporation, M/A-COM Technology Solutions Holdings Inc, Qorvo Inc, Murata Manufacturing Co Ltd, Analog Devices Inc, Qualcomm Inc.
3. What are the main segments of the RF Power Semiconductor Industry?
The market segments include Technology, Application.
4. Can you provide details about the market size?
The market size is estimated to be USD XXX N/A as of 2022.
5. What are some drivers contributing to market growth?
; Increasing Usage of Smartphones; Growing Transition toward 5G and Long-term Evolution (LTE) Implementation.
6. What are the notable trends driving market growth?
Aerospace and Defense Sector to Offer Potential Growth Opportunities.
7. Are there any restraints impacting market growth?
; High Cost of RF Power.
8. Can you provide examples of recent developments in the market?
N/A
9. What pricing options are available for accessing the report?
Pricing options include single-user, multi-user, and enterprise licenses priced at USD 4750, USD 5250, and USD 8750 respectively.
10. Is the market size provided in terms of value or volume?
The market size is provided in terms of value, measured in N/A.
11. Are there any specific market keywords associated with the report?
Yes, the market keyword associated with the report is "RF Power Semiconductor Industry," which aids in identifying and referencing the specific market segment covered.
12. How do I determine which pricing option suits my needs best?
The pricing options vary based on user requirements and access needs. Individual users may opt for single-user licenses, while businesses requiring broader access may choose multi-user or enterprise licenses for cost-effective access to the report.
13. Are there any additional resources or data provided in the RF Power Semiconductor Industry report?
While the report offers comprehensive insights, it's advisable to review the specific contents or supplementary materials provided to ascertain if additional resources or data are available.
14. How can I stay updated on further developments or reports in the RF Power Semiconductor Industry?
To stay informed about further developments, trends, and reports in the RF Power Semiconductor Industry, consider subscribing to industry newsletters, following relevant companies and organizations, or regularly checking reputable industry news sources and publications.
Methodology
Step 1 - Identification of Relevant Samples Size from Population Database


Step 2 - Approaches for Defining Global Market Size (Value, Volume* & Price*)

Note*: In applicable scenarios
Step 3 - Data Sources
Primary Research
- Web Analytics
- Survey Reports
- Research Institute
- Latest Research Reports
- Opinion Leaders
Secondary Research
- Annual Reports
- White Paper
- Latest Press Release
- Industry Association
- Paid Database
- Investor Presentations

Step 4 - Data Triangulation
Involves using different sources of information in order to increase the validity of a study
These sources are likely to be stakeholders in a program - participants, other researchers, program staff, other community members, and so on.
Then we put all data in single framework & apply various statistical tools to find out the dynamic on the market.
During the analysis stage, feedback from the stakeholder groups would be compared to determine areas of agreement as well as areas of divergence