

Key Insights
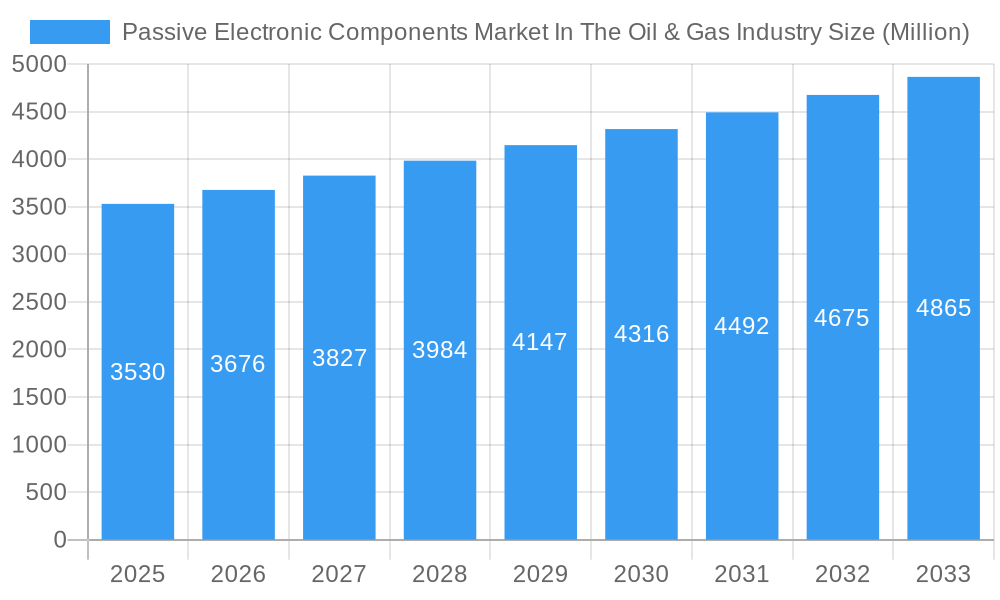
The Passive Electronic Components (PEC) market within the Oil & Gas industry is experiencing steady growth, projected to reach a market size of $3.53 billion in 2025, exhibiting a Compound Annual Growth Rate (CAGR) of 3.90% from 2019 to 2033. This expansion is driven by several key factors. Firstly, the increasing demand for advanced automation and instrumentation in oil and gas exploration and production necessitates the use of sophisticated electronic systems, driving the need for reliable and high-performance PECs. Secondly, stringent safety regulations and the need for robust monitoring and control systems in hazardous environments fuel the adoption of durable and reliable PECs specifically designed for this demanding sector. Furthermore, technological advancements in areas like smart grids and remote sensing create new avenues for PEC deployment, contributing to market expansion. The market is segmented into capacitors, inductors, and resistors, each catering to specific applications within the Oil & Gas sector. Major players such as Vishay Intertechnology, AVX Corporation, and KEMET Corporation dominate the landscape, leveraging their technological expertise and established supply chains to cater to the industry's diverse needs. Geographical distribution shows a strong presence in North America and Europe, while Asia Pacific is poised for significant growth, driven by increasing oil and gas activities in the region. The forecast period of 2025-2033 indicates continued market expansion, fueled by industry trends such as digitalization and the growth of renewable energy sources that utilize technologies requiring sophisticated PECs.
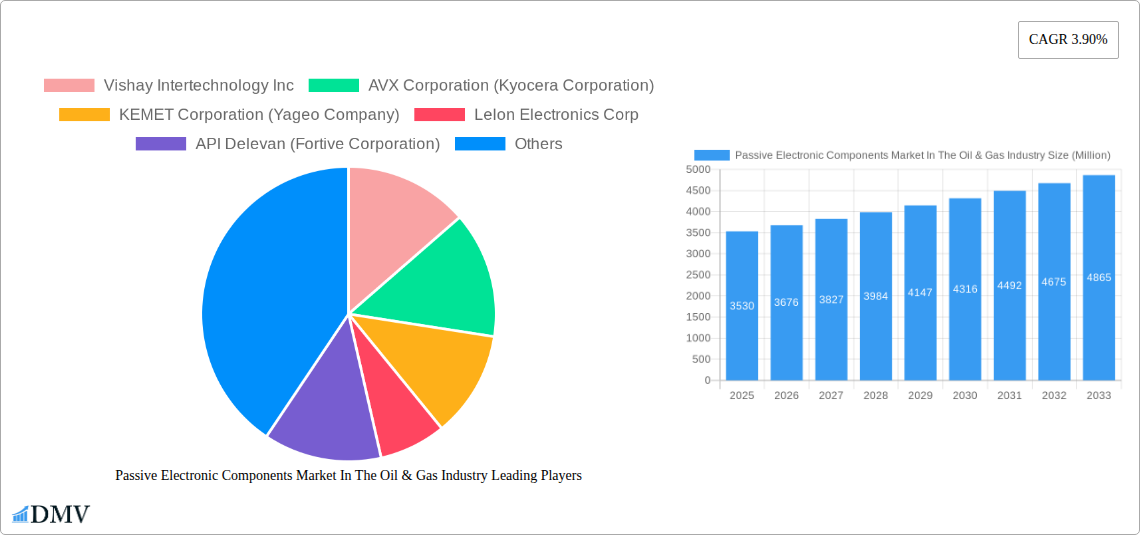
Passive Electronic Components Market In The Oil & Gas Industry Market Size (In Billion)
The restraining factors impacting the market include price volatility of raw materials used in PEC manufacturing and the cyclical nature of the oil and gas industry itself. Economic downturns and fluctuating energy prices can directly influence investment in new technologies and infrastructure, thereby impacting the demand for these crucial components. However, the long-term outlook remains optimistic due to the growing awareness of energy security and the steady increase in global energy consumption. The continuous push for efficiency improvements and automation within the Oil & Gas industry ensures a consistent and growing demand for high-quality, reliable PECs. This sustained demand, coupled with technological innovation, will propel the market toward further growth throughout the forecast period.
Passive Electronic Components Market In The Oil & Gas Industry Company Market Share
Passive Electronic Components Market In The Oil & Gas Industry: A Comprehensive Report (2019-2033)
This insightful report provides a detailed analysis of the Passive Electronic Components Market in the Oil & Gas Industry, offering a comprehensive overview of market trends, leading players, and future growth prospects. With a study period spanning 2019-2033, a base year of 2025, and a forecast period of 2025-2033, this report is an invaluable resource for stakeholders seeking to understand and capitalize on the opportunities within this dynamic market. The market size is estimated at xx Million in 2025 and is projected to reach xx Million by 2033.
Passive Electronic Components Market In The Oil & Gas Industry Market Composition & Trends
This section delves into the competitive landscape of the passive electronic components market within the oil and gas sector. We analyze market concentration, identifying key players and their respective market share. The report explores the influence of innovation, specifically advancements in materials and miniaturization, on market growth. Regulatory landscapes, including safety standards and environmental regulations, are examined for their impact on market dynamics. Furthermore, the report investigates substitute products and their potential to disrupt the market. End-user profiles are detailed, highlighting the specific needs and preferences of different segments within the oil and gas industry. Finally, we analyze mergers and acquisitions (M&A) activities, including deal values and their implications for market consolidation. Data on market share distribution shows a relatively fragmented market with the top 5 players holding approximately xx% of the market share in 2024. M&A activity in the period 2019-2024 totalled approximately xx Million.
- Market Concentration: Moderately fragmented, with no single dominant player.
- Innovation Catalysts: Advancements in materials science (e.g., high-temperature polymers), miniaturization, and improved power handling capabilities.
- Regulatory Landscape: Stringent safety and environmental regulations drive demand for robust and reliable components.
- Substitute Products: Limited direct substitutes; however, alternative technologies might impact specific applications.
- End-User Profiles: Upstream, midstream, and downstream oil and gas operators, equipment manufacturers, and service providers.
- M&A Activity: Significant consolidation potential as companies seek to expand their product portfolios and market reach.
Passive Electronic Components Market In The Oil & Gas Industry Industry Evolution
This section provides a detailed analysis of the evolution of the passive electronic components market within the oil and gas industry, covering the period from 2019 to 2033. We examine market growth trajectories, identifying key periods of expansion and contraction. The report explores technological advancements that have shaped the market, such as the introduction of new materials and improved manufacturing processes. Shifting consumer demands, driven by factors such as increasing automation and the need for improved safety and reliability, are also analyzed. The market experienced a Compound Annual Growth Rate (CAGR) of xx% during the historical period (2019-2024) and is projected to grow at a CAGR of xx% during the forecast period (2025-2033), driven by increasing demand for automation and digitalization in the oil and gas industry. The adoption rate of advanced passive components is projected to increase from xx% in 2024 to xx% in 2033.
Leading Regions, Countries, or Segments in Passive Electronic Components Market In The Oil & Gas Industry
This section identifies the leading regions, countries, and segments within the passive electronic components market in the oil & gas industry. The report focuses on the dominance of specific geographical areas, analyzing the factors driving their market leadership. A detailed comparison of the key segments – Capacitors, Inductors, and Resistors – is provided, examining their relative market share and growth potential. North America currently holds the largest market share, followed by Europe and Asia Pacific.
- Key Drivers for North American Dominance: Strong presence of major oil and gas companies, advanced infrastructure, and robust regulatory frameworks.
- Capacitors: High demand driven by power conditioning applications in drilling and refining processes.
- Inductors: Essential components in power electronics, particularly in electric motor control systems for drilling operations.
- Resistors: Widely used in instrumentation, control systems, and communication networks.
Passive Electronic Components Market In The Oil & Gas Industry Product Innovations
Recent years have witnessed significant product innovations in passive electronic components tailored to the demanding environment of the oil and gas industry. These innovations include enhanced durability, improved thermal performance, and smaller form factors. For example, the introduction of high-temperature capacitors and resistors capable of withstanding extreme temperatures and pressures has addressed key challenges in harsh operating environments. The development of miniaturized components enables denser packaging and improved system integration, leading to more compact and efficient equipment. This ongoing innovation continues to enhance the performance, reliability, and safety of oil and gas operations.
Propelling Factors for Passive Electronic Components Market In The Oil & Gas Industry Growth
Several factors are propelling the growth of the passive electronic components market in the oil and gas industry. Technological advancements, such as the development of more efficient and reliable components, are a key driver. Economic factors, including increasing investments in oil and gas exploration and production, also contribute significantly. Finally, supportive government regulations and policies aimed at improving safety and environmental performance are fostering market expansion.
Obstacles in the Passive Electronic Components Market In The Oil & Gas Industry Market
Despite positive growth prospects, the market faces challenges. Regulatory compliance requirements for specific components can increase costs. Supply chain disruptions, particularly in obtaining specialized materials, can affect production and lead times. Intense competition among manufacturers also creates pricing pressure, impacting profit margins. These factors can hinder market growth in the short-term.
Future Opportunities in Passive Electronic Components Market In The Oil & Gas Industry
The market presents several opportunities for growth. The increasing adoption of digitalization and automation in oil and gas operations is driving demand for advanced passive components. The development of new materials with enhanced performance characteristics, particularly in high-temperature and high-pressure environments, will also fuel market expansion. Additionally, expanding applications in offshore exploration and renewable energy projects offer significant growth potential.
Major Players in the Passive Electronic Components Market In The Oil & Gas Industry Ecosystem
- Vishay Intertechnology Inc
- AVX Corporation (Kyocera Corporation)
- KEMET Corporation (Yageo Company)
- Lelon Electronics Corp
- API Delevan (Fortive Corporation)
- TE Connectivity
- Cornell Dubilier Electronics Inc
- TDK Corporation
- Ohmite Manufacturing Company
- Panasonic Corporation
- Honeywell International Inc
- Eaton Corporation
Key Developments in Passive Electronic Components Market In The Oil & Gas Industry Industry
- March 2023: Cornell Dubilier Electronics Inc. introduces the 944L series of low inductance, high current DC link film capacitors, enhancing power handling capabilities in demanding applications.
- September 2022: TT Electronics launches the TFHP series thin film high-power chip resistors, offering improved precision and performance through advanced material utilization.
Strategic Passive Electronic Components Market In The Oil & Gas Industry Market Forecast
The passive electronic components market in the oil and gas industry is poised for continued growth, driven by technological advancements, increasing automation, and rising demand for improved safety and reliability in oil and gas operations. The market's future is bright, with ongoing innovation and expansion into new applications promising substantial growth opportunities for key players.
Passive Electronic Components Market In The Oil & Gas Industry Segmentation
-
1. Type
- 1.1. Capacitor
- 1.2. Inductor
- 1.3. Resistor
Passive Electronic Components Market In The Oil & Gas Industry Segmentation By Geography
- 1. North America
- 2. Europe
- 3. Asia
- 4. Australia and New Zealand
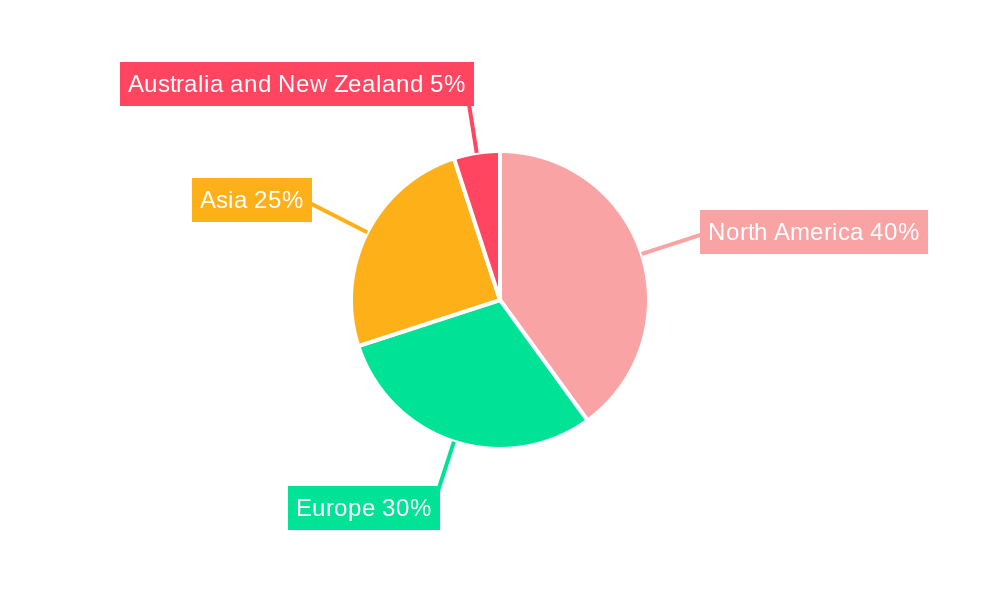
Passive Electronic Components Market In The Oil & Gas Industry Regional Market Share
Geographic Coverage of Passive Electronic Components Market In The Oil & Gas Industry
Passive Electronic Components Market In The Oil & Gas Industry REPORT HIGHLIGHTS
| Aspects | Details |
|---|---|
| Study Period | 2020-2034 |
| Base Year | 2025 |
| Estimated Year | 2026 |
| Forecast Period | 2026-2034 |
| Historical Period | 2020-2025 |
| Growth Rate | CAGR of 3.90% from 2020-2034 |
| Segmentation |
|
Table of Contents
- 1. Introduction
- 1.1. Research Scope
- 1.2. Market Segmentation
- 1.3. Research Objective
- 1.4. Definitions and Assumptions
- 2. Executive Summary
- 2.1. Market Snapshot
- 3. Market Dynamics
- 3.1. Market Drivers
- 3.2. Market Restrains
- 3.3. Market Trends
- 3.4. Market Opportunities
- 4. Market Factor Analysis
- 4.1. Porters Five Forces
- 4.1.1. Bargaining Power of Suppliers
- 4.1.2. Bargaining Power of Buyers
- 4.1.3. Threat of New Entrants
- 4.1.4. Threat of Substitutes
- 4.1.5. Competitive Rivalry
- 4.2. PESTEL analysis
- 4.3. BCG Analysis
- 4.3.1. Stars (High Growth, High Market Share)
- 4.3.2. Cash Cows (Low Growth, High Market Share)
- 4.3.3. Question Mark (High Growth, Low Market Share)
- 4.3.4. Dogs (Low Growth, Low Market Share)
- 4.4. Ansoff Matrix Analysis
- 4.5. Supply Chain Analysis
- 4.6. Regulatory Landscape
- 4.7. Current Market Potential and Opportunity Assessment (TAM–SAM–SOM Framework)
- 4.8. DMV Analyst Note
- 4.1. Porters Five Forces
- 5. Market Analysis, Insights and Forecast 2021-2033
- 5.1. Market Analysis, Insights and Forecast - by Type
- 5.1.1. Capacitor
- 5.1.2. Inductor
- 5.1.3. Resistor
- 5.2. Market Analysis, Insights and Forecast - by Region
- 5.2.1. North America
- 5.2.2. Europe
- 5.2.3. Asia
- 5.2.4. Australia and New Zealand
- 5.1. Market Analysis, Insights and Forecast - by Type
- 6. Global Passive Electronic Components Market In The Oil & Gas Industry Analysis, Insights and Forecast, 2021-2033
- 6.1. Market Analysis, Insights and Forecast - by Type
- 6.1.1. Capacitor
- 6.1.2. Inductor
- 6.1.3. Resistor
- 6.1. Market Analysis, Insights and Forecast - by Type
- 7. North America Passive Electronic Components Market In The Oil & Gas Industry Analysis, Insights and Forecast, 2020-2032
- 7.1. Market Analysis, Insights and Forecast - by Type
- 7.1.1. Capacitor
- 7.1.2. Inductor
- 7.1.3. Resistor
- 7.1. Market Analysis, Insights and Forecast - by Type
- 8. Europe Passive Electronic Components Market In The Oil & Gas Industry Analysis, Insights and Forecast, 2020-2032
- 8.1. Market Analysis, Insights and Forecast - by Type
- 8.1.1. Capacitor
- 8.1.2. Inductor
- 8.1.3. Resistor
- 8.1. Market Analysis, Insights and Forecast - by Type
- 9. Asia Passive Electronic Components Market In The Oil & Gas Industry Analysis, Insights and Forecast, 2020-2032
- 9.1. Market Analysis, Insights and Forecast - by Type
- 9.1.1. Capacitor
- 9.1.2. Inductor
- 9.1.3. Resistor
- 9.1. Market Analysis, Insights and Forecast - by Type
- 10. Australia and New Zealand Passive Electronic Components Market In The Oil & Gas Industry Analysis, Insights and Forecast, 2020-2032
- 10.1. Market Analysis, Insights and Forecast - by Type
- 10.1.1. Capacitor
- 10.1.2. Inductor
- 10.1.3. Resistor
- 10.1. Market Analysis, Insights and Forecast - by Type
- 11. Competitive Analysis
- 11.1. Company Profiles
- 11.1.1 Vishay Intertechnology Inc
- 11.1.1.1. Company Overview
- 11.1.1.2. Products
- 11.1.1.3. Company Financials
- 11.1.1.4. SWOT Analysis
- 11.1.2 AVX Corporation (Kyocera Corporation)
- 11.1.2.1. Company Overview
- 11.1.2.2. Products
- 11.1.2.3. Company Financials
- 11.1.2.4. SWOT Analysis
- 11.1.3 KEMET Corporation (Yageo Company)
- 11.1.3.1. Company Overview
- 11.1.3.2. Products
- 11.1.3.3. Company Financials
- 11.1.3.4. SWOT Analysis
- 11.1.4 Lelon Electronics Corp
- 11.1.4.1. Company Overview
- 11.1.4.2. Products
- 11.1.4.3. Company Financials
- 11.1.4.4. SWOT Analysis
- 11.1.5 API Delevan (Fortive Corporation)
- 11.1.5.1. Company Overview
- 11.1.5.2. Products
- 11.1.5.3. Company Financials
- 11.1.5.4. SWOT Analysis
- 11.1.6 TE Connectivity
- 11.1.6.1. Company Overview
- 11.1.6.2. Products
- 11.1.6.3. Company Financials
- 11.1.6.4. SWOT Analysis
- 11.1.7 Cornell Dubilier Electronics Inc
- 11.1.7.1. Company Overview
- 11.1.7.2. Products
- 11.1.7.3. Company Financials
- 11.1.7.4. SWOT Analysis
- 11.1.8 TDK Corporation
- 11.1.8.1. Company Overview
- 11.1.8.2. Products
- 11.1.8.3. Company Financials
- 11.1.8.4. SWOT Analysis
- 11.1.9 Ohmite Manufacturing Company
- 11.1.9.1. Company Overview
- 11.1.9.2. Products
- 11.1.9.3. Company Financials
- 11.1.9.4. SWOT Analysis
- 11.1.10 Panasonic Corporation
- 11.1.10.1. Company Overview
- 11.1.10.2. Products
- 11.1.10.3. Company Financials
- 11.1.10.4. SWOT Analysis
- 11.1.11 Honeywell International Inc *List Not Exhaustive
- 11.1.11.1. Company Overview
- 11.1.11.2. Products
- 11.1.11.3. Company Financials
- 11.1.11.4. SWOT Analysis
- 11.1.12 Eaton Corporation
- 11.1.12.1. Company Overview
- 11.1.12.2. Products
- 11.1.12.3. Company Financials
- 11.1.12.4. SWOT Analysis
- 11.1.1 Vishay Intertechnology Inc
- 11.2. Market Entropy
- 11.2.1 Company's Key Areas Served
- 11.2.2 Recent Developments
- 11.3. Company Market Share Analysis 2025
- 11.3.1 Top 5 Companies Market Share Analysis
- 11.3.2 Top 3 Companies Market Share Analysis
- 11.4. List of Potential Customers
- 12. Research Methodology
List of Figures
- Figure 1: Global Passive Electronic Components Market In The Oil & Gas Industry Revenue Breakdown (Million, %) by Region 2025 & 2033
- Figure 2: North America Passive Electronic Components Market In The Oil & Gas Industry Revenue (Million), by Type 2025 & 2033
- Figure 3: North America Passive Electronic Components Market In The Oil & Gas Industry Revenue Share (%), by Type 2025 & 2033
- Figure 4: North America Passive Electronic Components Market In The Oil & Gas Industry Revenue (Million), by Country 2025 & 2033
- Figure 5: North America Passive Electronic Components Market In The Oil & Gas Industry Revenue Share (%), by Country 2025 & 2033
- Figure 6: Europe Passive Electronic Components Market In The Oil & Gas Industry Revenue (Million), by Type 2025 & 2033
- Figure 7: Europe Passive Electronic Components Market In The Oil & Gas Industry Revenue Share (%), by Type 2025 & 2033
- Figure 8: Europe Passive Electronic Components Market In The Oil & Gas Industry Revenue (Million), by Country 2025 & 2033
- Figure 9: Europe Passive Electronic Components Market In The Oil & Gas Industry Revenue Share (%), by Country 2025 & 2033
- Figure 10: Asia Passive Electronic Components Market In The Oil & Gas Industry Revenue (Million), by Type 2025 & 2033
- Figure 11: Asia Passive Electronic Components Market In The Oil & Gas Industry Revenue Share (%), by Type 2025 & 2033
- Figure 12: Asia Passive Electronic Components Market In The Oil & Gas Industry Revenue (Million), by Country 2025 & 2033
- Figure 13: Asia Passive Electronic Components Market In The Oil & Gas Industry Revenue Share (%), by Country 2025 & 2033
- Figure 14: Australia and New Zealand Passive Electronic Components Market In The Oil & Gas Industry Revenue (Million), by Type 2025 & 2033
- Figure 15: Australia and New Zealand Passive Electronic Components Market In The Oil & Gas Industry Revenue Share (%), by Type 2025 & 2033
- Figure 16: Australia and New Zealand Passive Electronic Components Market In The Oil & Gas Industry Revenue (Million), by Country 2025 & 2033
- Figure 17: Australia and New Zealand Passive Electronic Components Market In The Oil & Gas Industry Revenue Share (%), by Country 2025 & 2033
List of Tables
- Table 1: Global Passive Electronic Components Market In The Oil & Gas Industry Revenue Million Forecast, by Type 2020 & 2033
- Table 2: Global Passive Electronic Components Market In The Oil & Gas Industry Revenue Million Forecast, by Region 2020 & 2033
- Table 3: Global Passive Electronic Components Market In The Oil & Gas Industry Revenue Million Forecast, by Type 2020 & 2033
- Table 4: Global Passive Electronic Components Market In The Oil & Gas Industry Revenue Million Forecast, by Country 2020 & 2033
- Table 5: Global Passive Electronic Components Market In The Oil & Gas Industry Revenue Million Forecast, by Type 2020 & 2033
- Table 6: Global Passive Electronic Components Market In The Oil & Gas Industry Revenue Million Forecast, by Country 2020 & 2033
- Table 7: Global Passive Electronic Components Market In The Oil & Gas Industry Revenue Million Forecast, by Type 2020 & 2033
- Table 8: Global Passive Electronic Components Market In The Oil & Gas Industry Revenue Million Forecast, by Country 2020 & 2033
- Table 9: Global Passive Electronic Components Market In The Oil & Gas Industry Revenue Million Forecast, by Type 2020 & 2033
- Table 10: Global Passive Electronic Components Market In The Oil & Gas Industry Revenue Million Forecast, by Country 2020 & 2033
Frequently Asked Questions
1. What is the projected Compound Annual Growth Rate (CAGR) of the Passive Electronic Components Market In The Oil & Gas Industry?
The projected CAGR is approximately 3.90%.
2. Which companies are prominent players in the Passive Electronic Components Market In The Oil & Gas Industry?
Key companies in the market include Vishay Intertechnology Inc, AVX Corporation (Kyocera Corporation), KEMET Corporation (Yageo Company), Lelon Electronics Corp, API Delevan (Fortive Corporation), TE Connectivity, Cornell Dubilier Electronics Inc, TDK Corporation, Ohmite Manufacturing Company, Panasonic Corporation, Honeywell International Inc *List Not Exhaustive, Eaton Corporation.
3. What are the main segments of the Passive Electronic Components Market In The Oil & Gas Industry?
The market segments include Type.
4. Can you provide details about the market size?
The market size is estimated to be USD 3.53 Million as of 2022.
5. What are some drivers contributing to market growth?
Increasing Investments in Oil & Gas Industry.
6. What are the notable trends driving market growth?
Increasing Invesment in Oil & Gas Industry.
7. Are there any restraints impacting market growth?
Rising Metal Prices Impacting Component Production Costs.
8. Can you provide examples of recent developments in the market?
March 2023: Cornell Dubilier Electronics Inc. introduces the 944L series of low inductance, high current DC link film capacitors. The series uses large diameter non-inductive windings and low inductance internal bus connections resulting in equivalent series inductance (ESL) values in the 10 to 15 nano henry range. It is also available in values from 33 to 220uF with voltage ratings of 800, 1000, 1200, and 1400VDC.
9. What pricing options are available for accessing the report?
Pricing options include single-user, multi-user, and enterprise licenses priced at USD 4750, USD 5250, and USD 8750 respectively.
10. Is the market size provided in terms of value or volume?
The market size is provided in terms of value, measured in Million.
11. Are there any specific market keywords associated with the report?
Yes, the market keyword associated with the report is "Passive Electronic Components Market In The Oil & Gas Industry," which aids in identifying and referencing the specific market segment covered.
12. How do I determine which pricing option suits my needs best?
The pricing options vary based on user requirements and access needs. Individual users may opt for single-user licenses, while businesses requiring broader access may choose multi-user or enterprise licenses for cost-effective access to the report.
13. Are there any additional resources or data provided in the Passive Electronic Components Market In The Oil & Gas Industry report?
While the report offers comprehensive insights, it's advisable to review the specific contents or supplementary materials provided to ascertain if additional resources or data are available.
14. How can I stay updated on further developments or reports in the Passive Electronic Components Market In The Oil & Gas Industry?
To stay informed about further developments, trends, and reports in the Passive Electronic Components Market In The Oil & Gas Industry, consider subscribing to industry newsletters, following relevant companies and organizations, or regularly checking reputable industry news sources and publications.
Methodology
Step 1 - Identification of Relevant Samples Size from Population Database


Step 2 - Approaches for Defining Global Market Size (Value, Volume* & Price*)

Note*: In applicable scenarios
Step 3 - Data Sources
Primary Research
- Web Analytics
- Survey Reports
- Research Institute
- Latest Research Reports
- Opinion Leaders
Secondary Research
- Annual Reports
- White Paper
- Latest Press Release
- Industry Association
- Paid Database
- Investor Presentations

Step 4 - Data Triangulation
Involves using different sources of information in order to increase the validity of a study
These sources are likely to be stakeholders in a program - participants, other researchers, program staff, other community members, and so on.
Then we put all data in single framework & apply various statistical tools to find out the dynamic on the market.
During the analysis stage, feedback from the stakeholder groups would be compared to determine areas of agreement as well as areas of divergence